Lab 4: Perform Dynamic Malware Analysis
Lab 4: Perform Dynamic Malware Analysis
Module 07: Malware Threats
Lab 4: Perform Dynamic Malware Analysis
Task 1: Perform Port Monitoring using TCPView and CurrPorts
hard task to complete confusing hope not on test
D:\CEH-Tools\CEHv11 Module 07 Malware Threats\Trojans Types\Remote Access Trojans (RAT)\njRAT
njRAT v0.7d.exe
We know that the Internet uses a software protocol named TCP/IP to format and transfer data. Malware programs
corrupt the system and open system input and output ports to establish connections with remote systems, networks,
or servers to accomplish various malicious tasks. These open ports can also act as backdoors or communication
channels for other types of harmful malware and programs. They open unused ports on the victim’s machine to
connect back to the malware handlers.
You can identify the malware trying to access a particular port by installing port monitoring tools such as TCPView
and CurrPorts.
TCPView TCPView is a Windows program that shows the detailed listings of all the TCP and UDP endpoints on the system,
including the local and remote addresses, and the state of the TCP connections. It provides a subset of the Netstat
program that ships with Windows. The TCPView download includes Tcpvcon, a command-line version with the same functionality.
When TCPView runs, it enumerates all active TCP and UDP endpoints, resolving all IP addresses to their domain name versions.
CurrPorts CurrPorts is a piece of network monitoring software that displays a list of all the currently open TCP/IP and UDP
ports on a local computer. For each port in the list, information about the process that opened the port is also displayed,
including the process name, full path of the process, version information of the process (product name, file description,
etc.), the time that the process was created, and the user that created it.
In addition, CurrPorts allows you to close unwanted TCP connections, kill the process that opened the ports, and save
the TCP/UDP port information to an HTML file, XML file, or to tab-delimited text file.
CurrPorts also automatically marks suspicious TCP/UDP ports owned by unidentified applications (Applications
without version information and icons) in pink.
refer to blog
---------------------------------------------------------------------------------------------------------------------------------------
Module 07: Malware Threats
Lab 4: Perform Dynamic Malware Analysis
Task 2: Perform Process Monitoring using Process Monitor / procmon
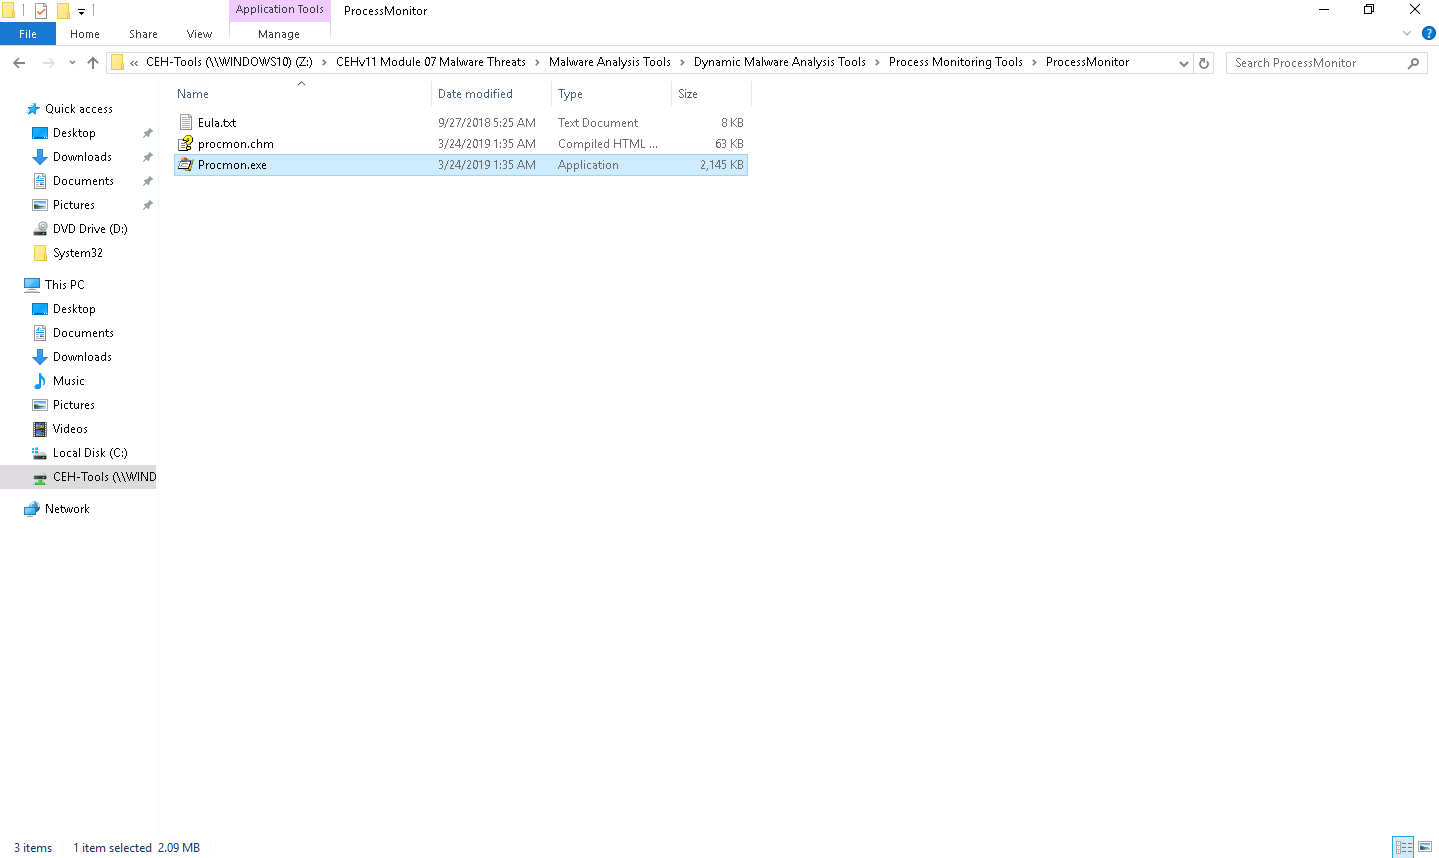
Z:\CEHv11 Module 07 Malware Threats\Malware Analysis Tools\Dynamic Malware Analysis Tools\Process Monitoring Tools\ProcessMonitor
Procmon.exe
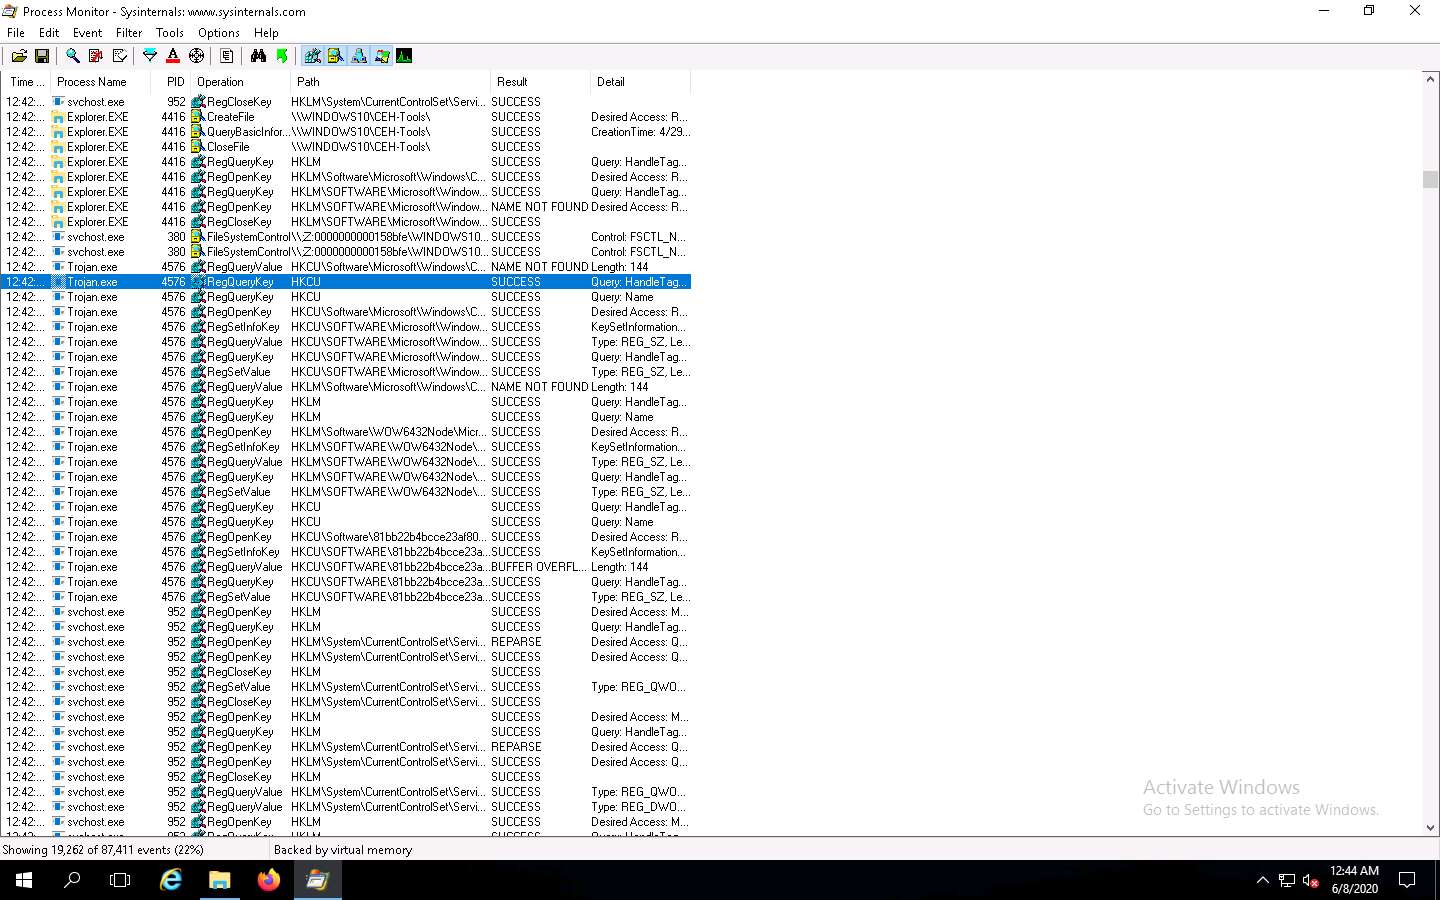
Look for the Trojan.exe process that was executed in the previous task. or any malware
or control f to find what your looking for
click on it
at the top bar go to Event, and click Properties
In the Event tab, you can see the complete details of the running process such as Date, Thread, Class, Operation, Result, Path, and Duration.
The Process tab shows the complete details of the process running,
Click the Stack tab to view the supported DLLs of the selected process.
---------------------------------------------------------------------------------------------------------------------------------------
Module 07: Malware Threats
Lab 4: Perform Dynamic Malware Analysis
Task 3: Perform Registry Monitoring using Regshot and jv16 PowerTools
super long good luck if its on test :(
The Windows registry stores OS and program configuration details such as settings and options. If the
malware is a program, the registry stores its functionality. When an attacker installs a type of malware
on the victim’s machine, it generates a registry entry. One must have a fair knowledge of the Windows registry,
its contents, and inner workings to analyze the presence of malware. Scanning for suspicious registries will
help to detect malware. While most computer users generally do not do this, monitoring the registry entries
is a great way to track any modifications made to your system.
Registry monitoring tools such as Regshot and jv16 PowerTools provide a simple way to perform the interesting
task of tracking registry modifications, which proves to be useful in troubleshooting and monitoring background changes.
Regshot Regshot is a registry compare utility that helps to compare changes in registry entries after installing
or uninstalling a program or manually modifying the registry. The purpose of this utility is to compare your registry
at two separate points by taking a snapshot of the registry before and after any program or settings are added, removed,
or otherwise modified.
jv16 PowerTools jv16 PowerTools is a PC system utility software that works by cleaning out unneeded files and data, cleaning
the Windows registry, automatically fixing system errors, and applying optimization to your system. It allows the user to scan
and monitor the Registry.
Further, jv16 helps in detecting registry entries created by malware. The “Clean and Speedup My Computer” feature of the Registry
Cleaner in jv16 PowerTools is a solution for fixing registry errors and system errors, cleaning registry leftovers, as well as managing
unneeded files such as old log files and temporary files.
Here, we will use the registry monitoring tools Regshot and jv16 PowerTools to scan the registry values for any suspicious entries
that may indicate a malware infection.
refer to blog
---------------------------------------------------------------------------------------------------------------------------------------
Module 07: Malware Threats
Lab 4: Perform Dynamic Malware Analysis
Task 4: Perform Windows Services Monitoring using Windows Service Manager (SrvMan)
Attackers design malware and other malicious code in such a way that they install and run on a computer device
in the form of a service. As most services run in the background to support processes and applications, malicious
services are invisible, even when they are performing harmful activities on the system, and can even function without
intervention or input. Malware spawns Windows services that allow attackers to control the victim machine and pass
malicious instructions remotely. Malware may also employ rootkit techniques to manipulate the following registry keys
to hide their processes and services.
HKEY_LOCAL_MACHINE\System\CurrentControlSet\Services These malicious services run as the SYSTEM account or another
privileged account, which provides more access compared to regular user accounts, making them more dangerous than common
malware and executable code. Attackers also try to conceal their actions by naming the malicious services with the names
similar to genuine Windows services to avoid detection.
You can trace malicious services initiated by the suspect file during dynamic analysis by using Windows service monitoring
tools such as Windows Service Manager (SrvMan), which can detect changes in services and scan for suspicious Windows services.
SrvMan has both GUI and Command-line modes. It can also be used to run arbitrary Win32 applications as services
(when such a service is stopped, the main application window automatically closes).
Here, we will use the SrvMan tool to check for suspicious windows services.
D:\CEH-Tools\CEHv11 Module 07 Malware Threats\Malware Analysis Tools\Dynamic Malware Analysis Tools\
Windows Services Monitoring Tools\Windows Service Manager (SrvMan)\srvman-1.0\x64
srvman.exe.
Internal name, State, Type, Display name, Start type, and Executable data of the services.
Here, you can choose any unwanted service that is running on your computer, and Stop or Delete
You can view the properties of the selected service by clicking on Properties.
To add a new service to your machine, click the Add service button.
To delete any running or stopped service, click the Delete service button.
---------------------------------------------------------------------------------------------------------------------------------------
Module 07: Malware Threats
Lab 4: Perform Dynamic Malware Analysis
Task 5: Perform Startup Program Monitoring using Autoruns for Windows and WinPatrol
Startup programs are applications or processes that start when your system boots up. Attackers make many malicious
programs such as Trojans and worms in such a way that they are executed during startup, and the user is unaware of
the malicious program running in the background.
An ethical hacker or penetration tester must identify the applications or processes that start when a system boots up
and remove any unwanted or malicious programs that can breach privacy or affect a system’s health. Therefore, scanning
for suspicious startup programs manually or using startup program monitoring tools like Autoruns for Windows and WinPatrol
is essential for detecting malware.
Autoruns for Windows This utility can auto-start the location of any startup monitor, display which programs are configured
to run during system bootup or login, and show the entries in the order Windows processes them. As soon as this program is
included in the startup folder, Run, RunOnce, and other Registry keys, users can configure Autoruns to show other locations,
including Explorer shell extensions, toolbars, browser helper objects, Winlogon notifications, and auto-start services.
Autoruns’ Hide Signed Microsoft Entries option helps the user zoom in on third-party auto-starting images that add to the
users’ system, and it has support for looking at the auto-starting images configured for other accounts configured on the
system.
WinPatrol WinPatrol provides the user with 14 different tabs to help in monitoring the system and its files. This security
utility gives the user a chance to look for programs that are running in the background of a system so that the user can
take a closer look and control the execution of legitimate and malicious programs.
refer to blog
---------------------------------------------------------------------------------------------------------------------------------------
Module 07: Malware Threats
Lab 4: Perform Dynamic Malware Analysis
Task 6: Perform Installation Monitoring using Mirekusoft Install Monitor
When the system or users install or uninstall any software application, there is a chance
that it will leave traces of the application data on the system. Installation monitoring help
to detect hidden and background installations that malware performs.
Mirekusoft Install Monitor automatically monitors what gets placed on your system and allows you
to uninstall it completely. Install Monitor works by monitoring what resources such as file and registry,
are created when a program is installed. It provides detailed information about the software installed, including
how much disk space, CPU, and memory your programs are using. It also provides information about how often you use different
programs. A program tree is a useful tool that can show you which programs were installed together.
Here, we will use the Mirekusoft Install Monitor tool to detect hidden and background installations.
refer to blog
---------------------------------------------------------------------------------------------------------------------------------------
Module 07: Malware Threats
Lab 4: Perform Dynamic Malware Analysis
Task 7: Perform Files and Folder Monitoring using PA File Sight
Malware can modify system files and folders to save information in them. You should be able to find the files and folders
that malware creates and analyze them to collect any relevant stored information. These files and folders may also contain
hidden program code or malicious strings that the malware plans to execute on a specific schedule.
An ethical hacker or penetration tester must scan the system for suspicious files and folders using file and folder monitoring
tools such as PA File Sight to detect any malware installed and any system file modifications. PA File Sight is a protection and
auditing tool. It detects ransomware attacks coming from a network and stops them.
refer to blog
---------------------------------------------------------------------------------------------------------------------------------------
Module 07: Malware Threats
Lab 4: Perform Dynamic Malware Analysis
Task 8: Perform Device Driver Monitoring using DriverView and Driver Booster
When the user downloads infected drivers from untrusted sources, the system installs malware along with the device drivers;
malware uses these drivers as a shield to avoid detection. One can scan for suspicious device drivers using tools such as
DriverView and Driver Booster that verify if they are genuine and downloaded from the publisher’s original site.
DriverView The DriverView utility displays a list of all device drivers currently loaded on the system. For each driver in the
list, additional information is displayed such as the load address of the driver, description, version, product name, and developer.
Driver Booster Without proper drivers, computers start to misbehave. Sometimes updating the drivers using conventional methods
can be a daunting task. Outdated drivers are more vulnerable to hacking and can lead to a breach in the system. Driver Booster
provides a better way of updating the drivers with its all-in-one command center with automatic backup and updates, which helps
the smooth functioning of the system.
An ethical hacker and penetration tester must scan the system for suspicious device drivers and make sure that the systems runs
smoothly by ensuring that all outdated drivers are updated and that the system processes optimized to keep the performance of
the system at its peak.
refer to blog
---------------------------------------------------------------------------------------------------------------------------------------
Lab Scenario
Dynamic Malware Analysis, also known as behavioral analysis, involves executing malware code to learn how it interacts with the host system and its impact after infecting the system.
Dynamic analysis involves the execution of malware to examine its conduct and operations and identify technical signatures that confirm the malicious intent. It reveals information such as domain names, file path locations, created registry keys, IP addresses, additional files, installation files, and DLL and linked files located on the system or network.
This type of analysis requires a safe environment such as machines and sandboxes to deter the spreading of malware. The environment design should include tools that can capture every movement of the malware in detail and give feedback. Typically, systems act as a base for conducting such experiments.
An ethical hacker and pen tester must perform dynamic malware analysis to find out about the applications and processes running on a computer and remove unwanted or malicious programs that can breach privacy or affect the system’s health.
Lab Objectives
- Perform port monitoring using TCPView and CurrPorts
- Perform process monitoring using Process Monitor
- Perform registry monitoring using Regshot and jv16 PowerTools
- Perform Windows services monitoring using Windows Service Manager (SrvMan)
- Perform startup program monitoring using Autoruns for Windows and WinPatrol
- Perform installation monitoring using Mirekusoft Install Monitor
- Perform files and folder monitoring using PA File Sight
- Perform device driver monitoring using DriverView and Driver Booster
- Perform DNS monitoring using DNSQuerySniffer
Overview of Dynamic Malware Analysis
Dynamic analysis is performed to gather valuable information about malware activity, including the files and folders created, ports and URLs accessed, called functions and libraries, applications and tools accessed, information transferred, settings modified processes, and services the malware started, and other items. You should design and set up the environment for performing the dynamic analysis in such a way that the malware cannot propagate to the production network, and ensure that the testing system can recover to an earlier set timeframe (prior to launching the malware) in case anything goes wrong during the test.
To achieve this, you need to perform the following:
System Baselining Baselining refers to the process of capturing a system’s state (taking snapshot of the system) at the time the malware analysis begins. This can be used to compare the system’s state after executing the malware file, which will help understand the changes that the malware has made across the system. A system baseline involves recording details of the file system, registry, open ports, network activity, and other items.
Host Integrity Monitoring Host integrity monitoring is the process of studying the changes that have taken place across a system or a machine after a series of actions or incidents. It involves using the same tools to take a snapshot of the system before and after the incident or actions and analyzing the changes to evaluate the malware’s impact on the system and its properties. In malware analysis, host integrity monitoring helps to understand the runtime behavior of a malware file as well as its activities, propagation techniques, URLs accessed, downloads initiated, and other characteristics.
Host integrity monitoring includes:
- Port monitoring
- Process monitoring
- Registry monitoring
- Windows services monitoring
- Startup program monitoring
- Event logs monitoring and analysis
- Installation monitoring
- Files and folder monitoring
- Device driver monitoring
- Network traffic monitoring and analysis
- DNS monitoring and resolution
- API calls monitoring
Task 1: Perform Port Monitoring using TCPView and CurrPorts
We know that the Internet uses a software protocol named TCP/IP to format and transfer data. Malware programs corrupt the system and open system input and output ports to establish connections with remote systems, networks, or servers to accomplish various malicious tasks. These open ports can also act as backdoors or communication channels for other types of harmful malware and programs. They open unused ports on the victim’s machine to connect back to the malware handlers.
You can identify the malware trying to access a particular port by installing port monitoring tools such as TCPView and CurrPorts.
TCPView TCPView is a Windows program that shows the detailed listings of all the TCP and UDP endpoints on the system, including the local and remote addresses, and the state of the TCP connections. It provides a subset of the Netstat program that ships with Windows. The TCPView download includes Tcpvcon, a command-line version with the same functionality. When TCPView runs, it enumerates all active TCP and UDP endpoints, resolving all IP addresses to their domain name versions.
CurrPorts CurrPorts is a piece of network monitoring software that displays a list of all the currently open TCP/IP and UDP ports on a local computer. For each port in the list, information about the process that opened the port is also displayed, including the process name, full path of the process, version information of the process (product name, file description, etc.), the time that the process was created, and the user that created it.
In addition, CurrPorts allows you to close unwanted TCP connections, kill the process that opened the ports, and save the TCP/UDP port information to an HTML file, XML file, or to tab-delimited text file.
CurrPorts also automatically marks suspicious TCP/UDP ports owned by unidentified applications (Applications without version information and icons) in pink.
This lab activity demonstrates how to analyze malicious processes running on a machine using TCPView and CurrPorts. Here, you will first create a server using njRAT, and then execute this server from the second machine. Later, you will run the TCPView and CurrPorts applications on the second machine and find that the process associated with the server is running on it.
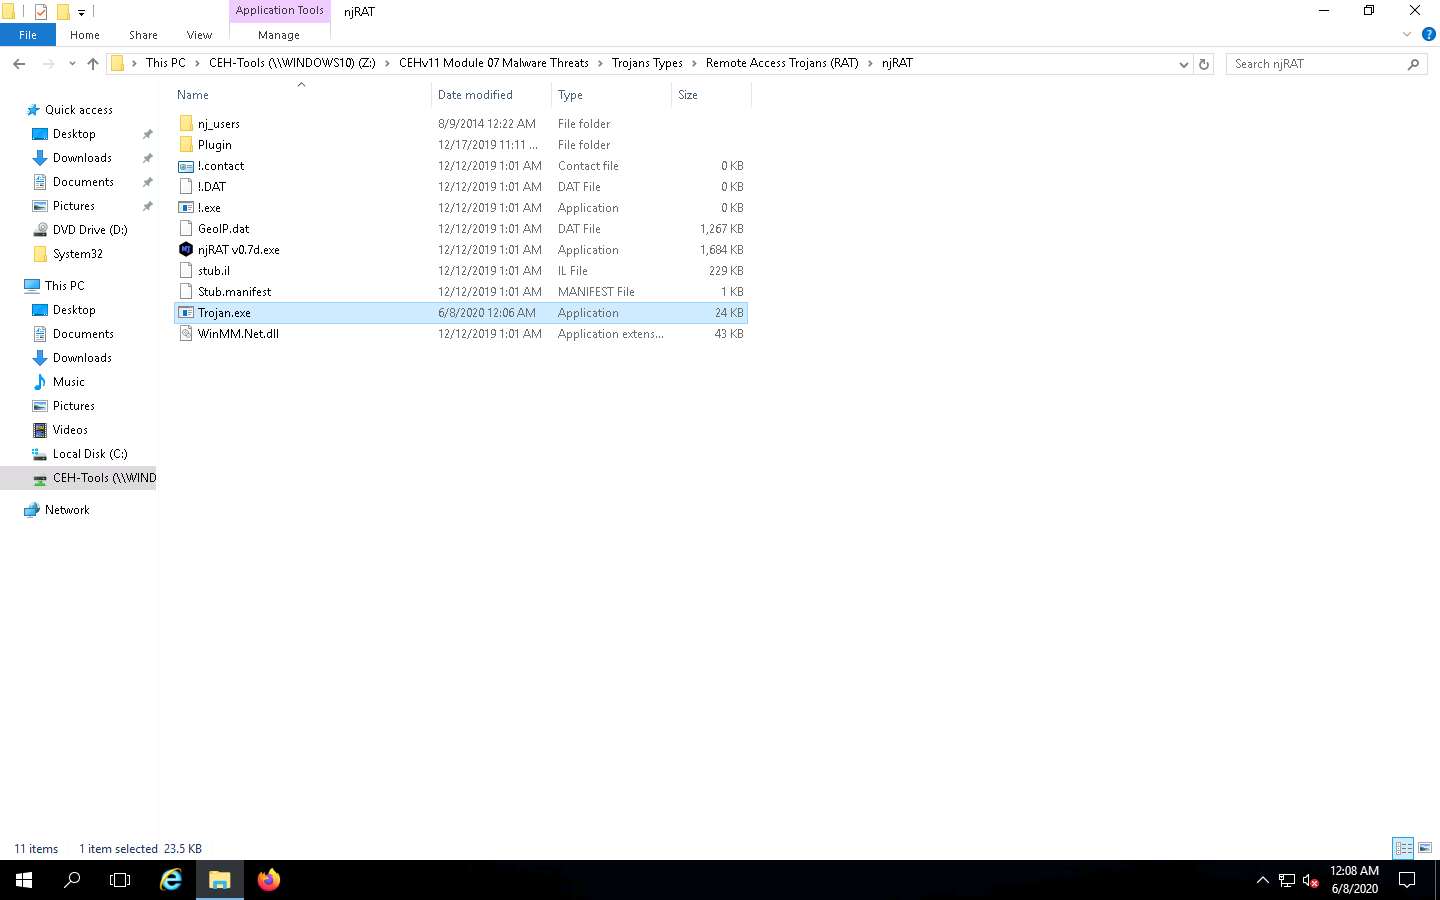
On the Windows 10 machine, navigate to D:\CEH-Tools\CEHv11 Module 07 Malware Threats\Trojans Types\Remote Access Trojans (RAT)\njRAT and double-click njRAT v0.7d.exe to launch njRAT.
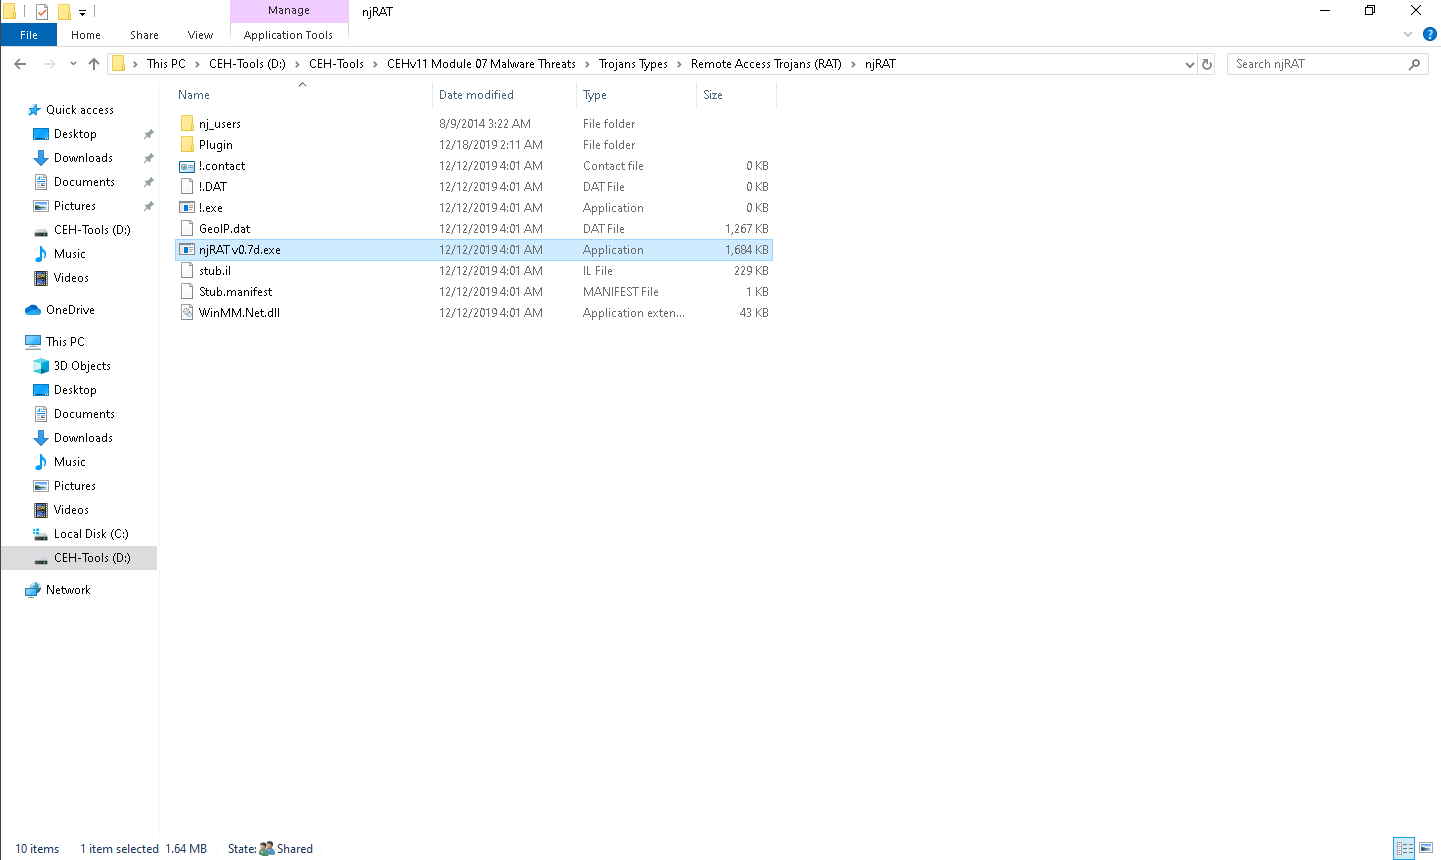
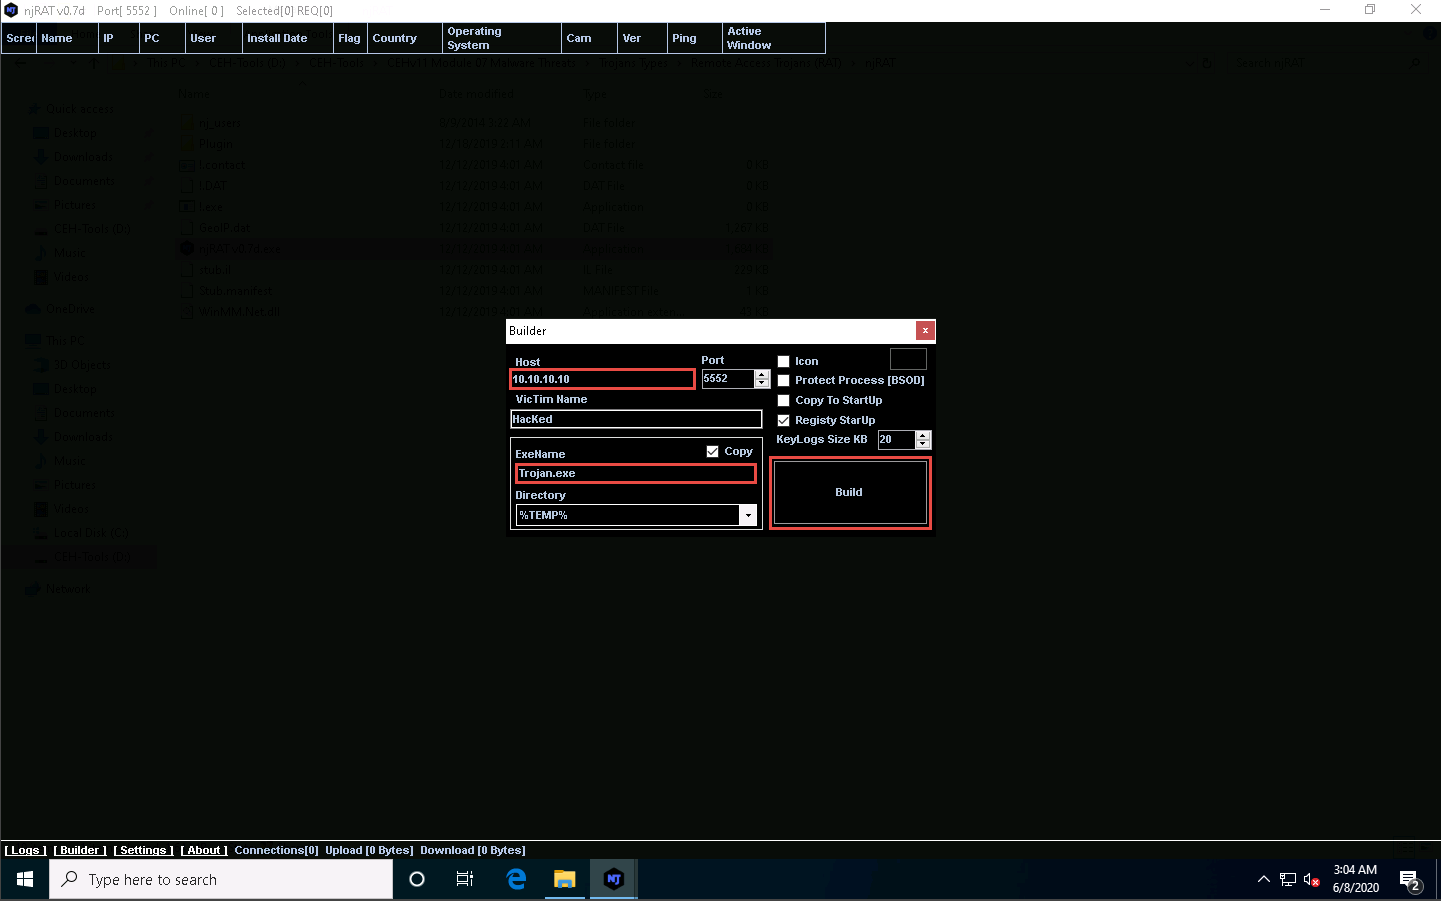
Create a server and save it to D:\CEH-Tools\CEHv11 Module 07 Malware Threats\Trojans Types\Remote Access Trojans (RAT)\njRAT.
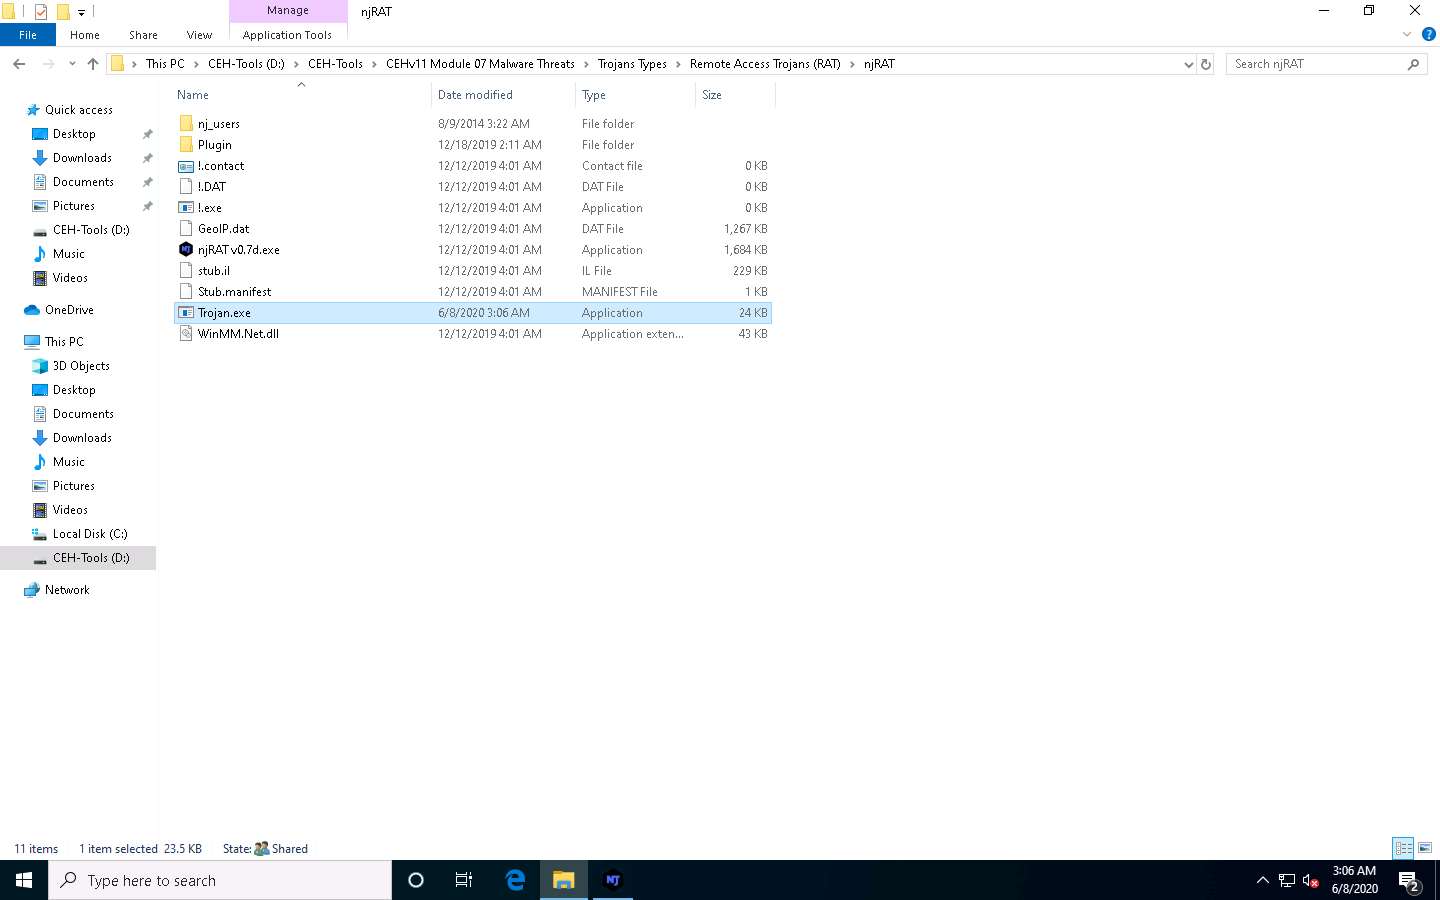
While building the server, assign the server name Trojan.exe for demonstration purposes.
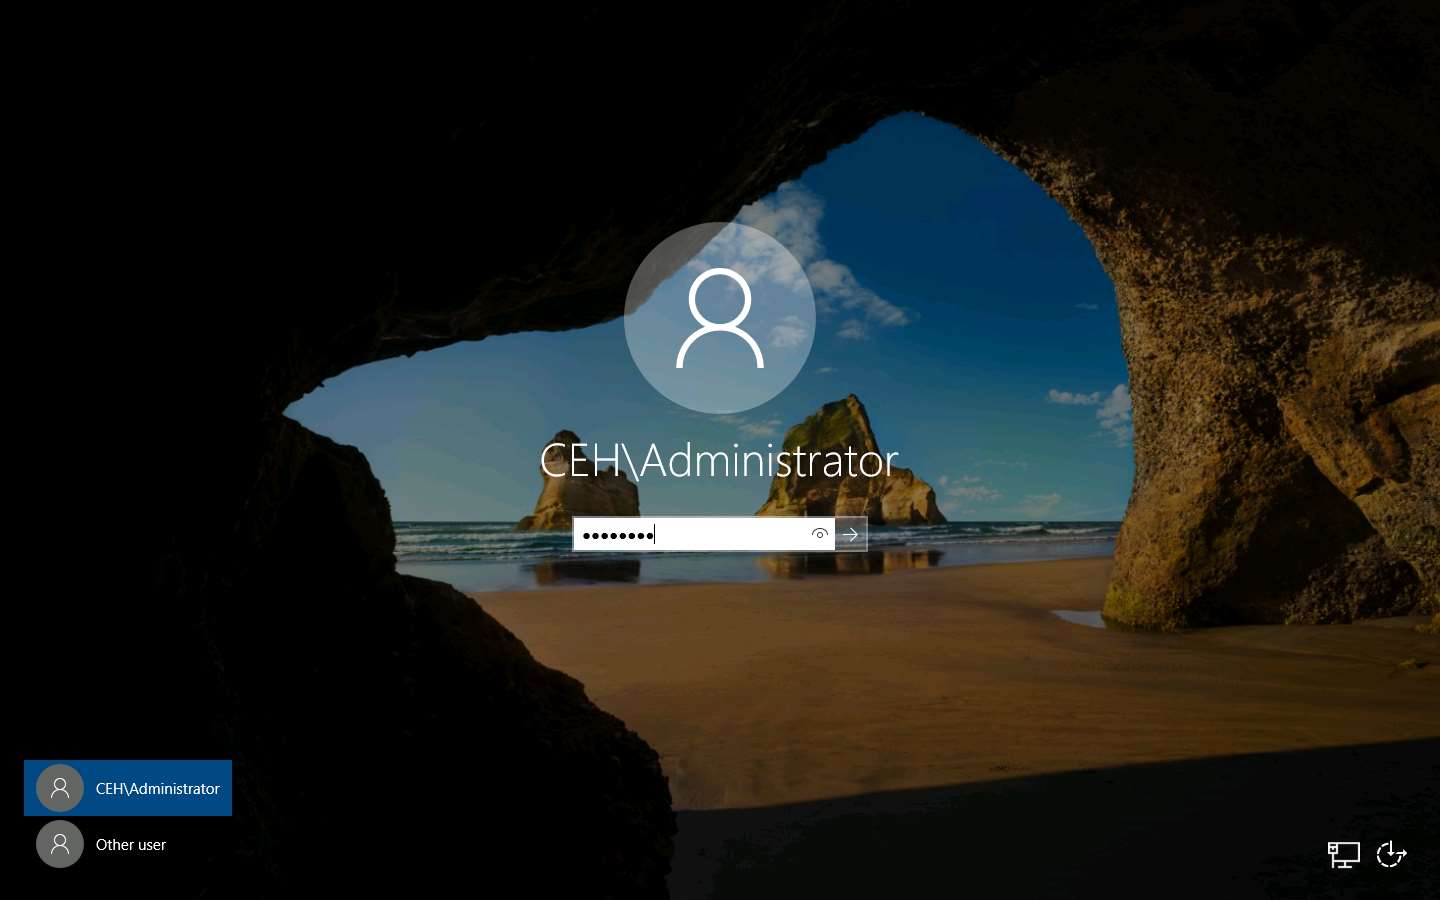
Click Windows Server 2016 to switch to the Windows Server 2016 machine. Click Ctrl+Alt+Delete to activate the machine, by default, CEH\Administrator account is selected, click Pa$$w0rd to enter the password and press Enter.
Navigate to Z:\CEHv11 Module 07 Malware Threats\Trojans Types\Remote Access Trojans (RAT)\njRAT and double-click Trojan.exe.
Observe that a connection has been established by the njRAT client. Click Windows 10 to switch to the Windows 10 machine to observe the established connection.
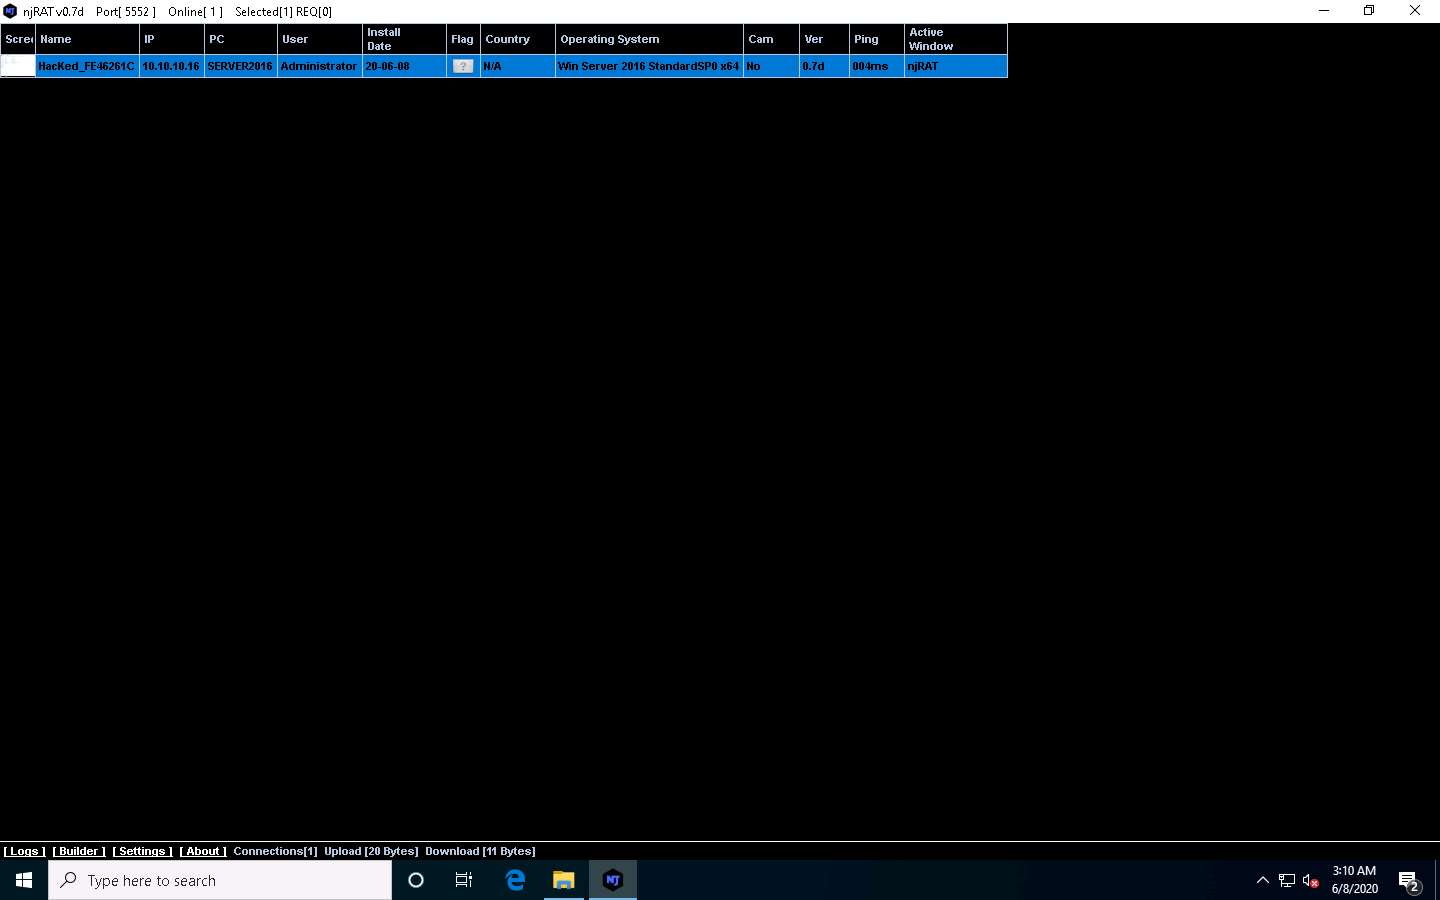
Now, let us analyze this process on Windows Server 2016 using TCPView tool. Click Windows Server 2016 to switch back to the Windows Server 2016 machine.
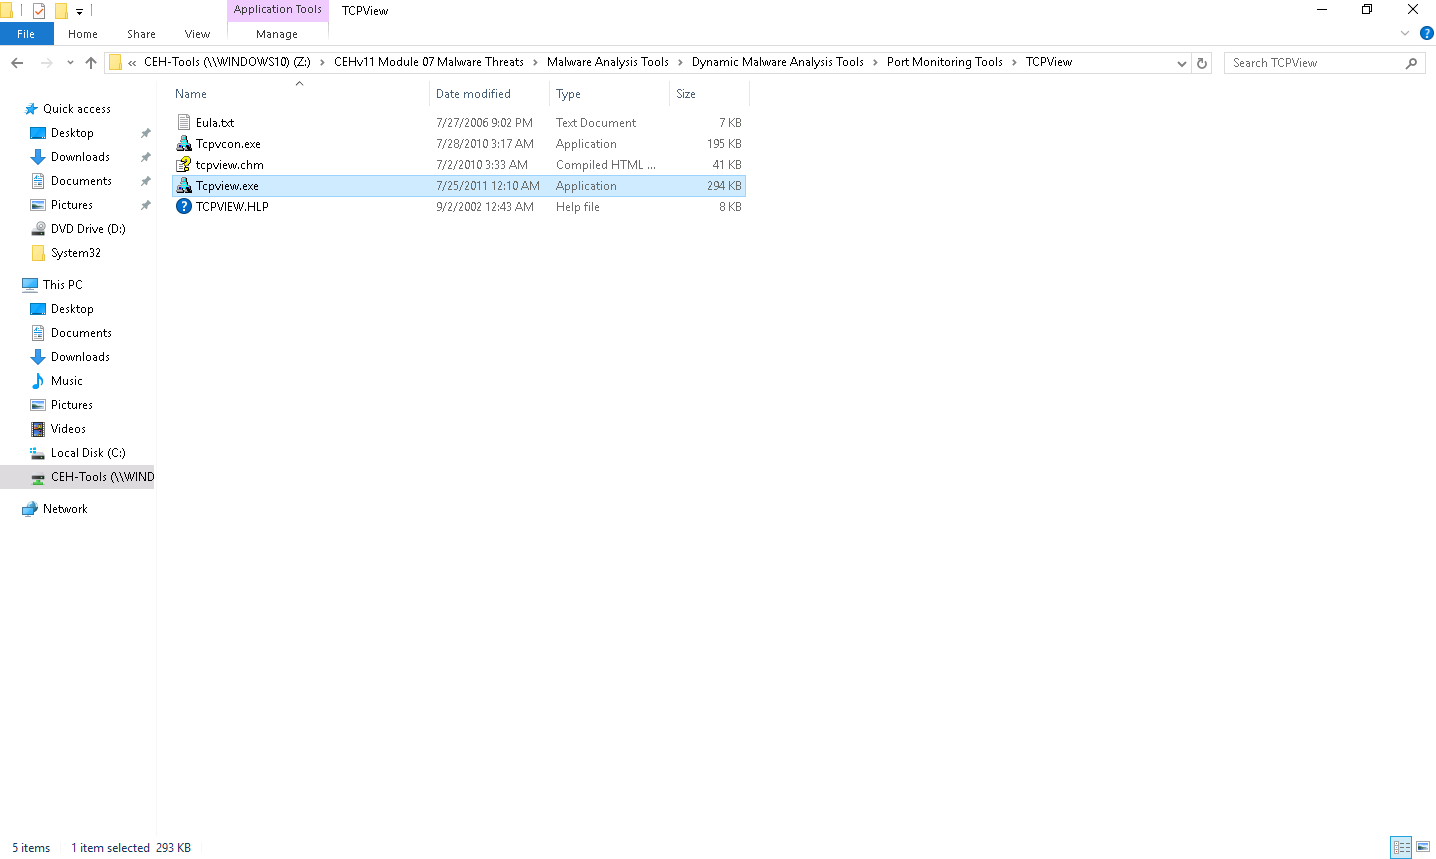
Navigate to Z:\CEHv11 Module 07 Malware Threats\Malware Analysis Tools\Dynamic Malware Analysis Tools\Port Monitoring Tools\TCPView and double-click Tcpview.exe to launch the application.
If a User Account Control pop-up appears, click Yes.
If a TCPView License Agreement window appears, click the Agree button to agree to the terms and conditions.
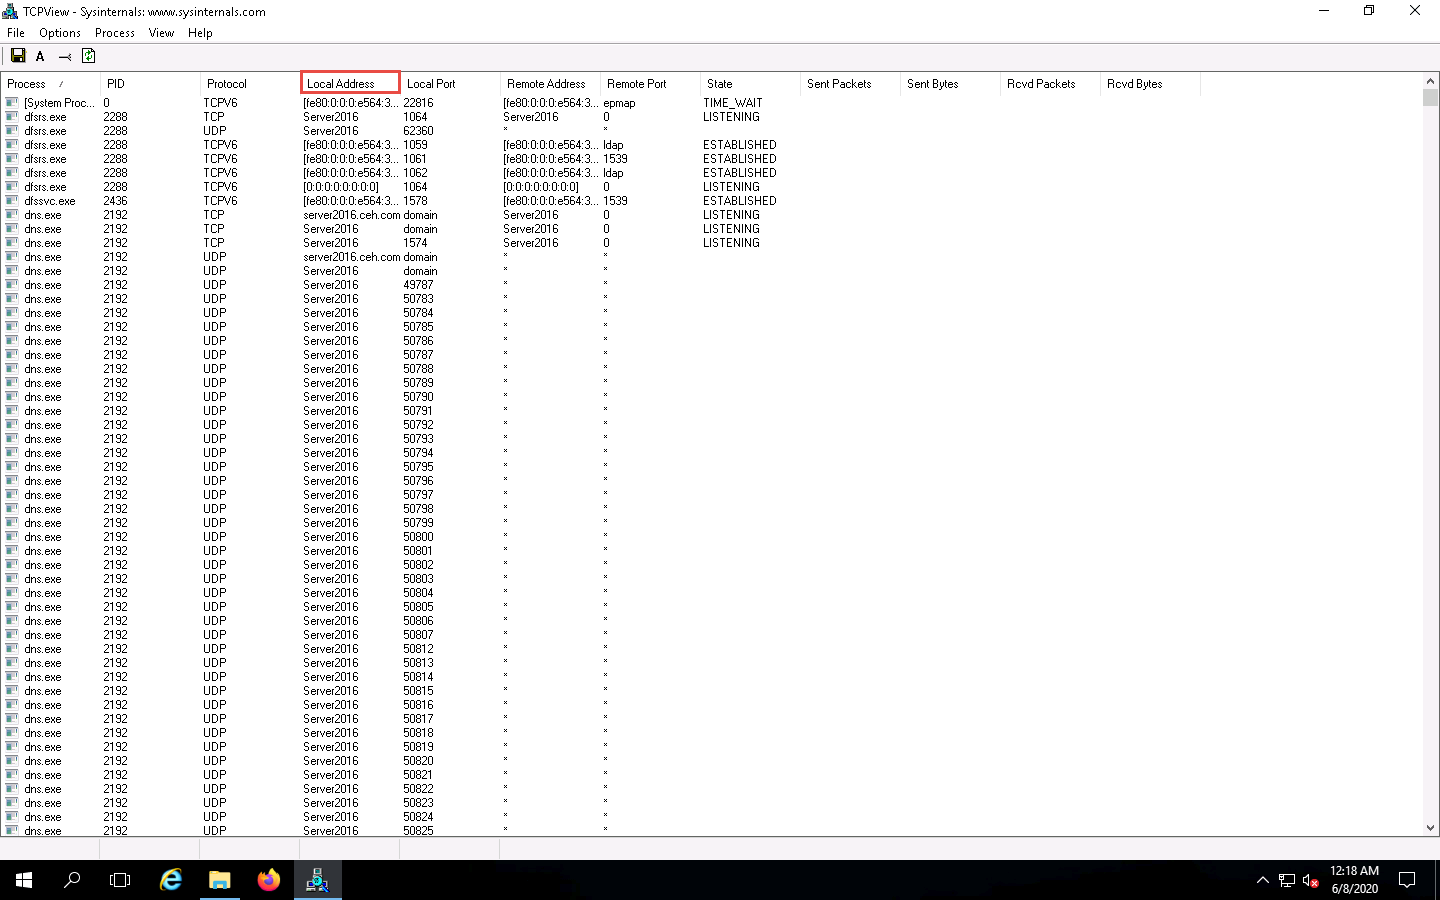
The TCPView main window appears, displaying the details such as Process, ProcessId, Protocol, Local Address, Local Port, Remote Address, Remote Port, and State, as shown in the screenshot.
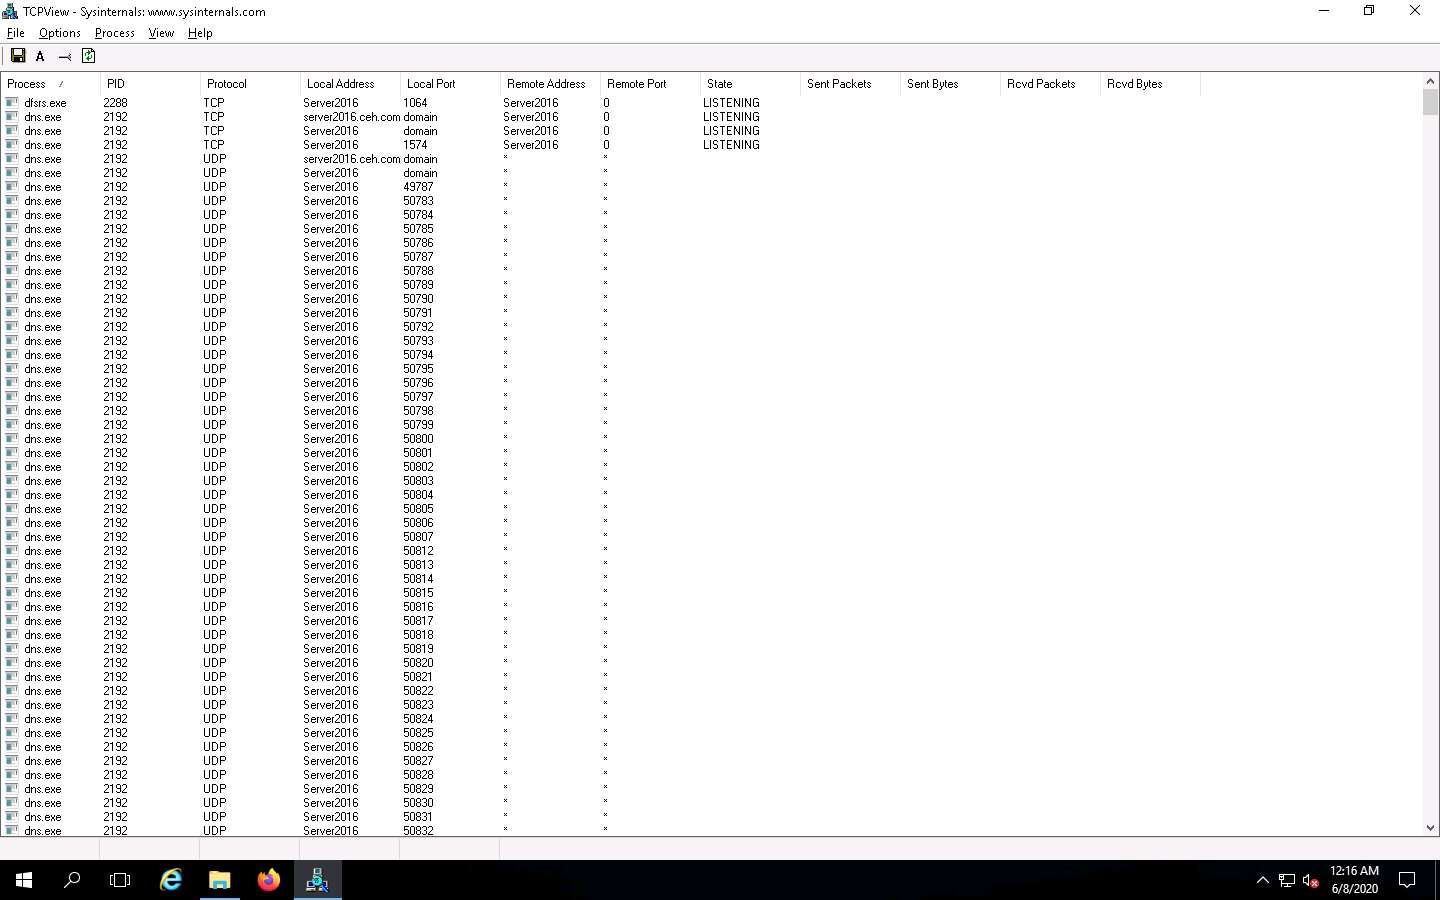
TCPView performs Port monitoring. Click the Local Port tab to view the ports in serial order.
Observe the protocols running on different ports under the Protocol column.
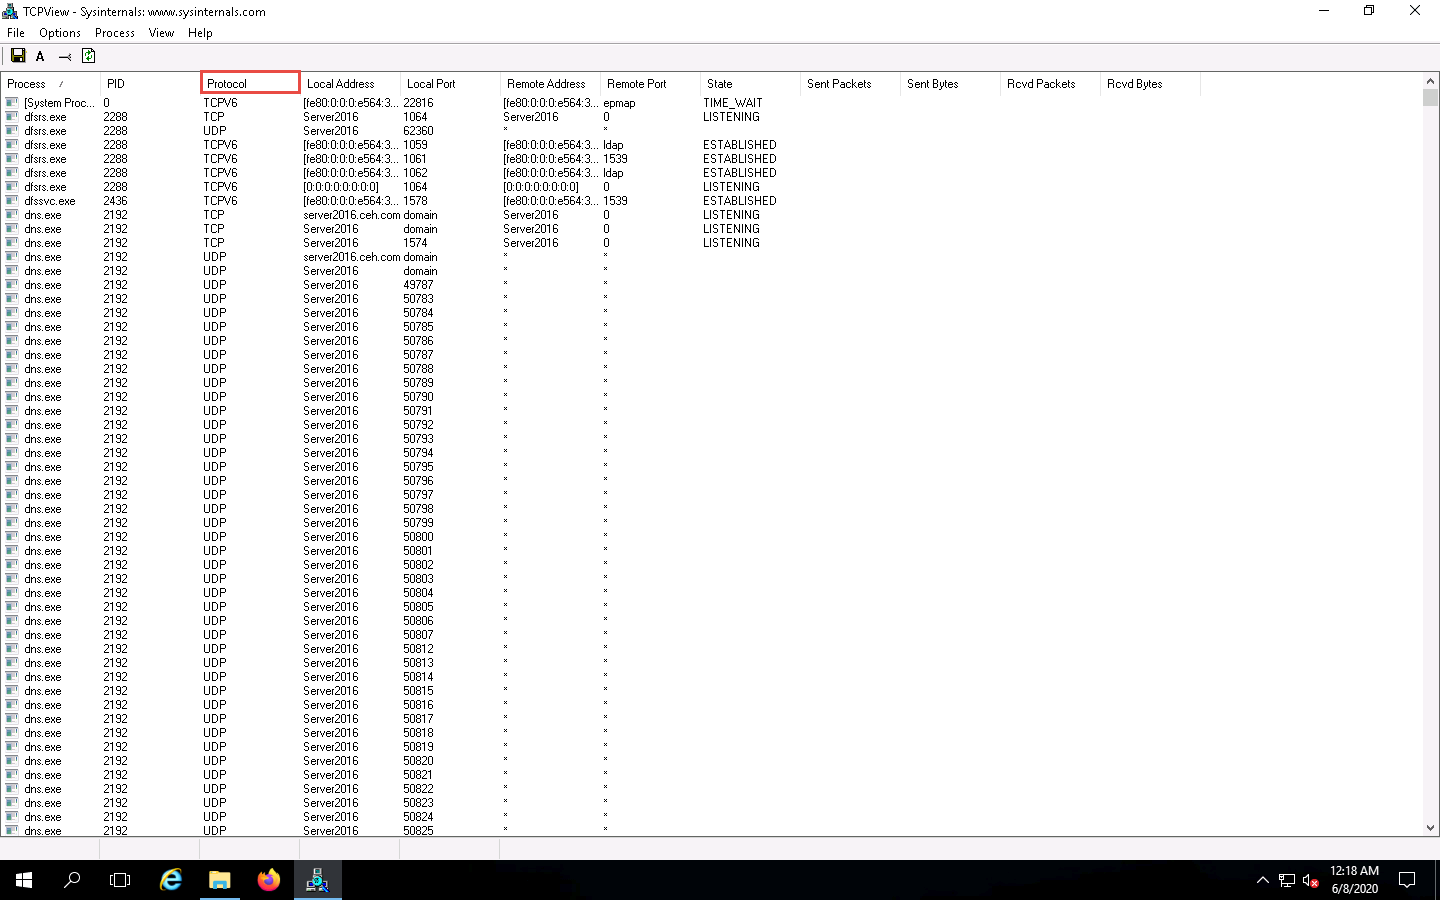
As you have executed a malicious application, now search for the Trojan.exe process in the TCPView.
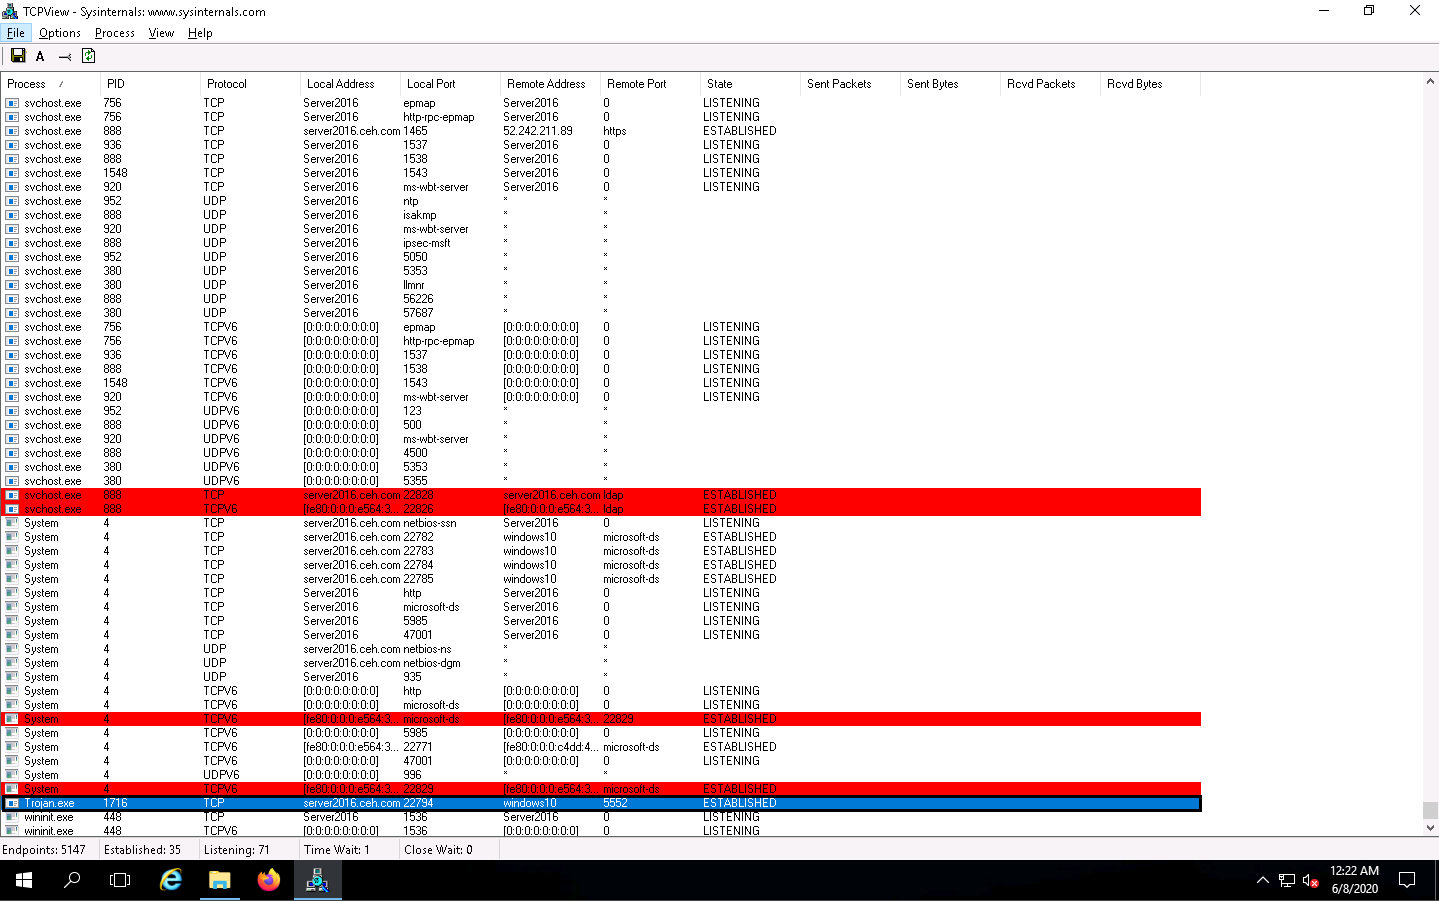
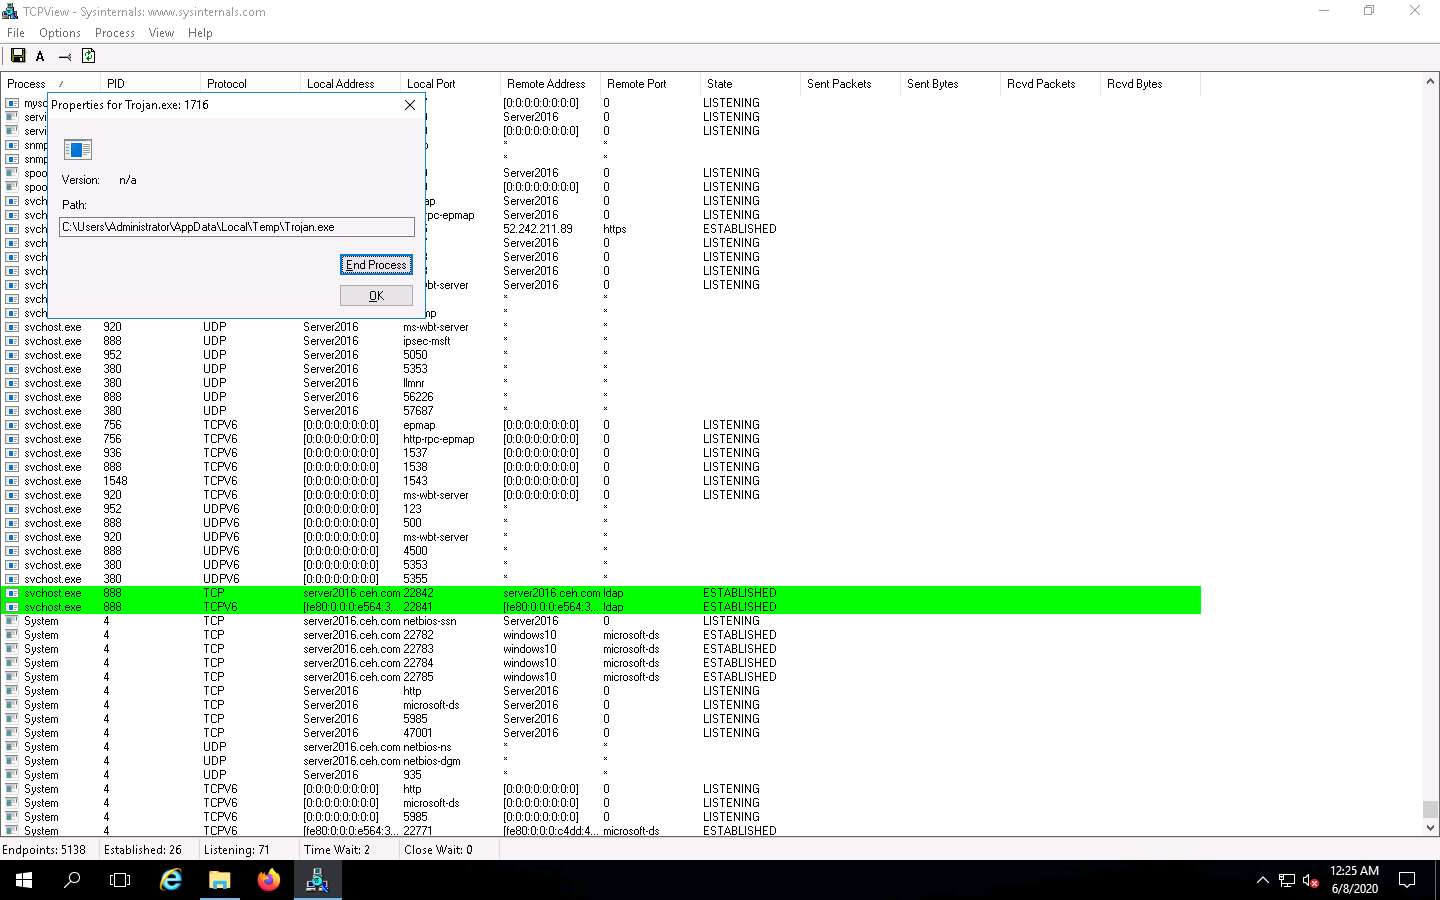
You can observe that the Trojan.exe malicious program is running on the Windows Server 2016 machine. You can see details such as Remote Address and Remote Port.
To see the process properties, navigate to Process, and then click Process Properties.
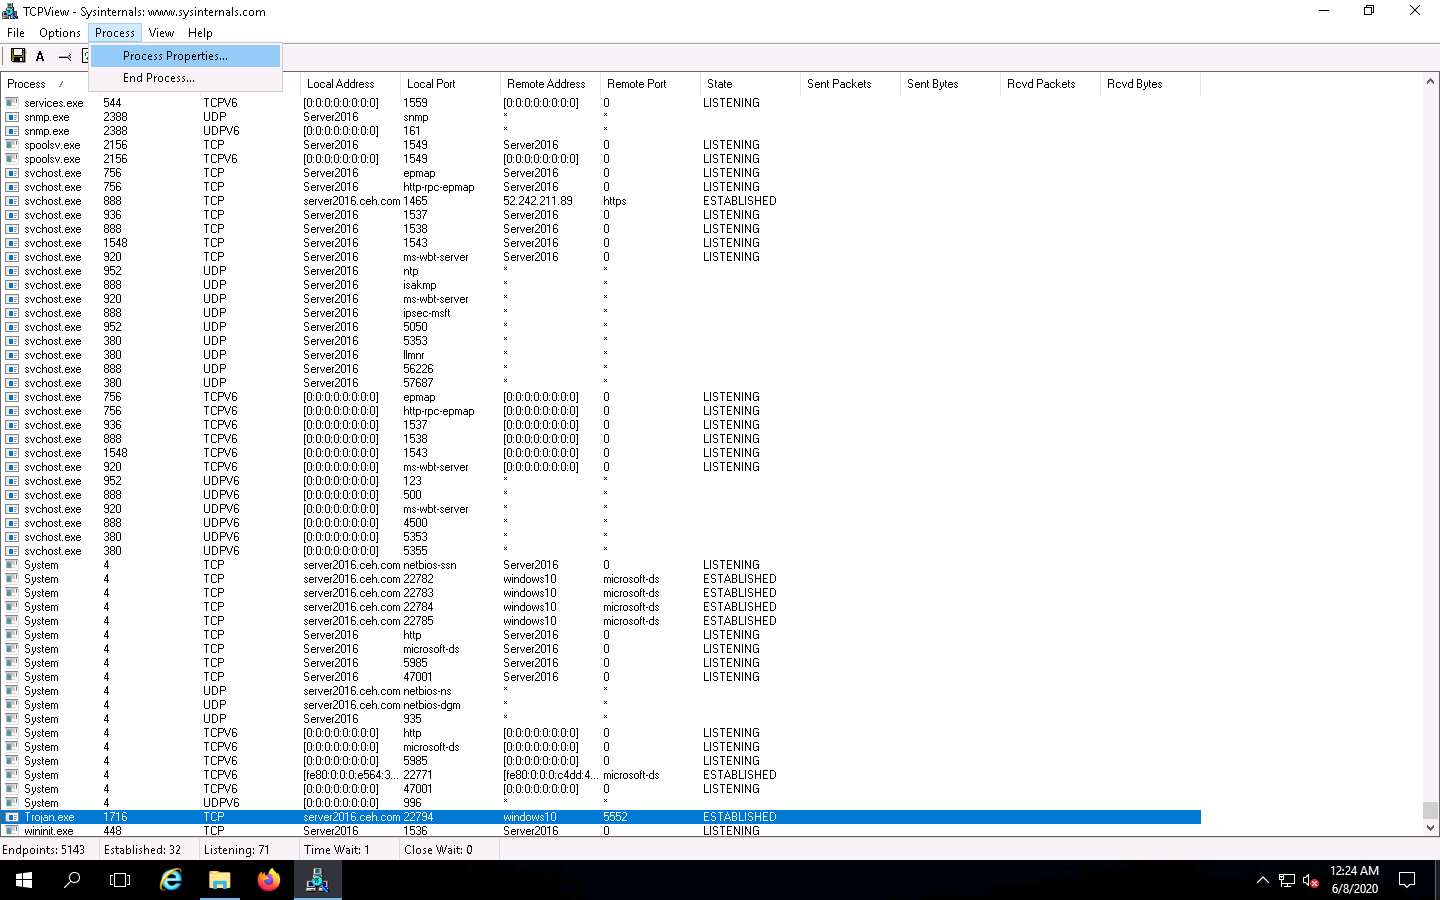
The properties for the selected process window appears (here, Trojan.exe); click End Process to kill the process. This will end the running process.
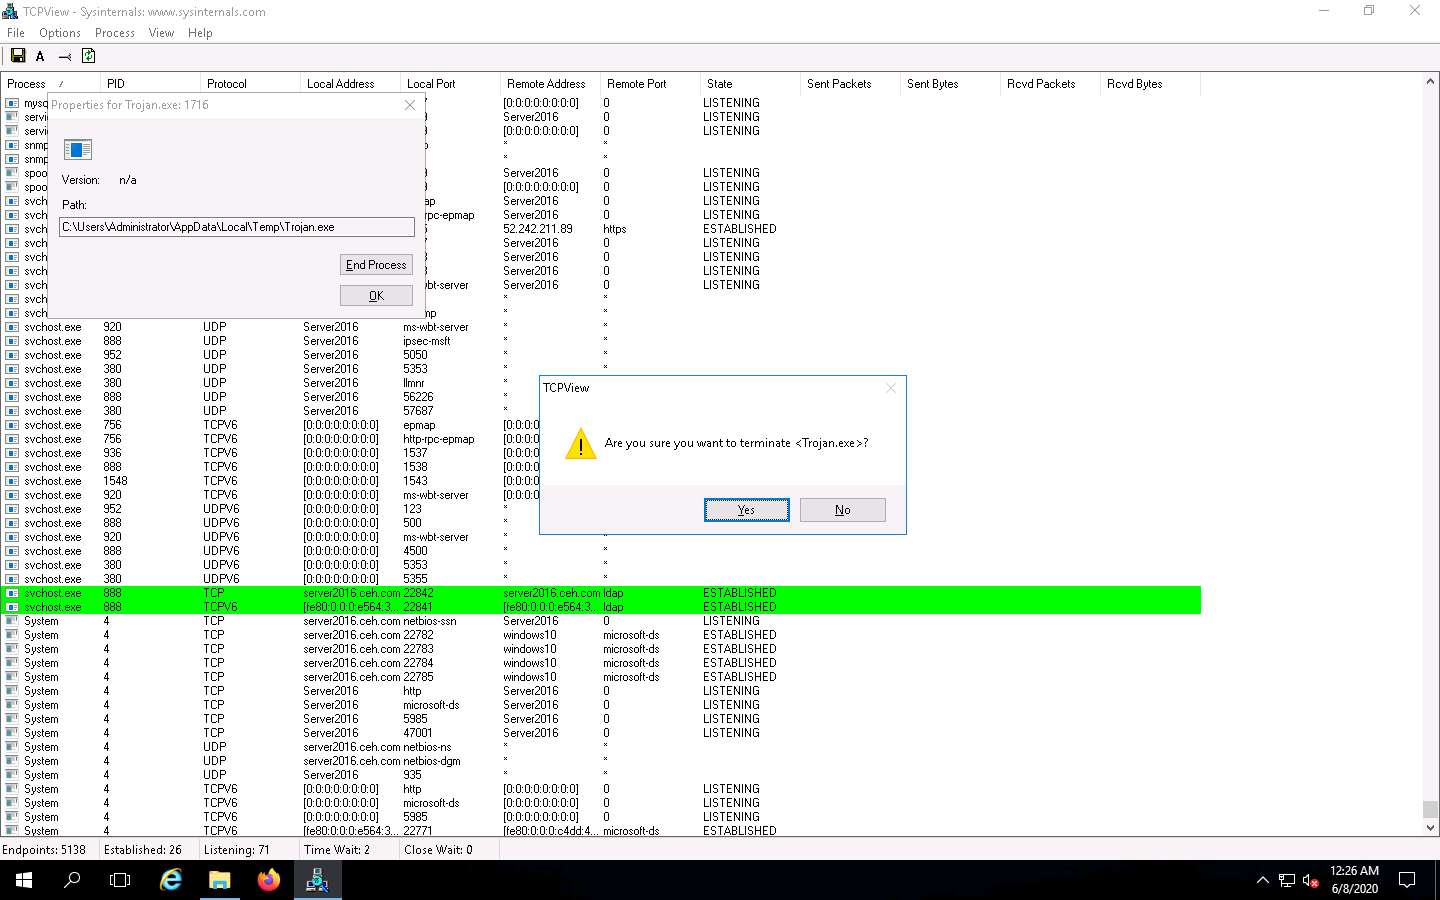
Normally, if a TCPView dialog box appears, click Yes to terminate the process. However, for this lab, do not Kill the process in this step as we are going to use this running process for the next task; click No.
This way, you can view all processes running on the machine and stop unwanted or malicious processes that may affect your system. If you are unable to stop a process, you can view the port on which it is running and add a firewall rule to block the port.
Close the TCPView window.
Now, let us analyze this process on Windows Server 2016 using CurrPorts.
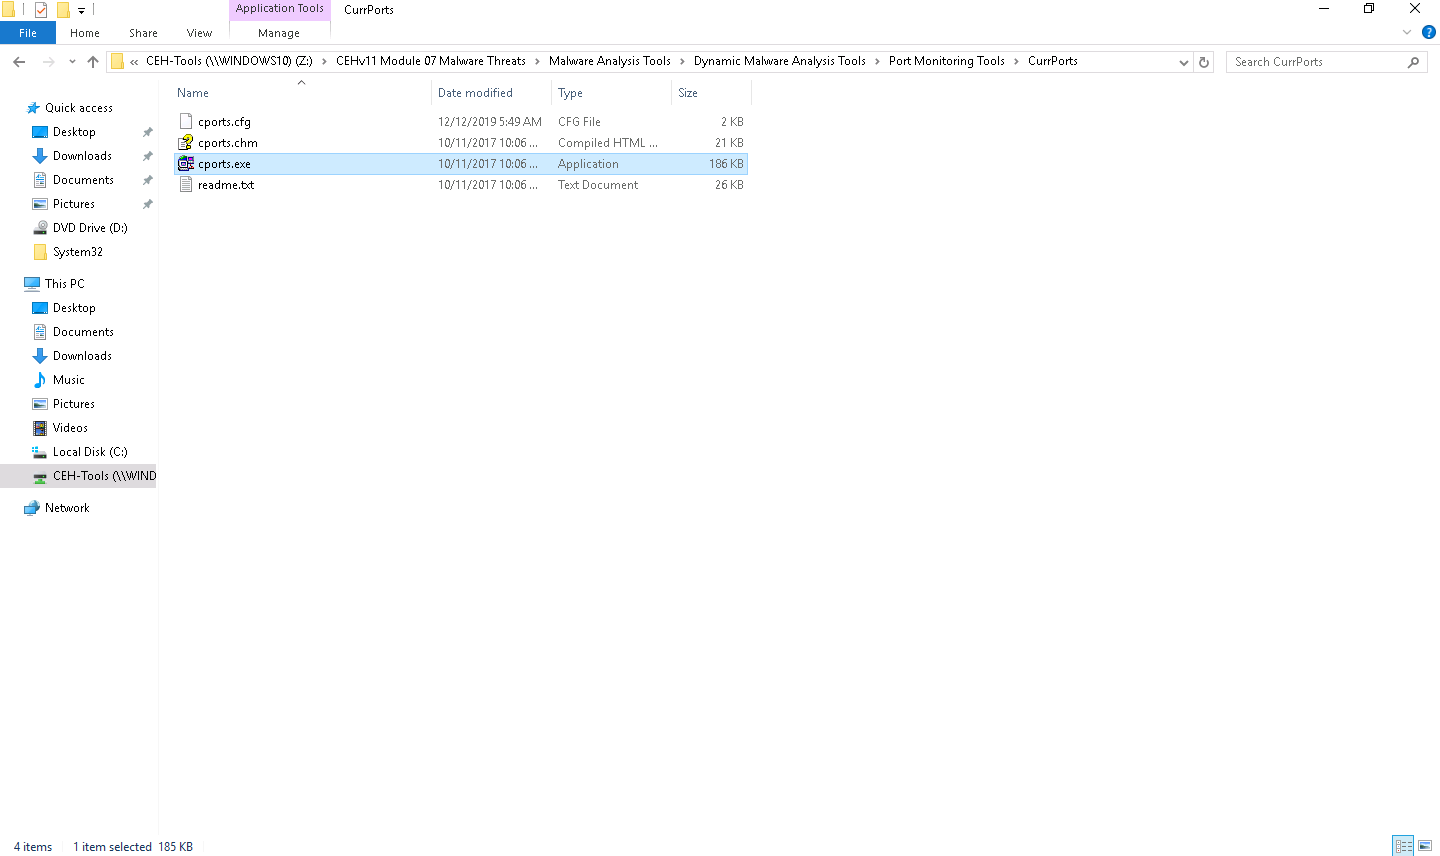
Navigate to Z:\CEHv11 Module 07 Malware Threats\Malware Analysis Tools\Dynamic Malware Analysis Tools\Port Monitoring Tools\CurrPorts and double-click cports.exe.
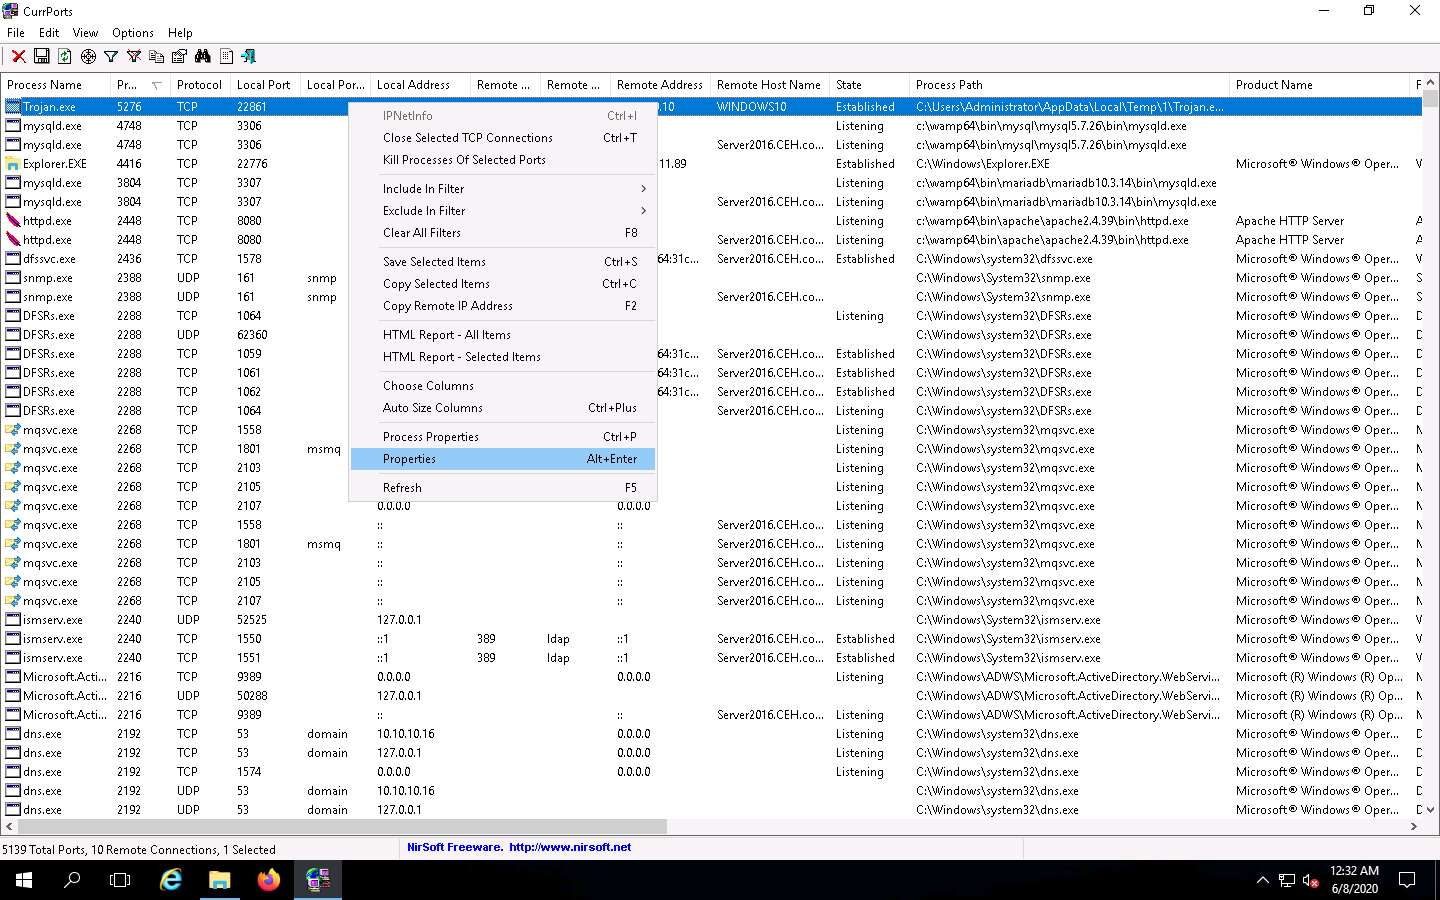
The CurrPorts window appears, displaying a list of currently open TCP/IP and UDP ports on the machine. Here, you can observe the Trojan.exe process running on the machine, as the shown in the screenshot.
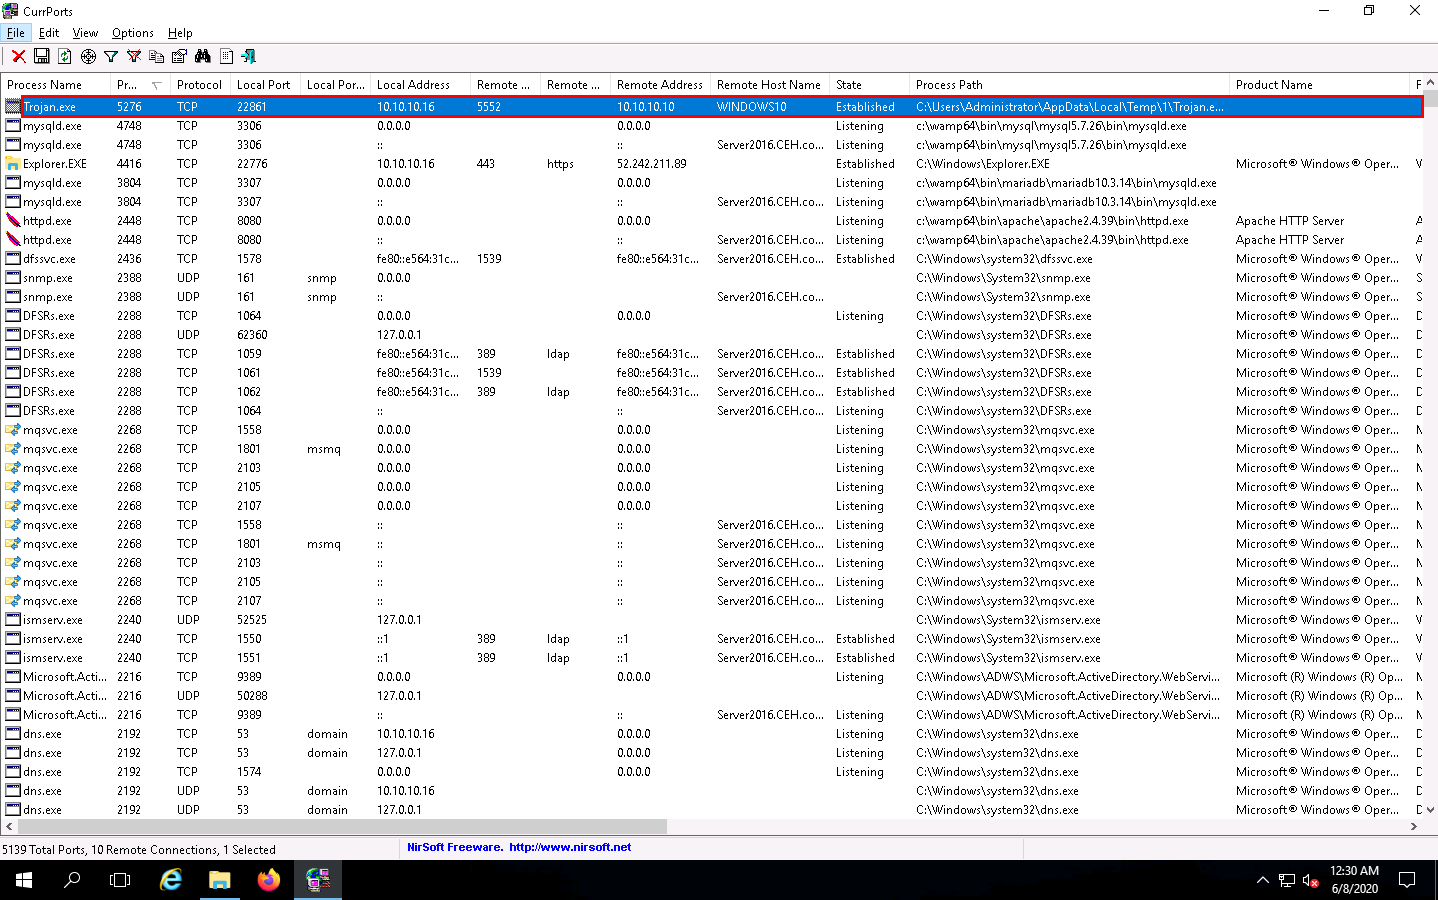
It is evident from the above screenshot that the process is connected to the machine on port 5552.
You can view the properties of the process by right-clicking on the process and clicking Properties from the Context menu.
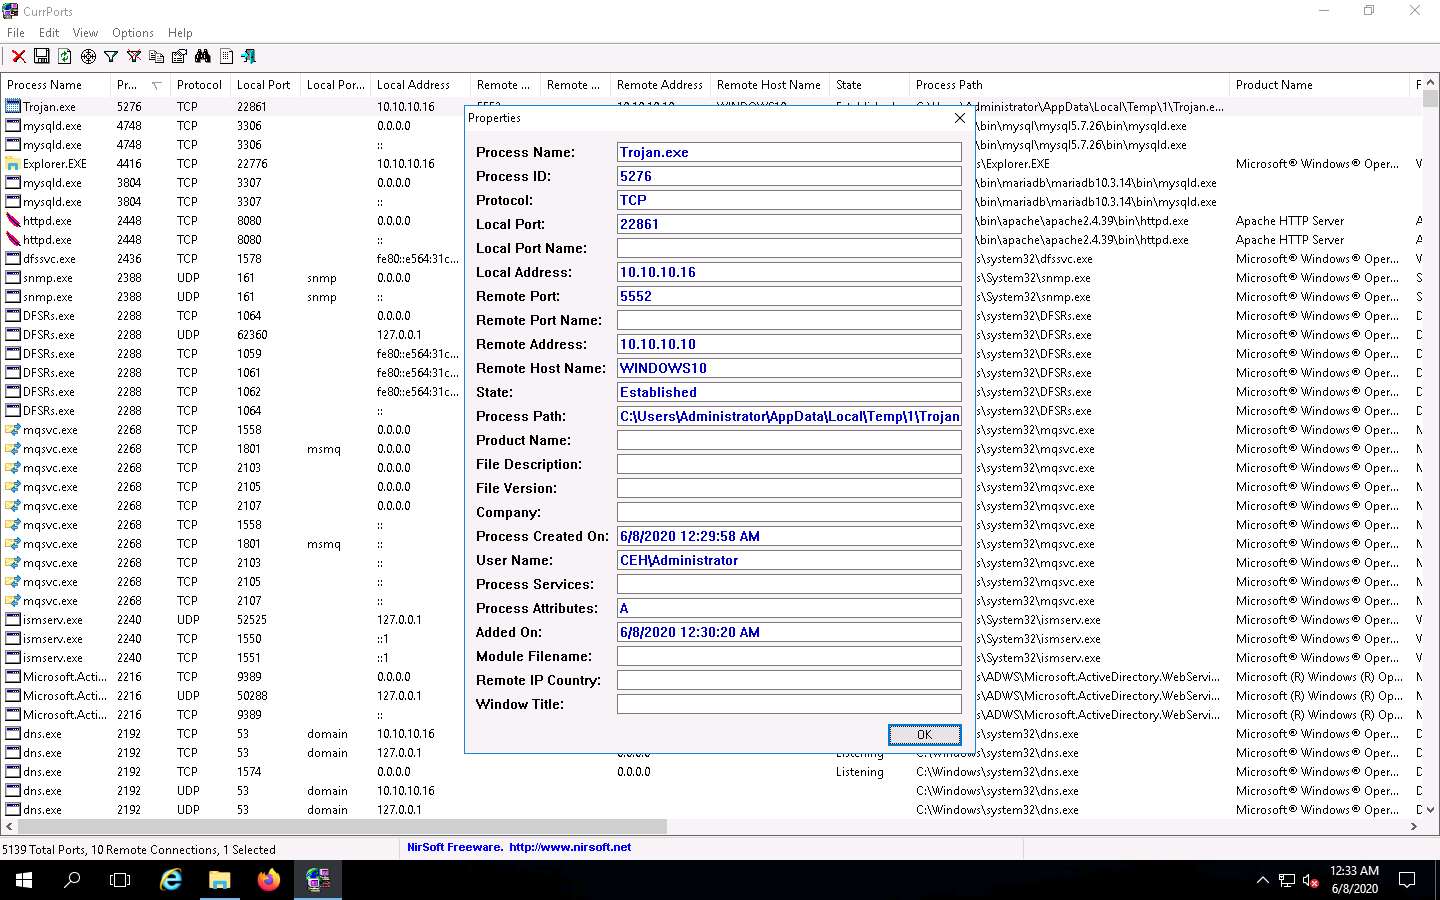
The Properties window appears, displaying information related to the process such as the name of the process, its process ID, Remote Address, Process Path, Remote Host Name, and other details.
Once you are done examining the properties associated with the process, click OK.
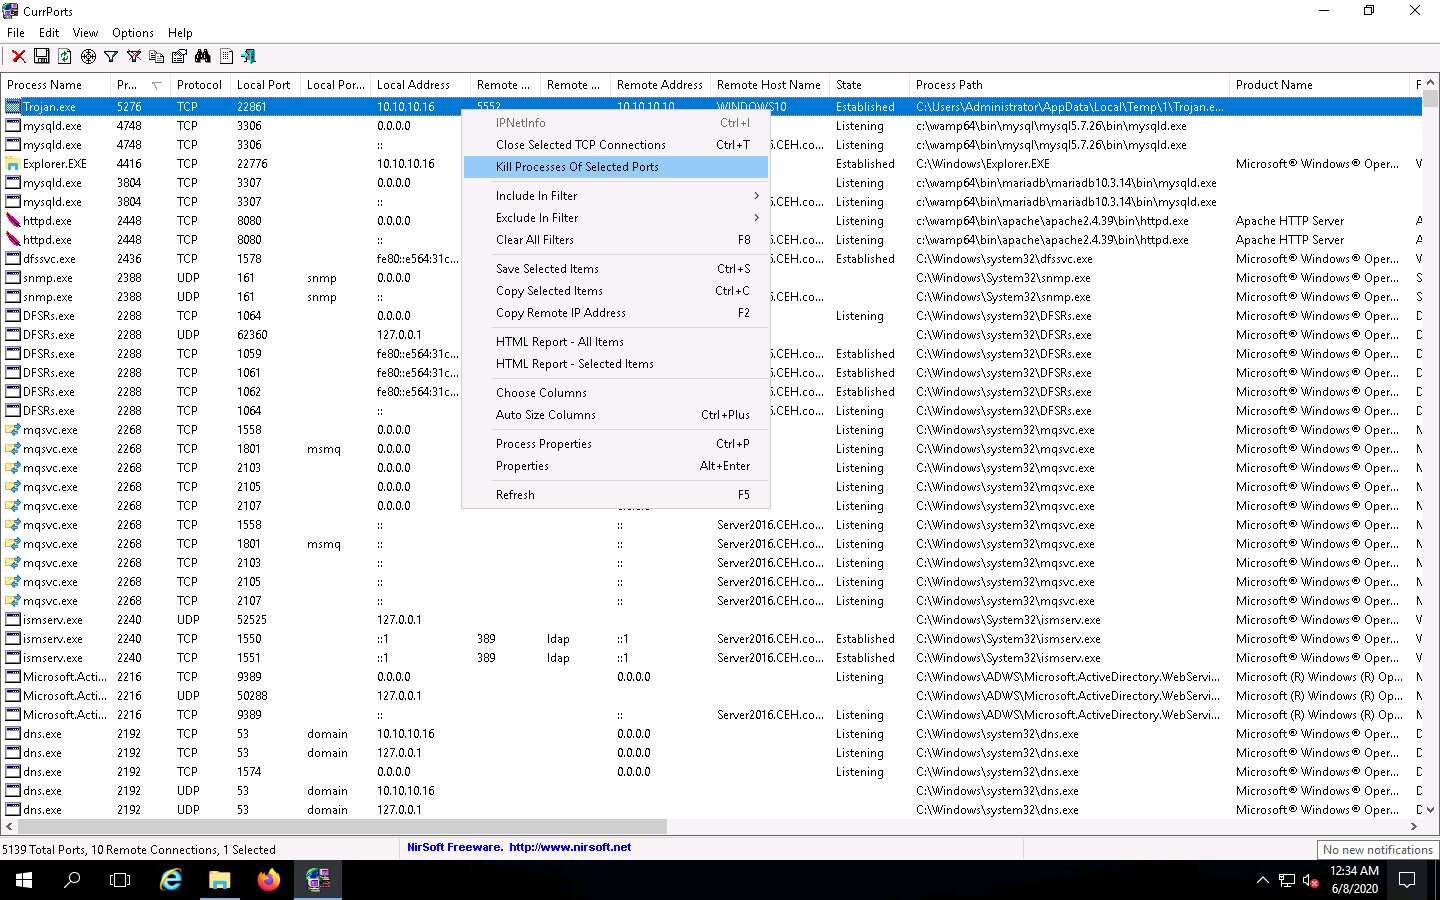
Because Trojan.exe is a malicious process, you may end the process by right-clicking on it and selecting Kill Processes Of Selected Ports from the context menu.
Alternatively, you may select Close Selected TCP Connections, so that the port closes, and the attacker can never regain connection through the port unless you open it.
Normally, when the CurrPorts dialog-box appears, you would click Yes to close the connection. However, do not Kill the process at this step, as this running process will be used for the next task; click No.
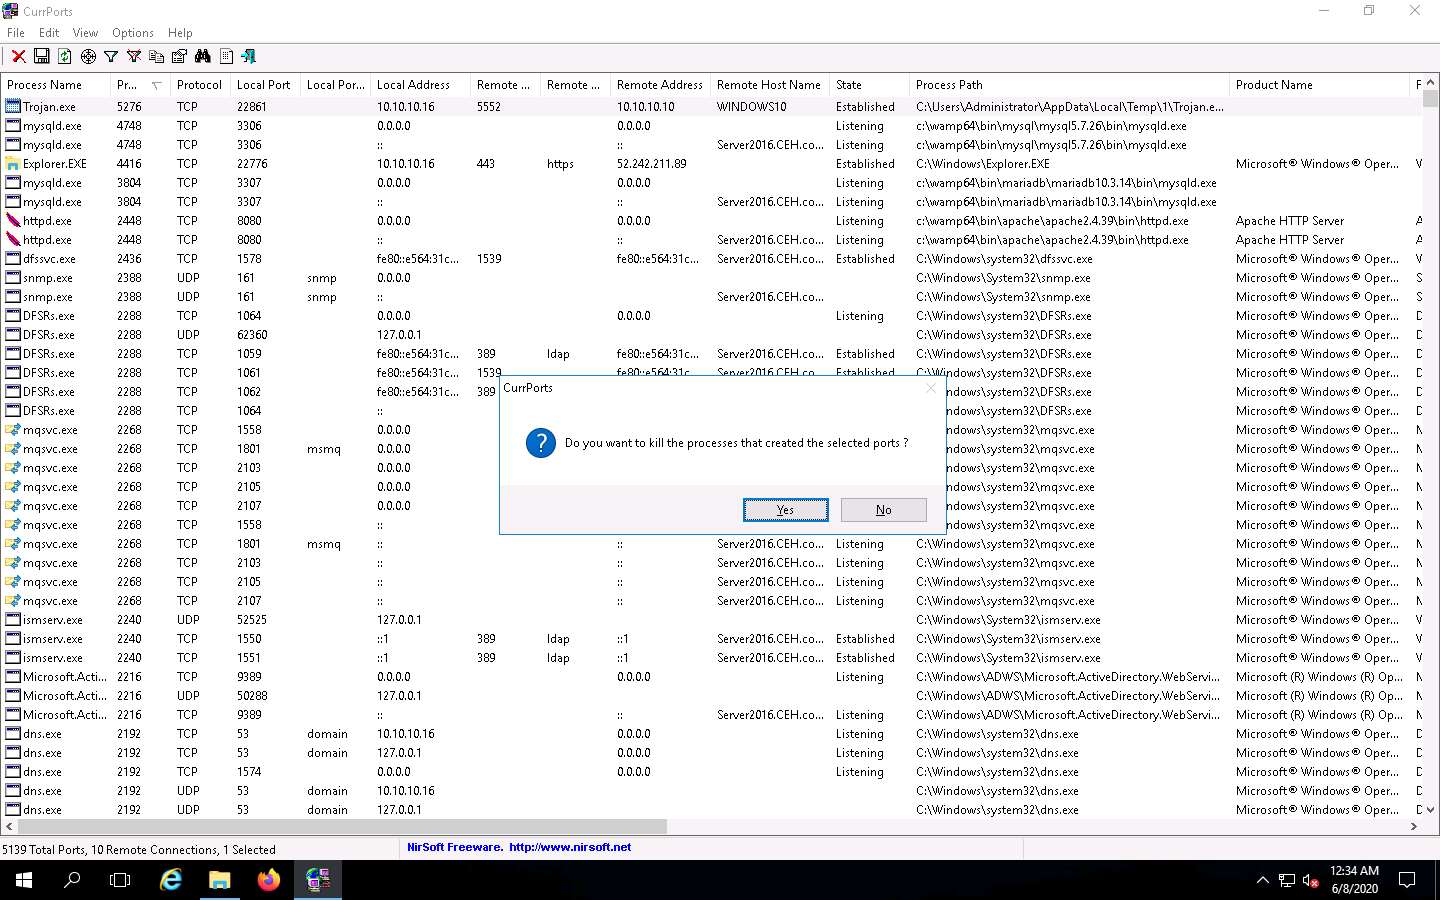
This way, you can analyze the ports open on a machine and the processes running on it.
If a process is found to be suspicious, you may either kill the process or close the port.
Close all open windows.
You can also use other port monitoring tools such as Port Monitor (https://www.port-monitor.com), CurrPorts (https://www.nirsoft.net), TCP Port Monitoring (https://www.dotcom-monitor.com), or PortExpert (http://www.kcsoftwares.com) to perform port monitoring.
Task 2: Perform Process Monitoring using Process Monitor
Process monitoring will help in understanding the processes that malware initiates and takes over after execution. You should also observe the child processes, associated handles, loaded libraries, functions, and execution flow of boot time processes to define the entire nature of a file or program, gather information about processes running before the execution of the malware, and compare them with the processes running after execution. This method will reduce the time taken to analyze the processes and help in easy identification of all processes that malware starts.
Process Monitor is a monitoring tool for Windows that shows the real-time file system, Registry, and process and thread activity. It combines the features of two legacy Sysinternals utilities, Filemon and Regmon. It adds an extensive list of enhancements including rich and non-destructive filtering, comprehensive event properties such session IDs and user names, reliable process information, full thread stacks with integrated symbol support for each operation, and simultaneous logging to a file. Unique features of Process Monitor make it a core utility in system troubleshooting and vital to the malware hunting toolkit.
Here, we will use the Process Monitor tool to detect suspicious processes.
On the Windows Server 2016 machine, navigate to Z:\CEHv11 Module 07 Malware Threats\Malware Analysis Tools\Dynamic Malware Analysis Tools\Process Monitoring Tools\ProcessMonitor and double-click Procmon.exe to launch the Process Monitor tool.
The Process Monitor License Agreement window appears; click Agree.
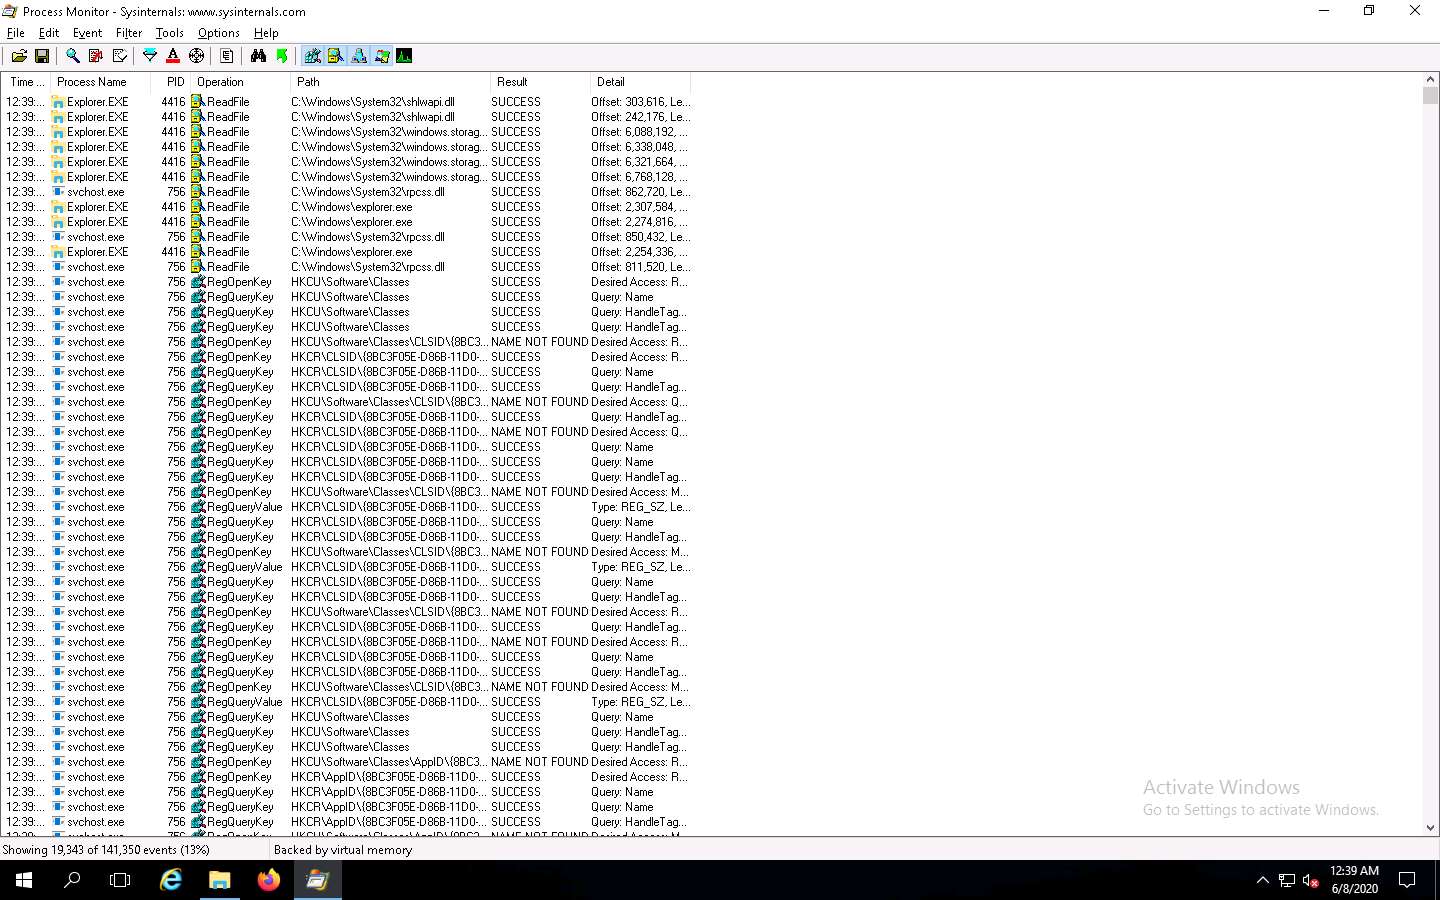
The Process Monitor main window appears, as shown in the screenshot, with the processes running on the machine.
Look for the Trojan.exe process that was executed in the previous task. If you killed the process at the end of the task, then navigate to Z:\CEHv11 Module 07 Malware Threats\Trojans Types\Remote Access Trojans (RAT)\njRAT and double-click Trojan.exe to re-execute the malicious program.
Observe that the Trojan.exe process is running on the machine. Process Monitor shows the running process details such as the PID, Operation, Path, Result, and Details.
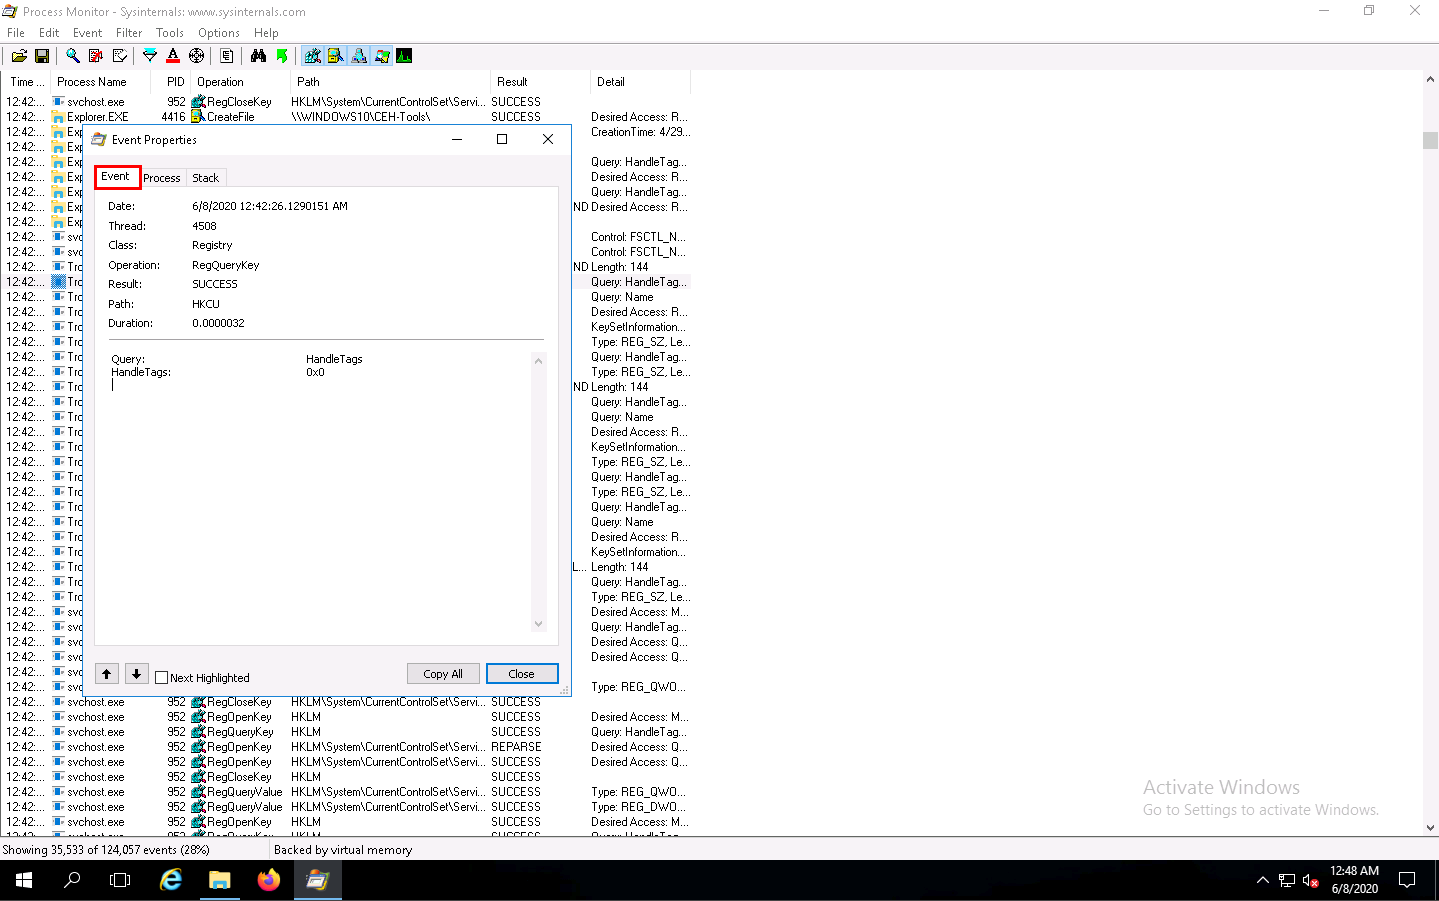
To view the properties of a running process, select the process (here, Trojan.exe), navigate to Event, and click Properties from the menu.
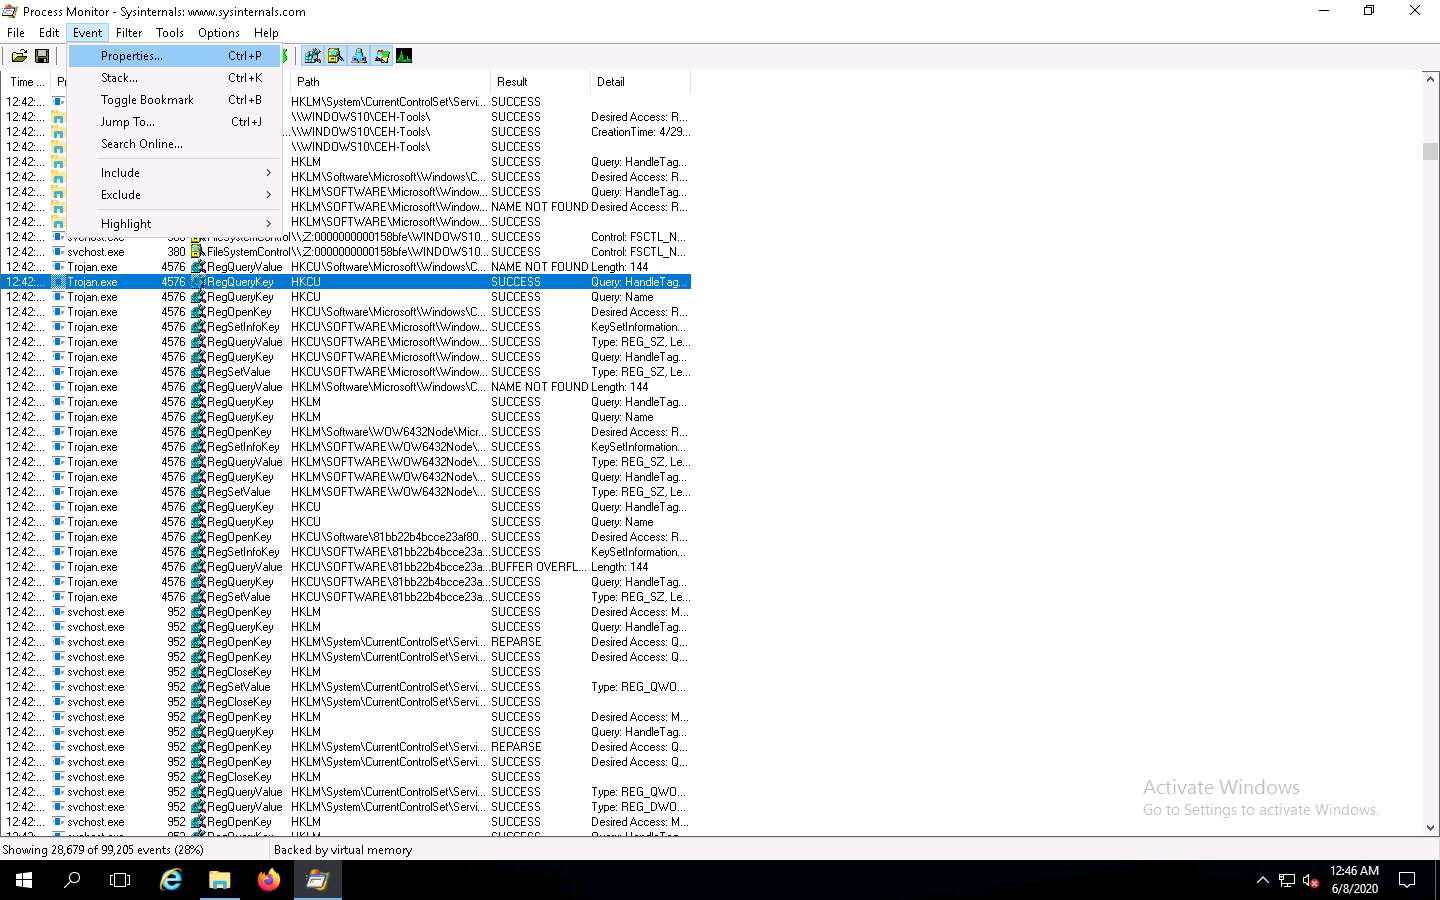
The Event Properties window appears with the details of the chosen process.
In the Event tab, you can see the complete details of the running process such as Date, Thread, Class, Operation, Result, Path, and Duration.
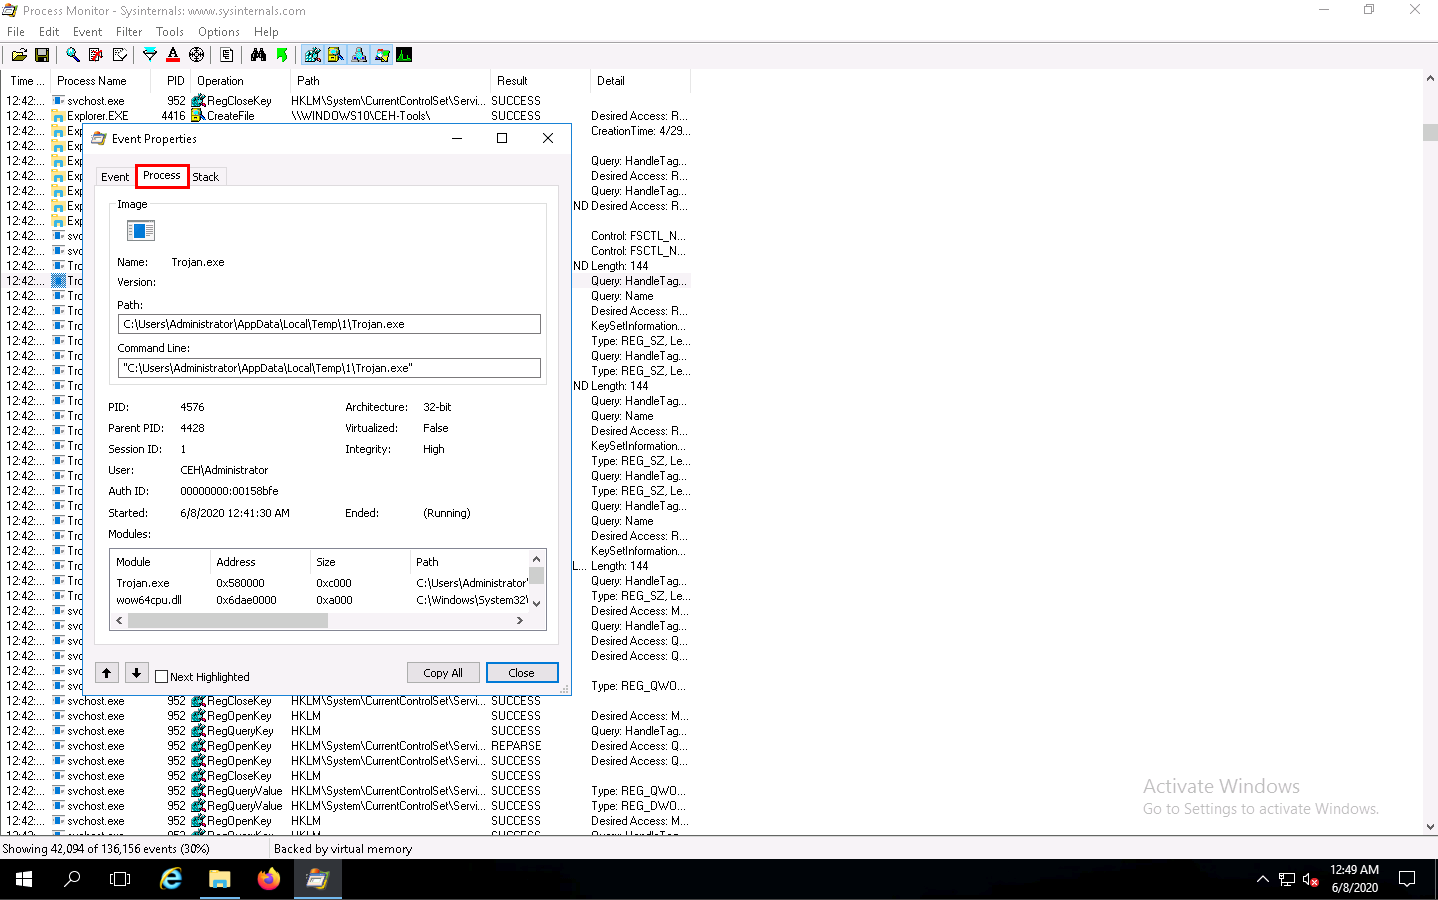
Once the analysis is complete, click the Process tab.
The Process tab shows the complete details of the process running, as shown in the screenshot.
Click the Stack tab to view the supported DLLs of the selected process. Once the analysis is done, click Close.
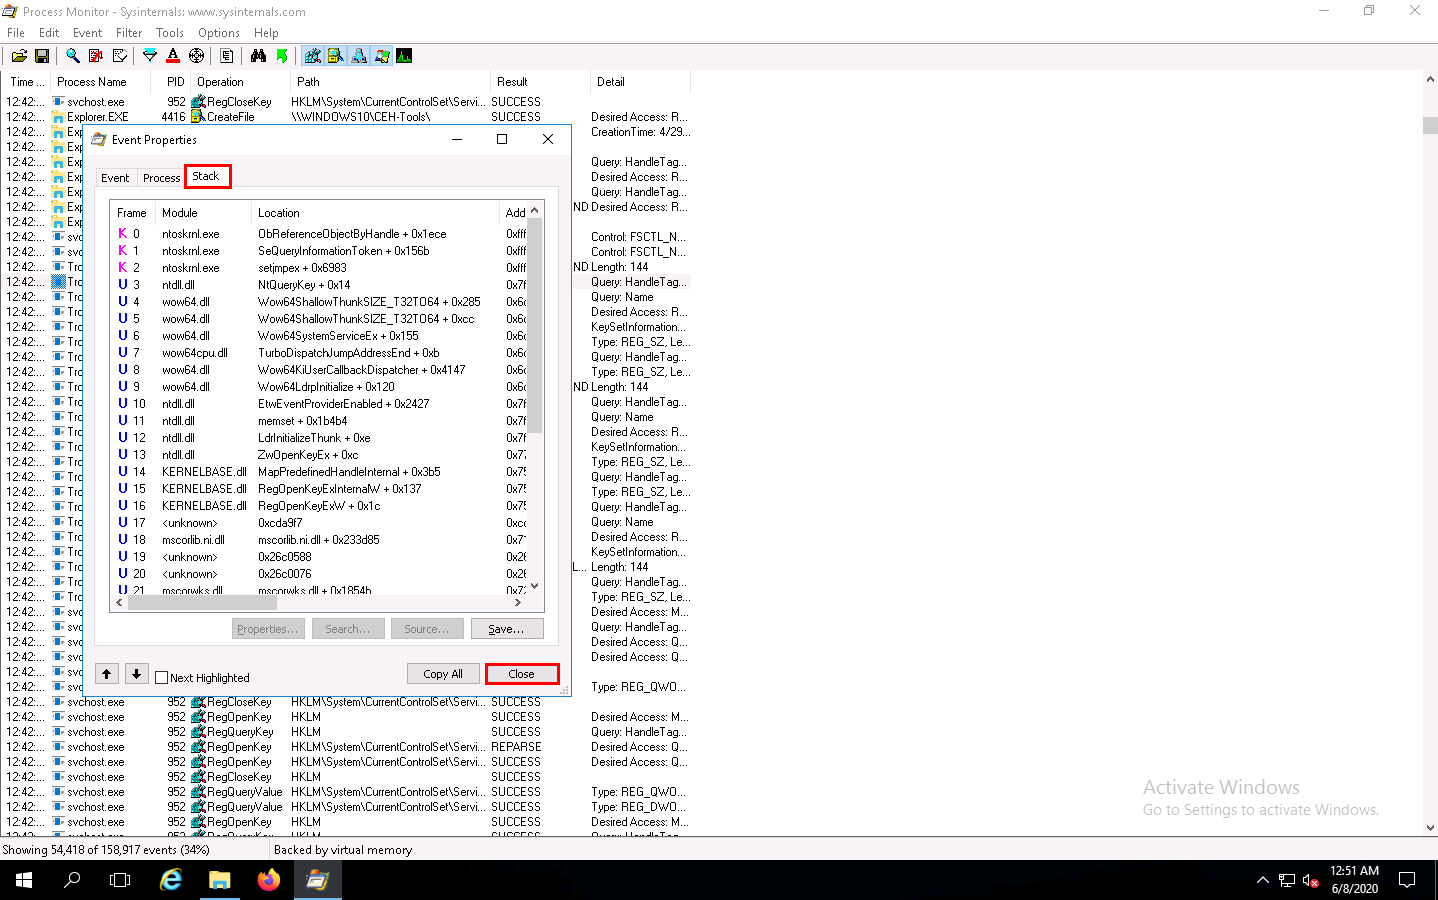
This way, you can analyze the processes running on a machine.
If a process is found to be suspicious, you may either kill the process or close the port.
Close all windows on the Windows 10 and Windows Server 2016 machines.
You can also use other process monitoring tools such as Process Explorer (https://docs.microsoft.com), OpManager (https://www.manageengine.com), Monit (https://mmonit.com), or ESET SysInspector (https://www.eset.com) to perform process monitoring.
Task 3: Perform Registry Monitoring using Regshot and jv16 PowerTools
The Windows registry stores OS and program configuration details such as settings and options. If the malware is a program, the registry stores its functionality. When an attacker installs a type of malware on the victim’s machine, it generates a registry entry. One must have a fair knowledge of the Windows registry, its contents, and inner workings to analyze the presence of malware. Scanning for suspicious registries will help to detect malware. While most computer users generally do not do this, monitoring the registry entries is a great way to track any modifications made to your system.
Registry monitoring tools such as Regshot and jv16 PowerTools provide a simple way to perform the interesting task of tracking registry modifications, which proves to be useful in troubleshooting and monitoring background changes.
Regshot Regshot is a registry compare utility that helps to compare changes in registry entries after installing or uninstalling a program or manually modifying the registry. The purpose of this utility is to compare your registry at two separate points by taking a snapshot of the registry before and after any program or settings are added, removed, or otherwise modified.
jv16 PowerTools jv16 PowerTools is a PC system utility software that works by cleaning out unneeded files and data, cleaning the Windows registry, automatically fixing system errors, and applying optimization to your system. It allows the user to scan and monitor the Registry.
Further, jv16 helps in detecting registry entries created by malware. The “Clean and Speedup My Computer” feature of the Registry Cleaner in jv16 PowerTools is a solution for fixing registry errors and system errors, cleaning registry leftovers, as well as managing unneeded files such as old log files and temporary files.
Here, we will use the registry monitoring tools Regshot and jv16 PowerTools to scan the registry values for any suspicious entries that may indicate a malware infection.
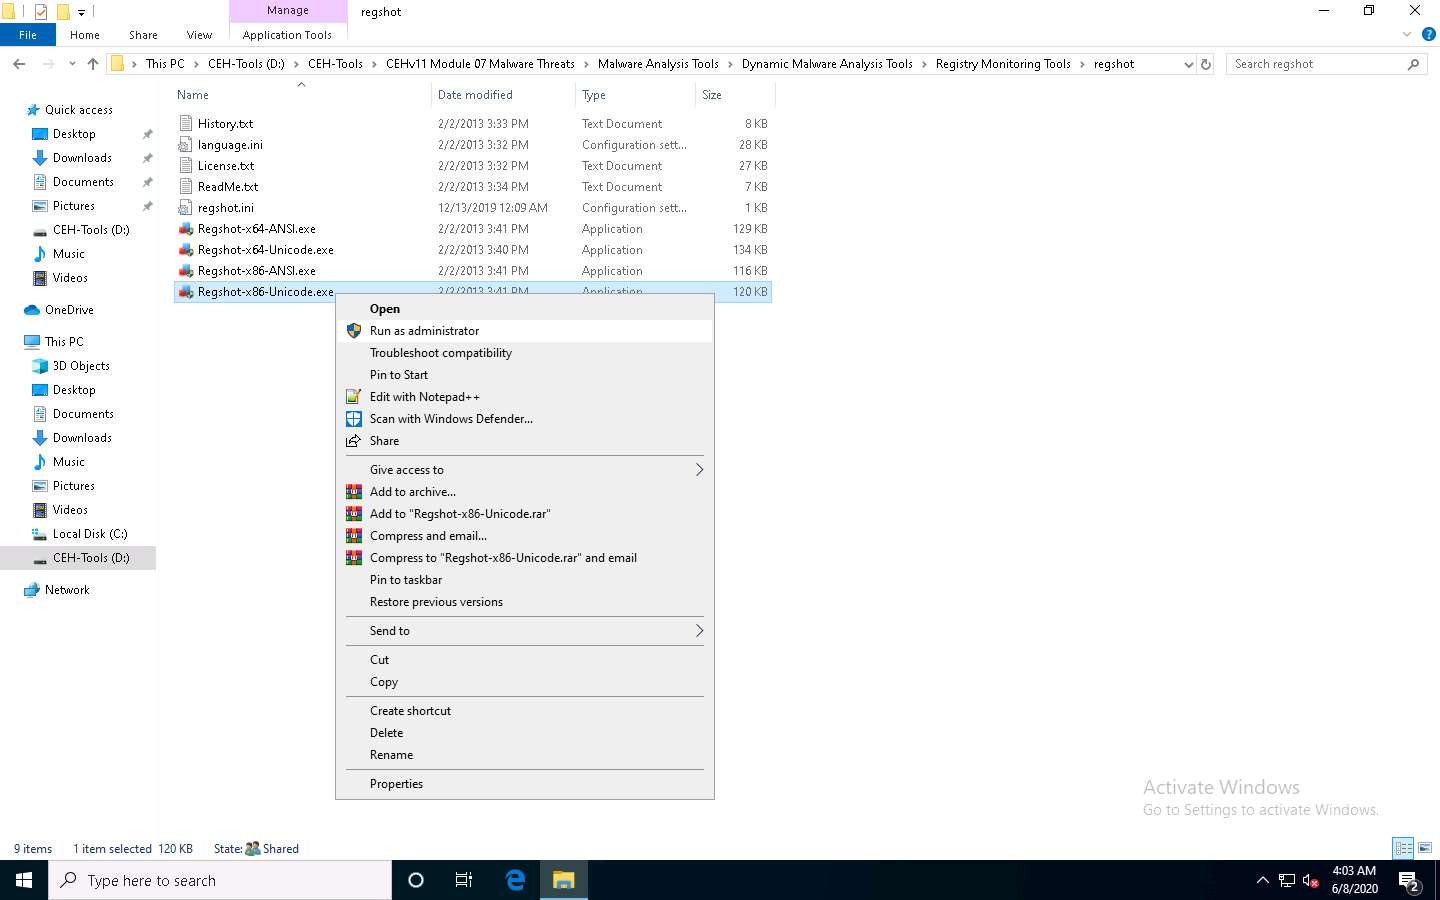
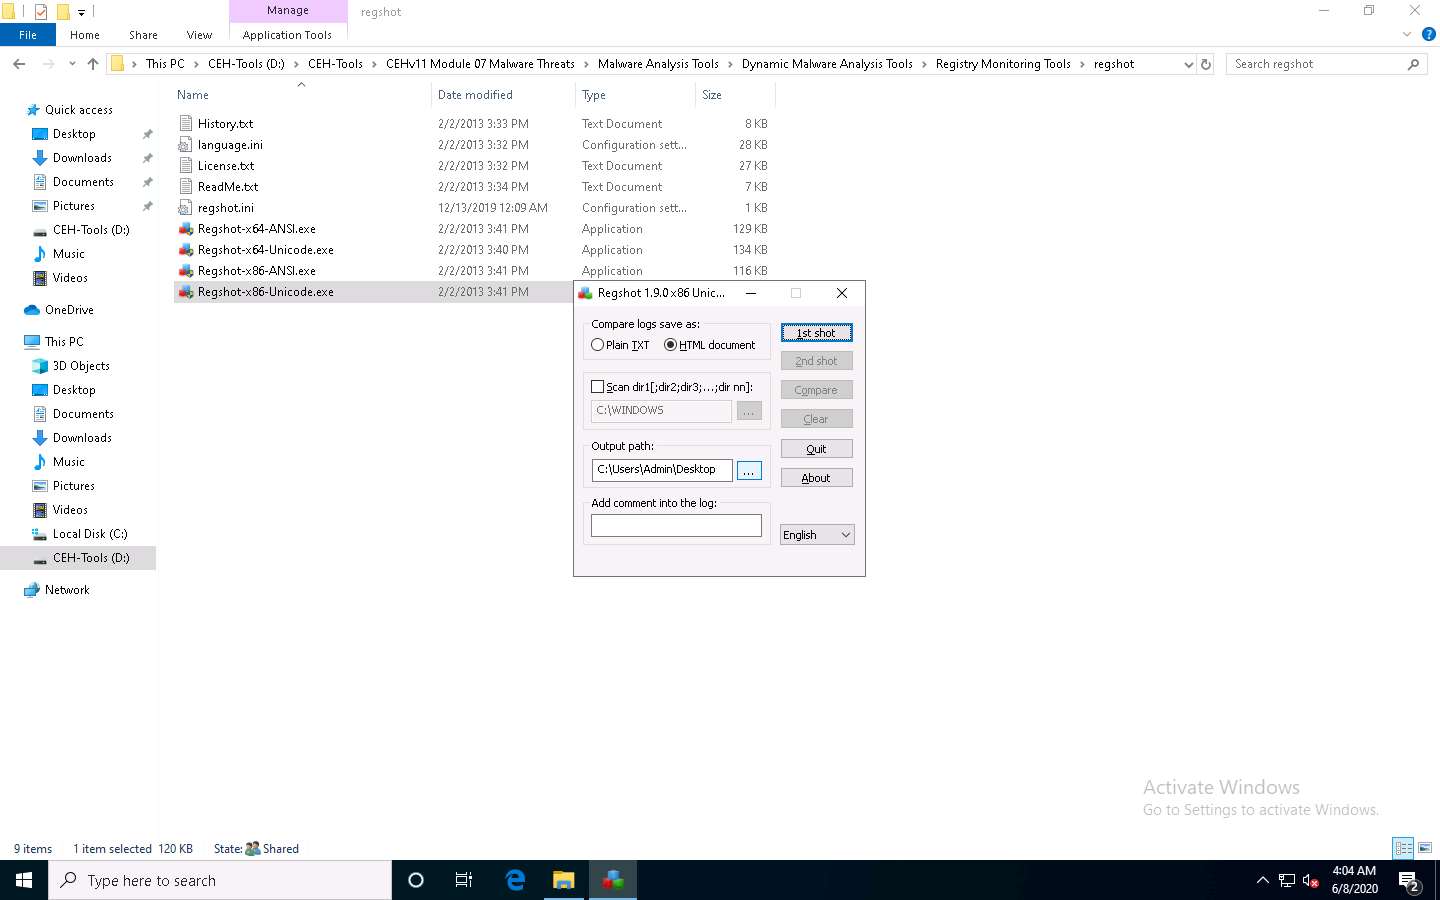
Click Windows 10 to switch to the Windows 10 machine and navigate to D:\CEH-Tools\CEHv11 Module 07 Malware Threats\Malware Analysis Tools\Dynamic Malware Analysis Tools\Registry Monitoring Tools\regshot. Right-click Regshot-x86-Unicode.exe and choose Run as administrator from the context menu, as shown in the screenshot.
If a User Account Control window appears, click Yes.
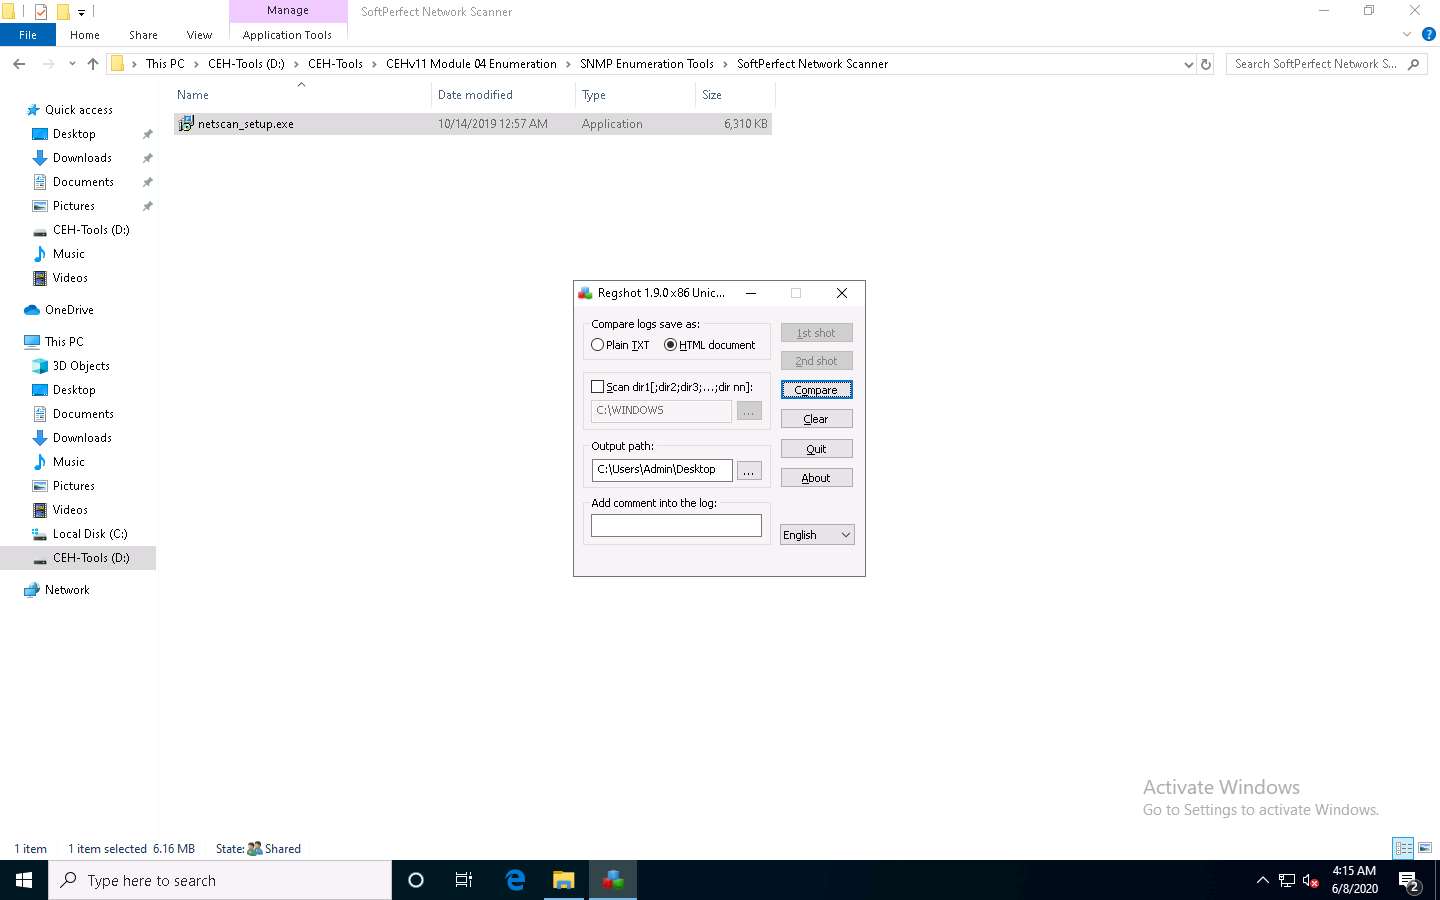
The Regshot application window opens, select the HTML document radio button, and in the Output path menu, click the ellipes button.
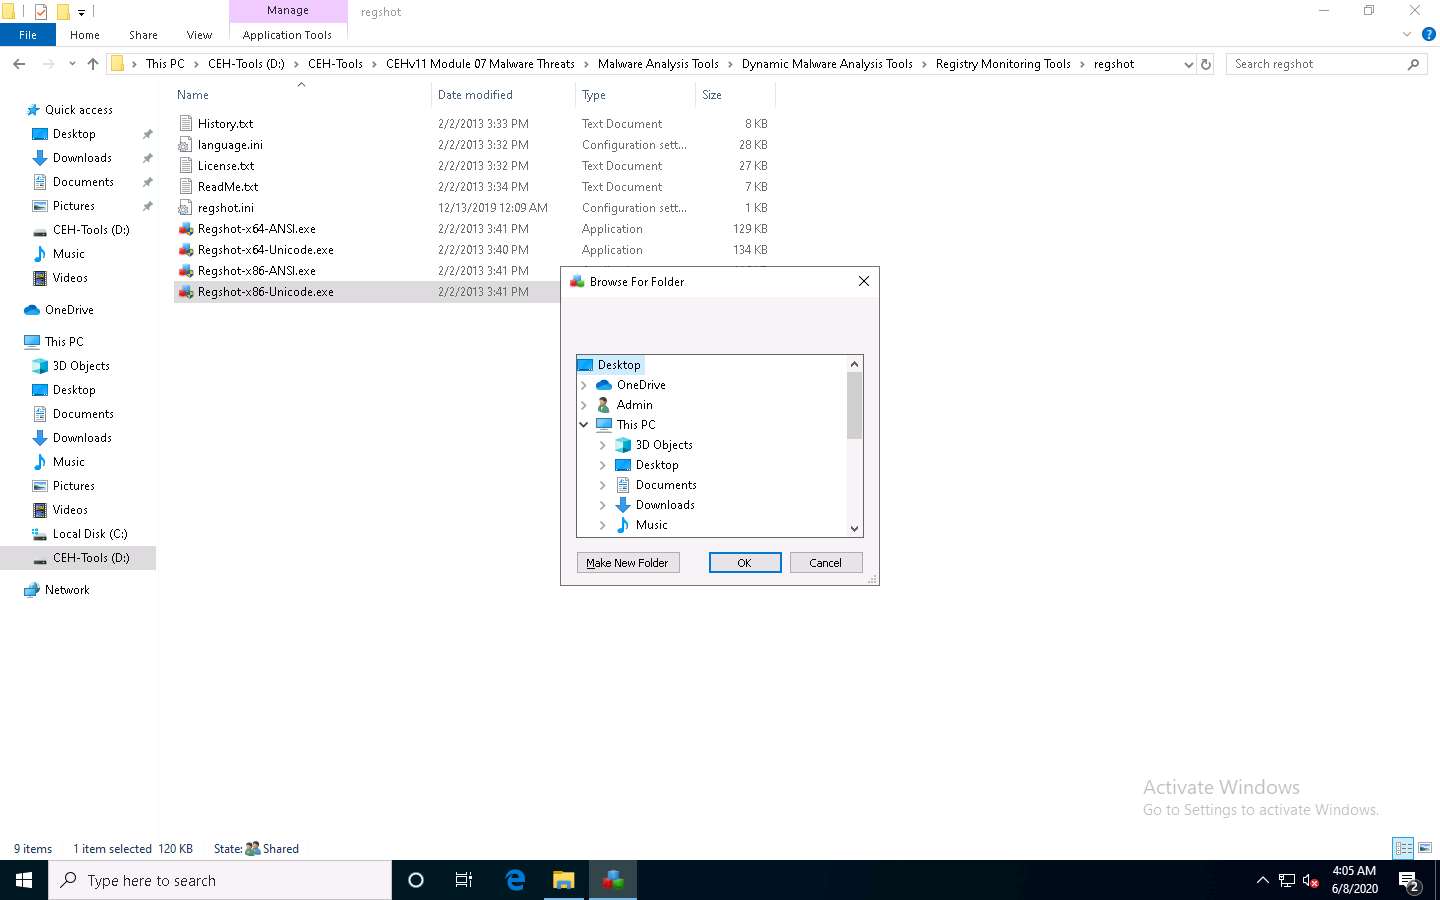
The Browse For Folder window appears; choose Desktop, and then click OK, as shown in the screenshot.
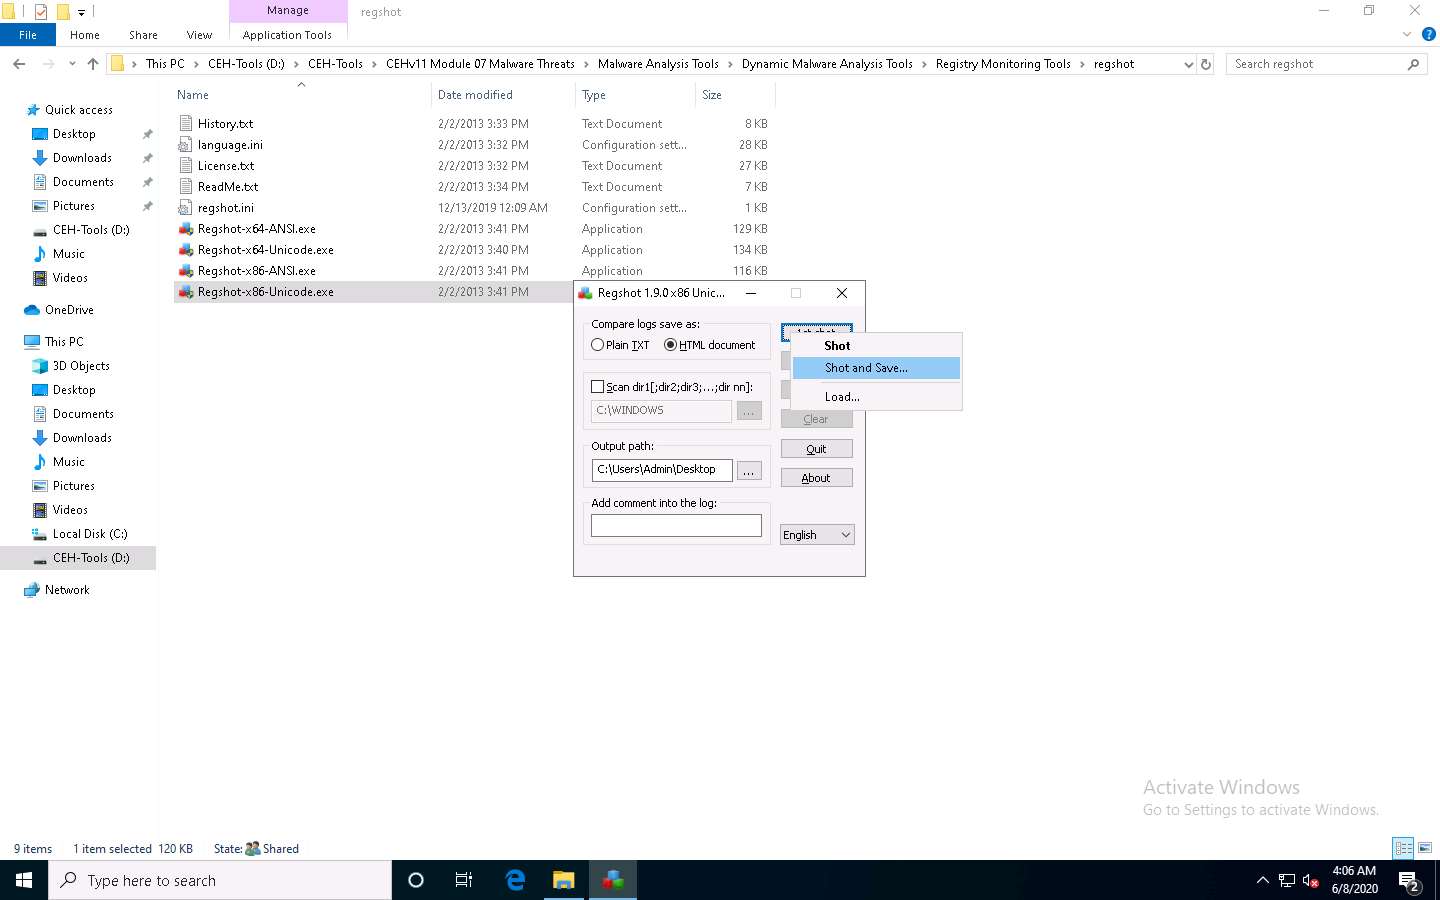
In Regshot’s main window, click the 1st shot button, as shown in the screenshot.

A context menu appears; click Shot and Save….
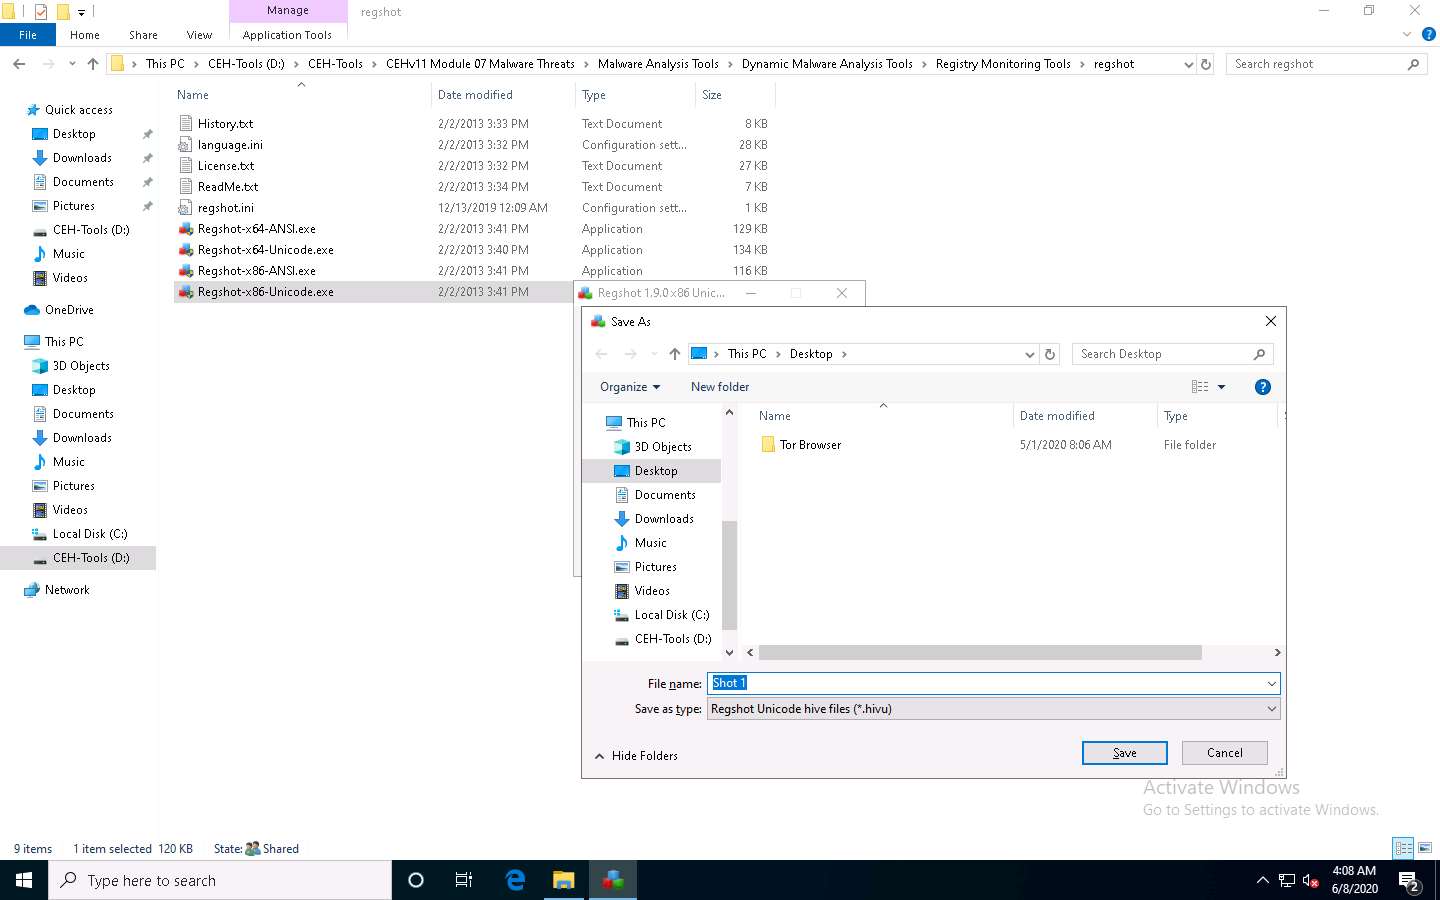
The Save As window appears; enter the file name (here Shot 1) and set the location to Desktop. Then, click Save, as shown in the screenshot.
Now to demonstrate a change in the registry, install an application (here, SoftPerfect Network Scanner).
Navigate to D:\CEH-Tools\CEHv11 Module 04 Enumeration\SNMP Enumeration Tools\SoftPerfect Network Scanner and double-click netscan_setup.exe.
If a User Account Control window appears, click Yes.
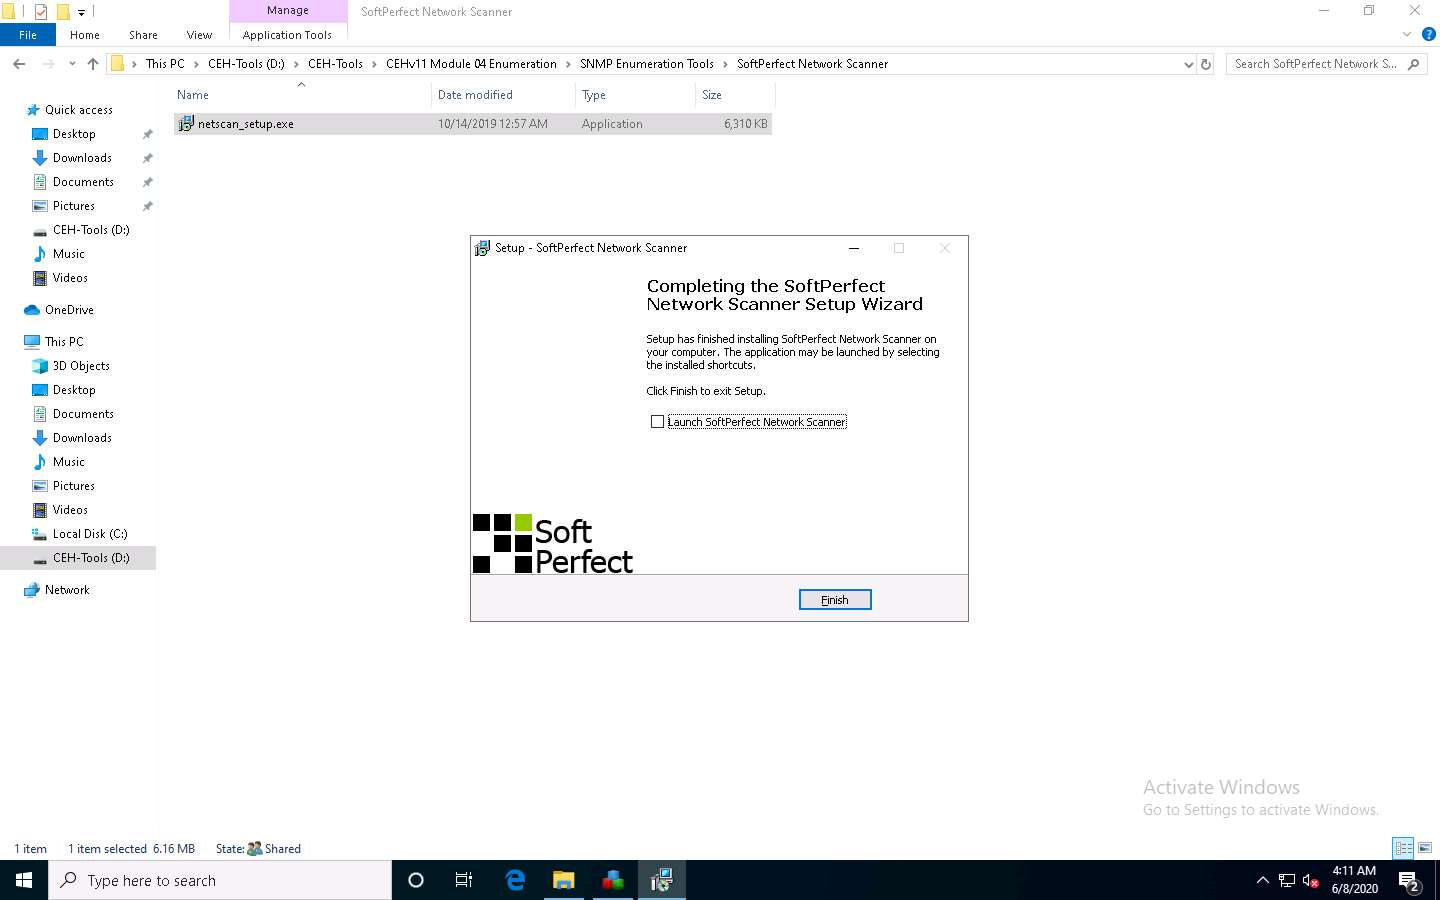
Follow the wizard-driven installation steps to install the SoftPerfect Network Scanner.
Once the installation is complete, uncheck the Launch SoftPerfect Network Scanner option and click Finish.
You can install any application to view the changes in the registry. For demonstration purposes, we have installed the SoftPerfect Network Scanner.
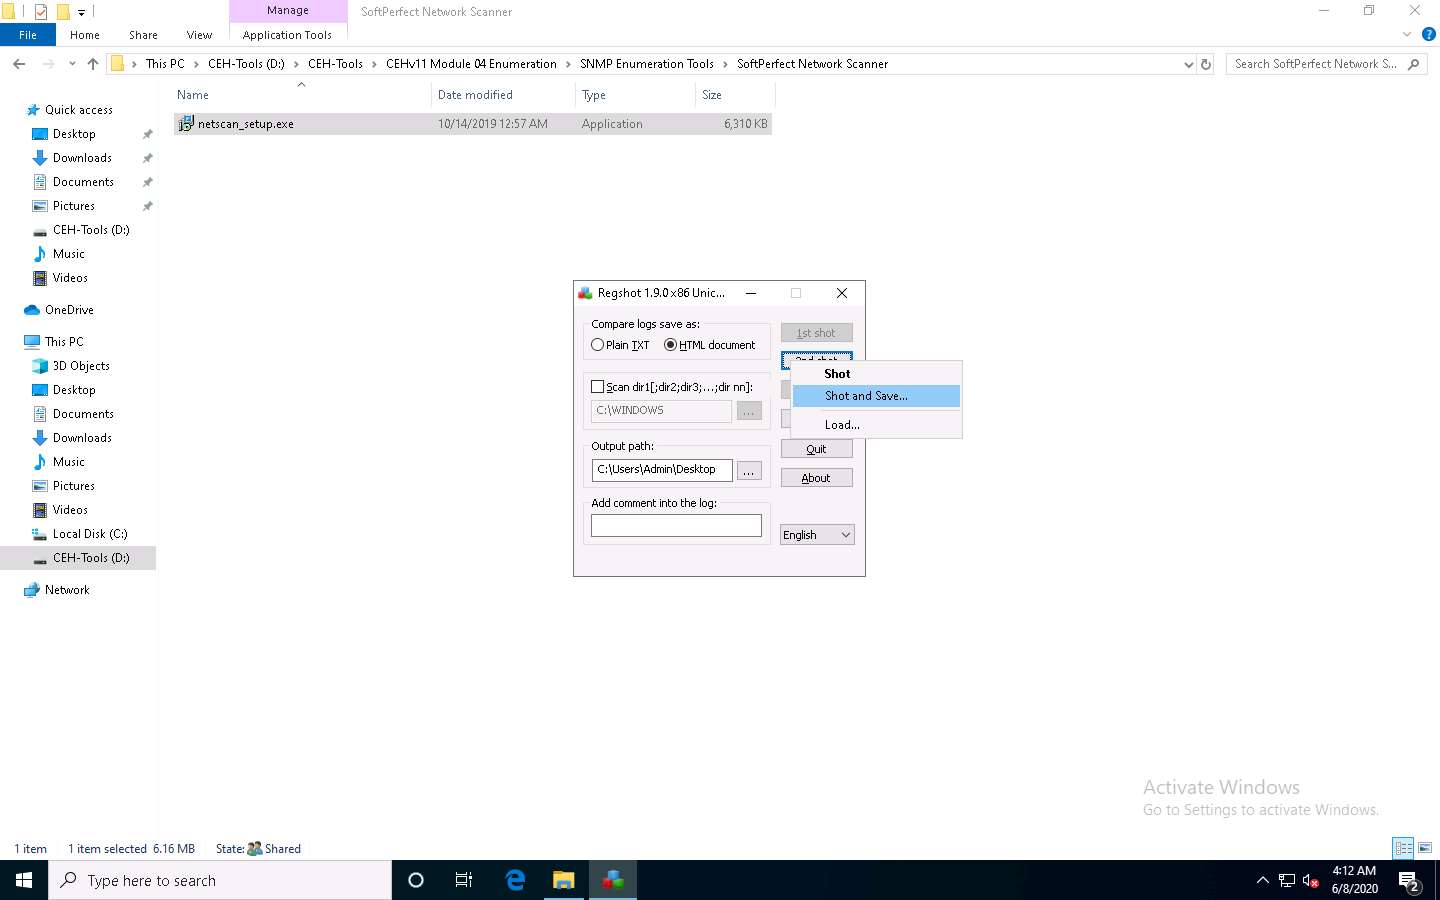
Switch to the Regshot application window; leave all settings to default, and click 2nd shot.
A context menu appears; click Shot and Save…, as shown in the screenshot.
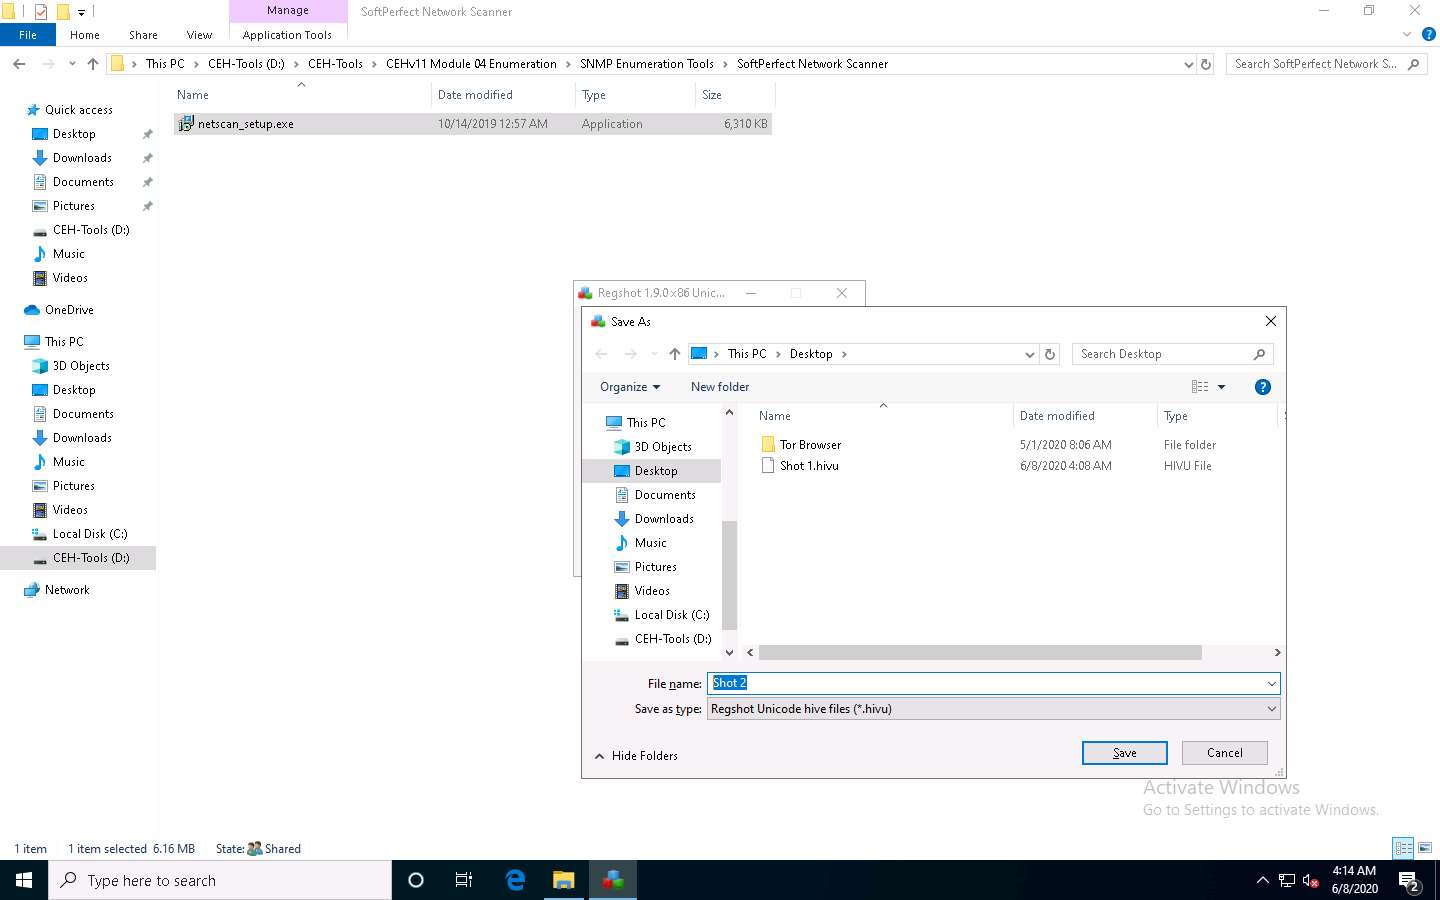
The Save As window appears; enter the file name (here Shot 2) and set the location to Desktop. Then, click Save, as shown in the screenshot.
Now, return to the Regshot application window and click Compare, as shown in the screenshot.
The comparison of both shots opens in a default browser window (here, Google Chrome), close the browser.
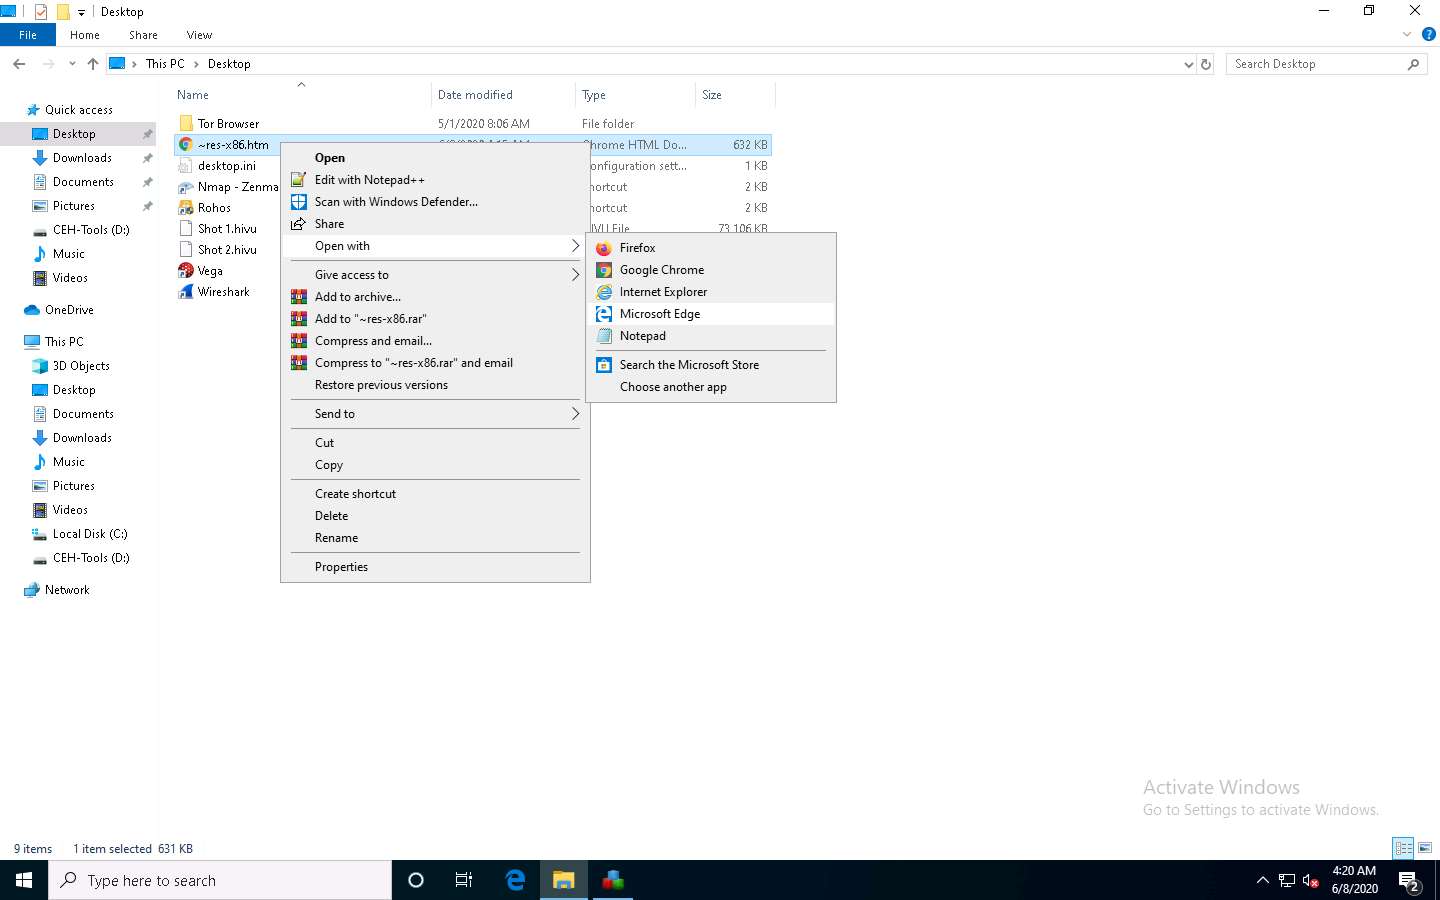
Navigate to the Desktop right-click ~res-x86.htm, navigate to Open with --> Microsoft Edge.
Observe the registry entries that have been modified by comparing the 1st and the 2nd shots, as shown in the screenshot.
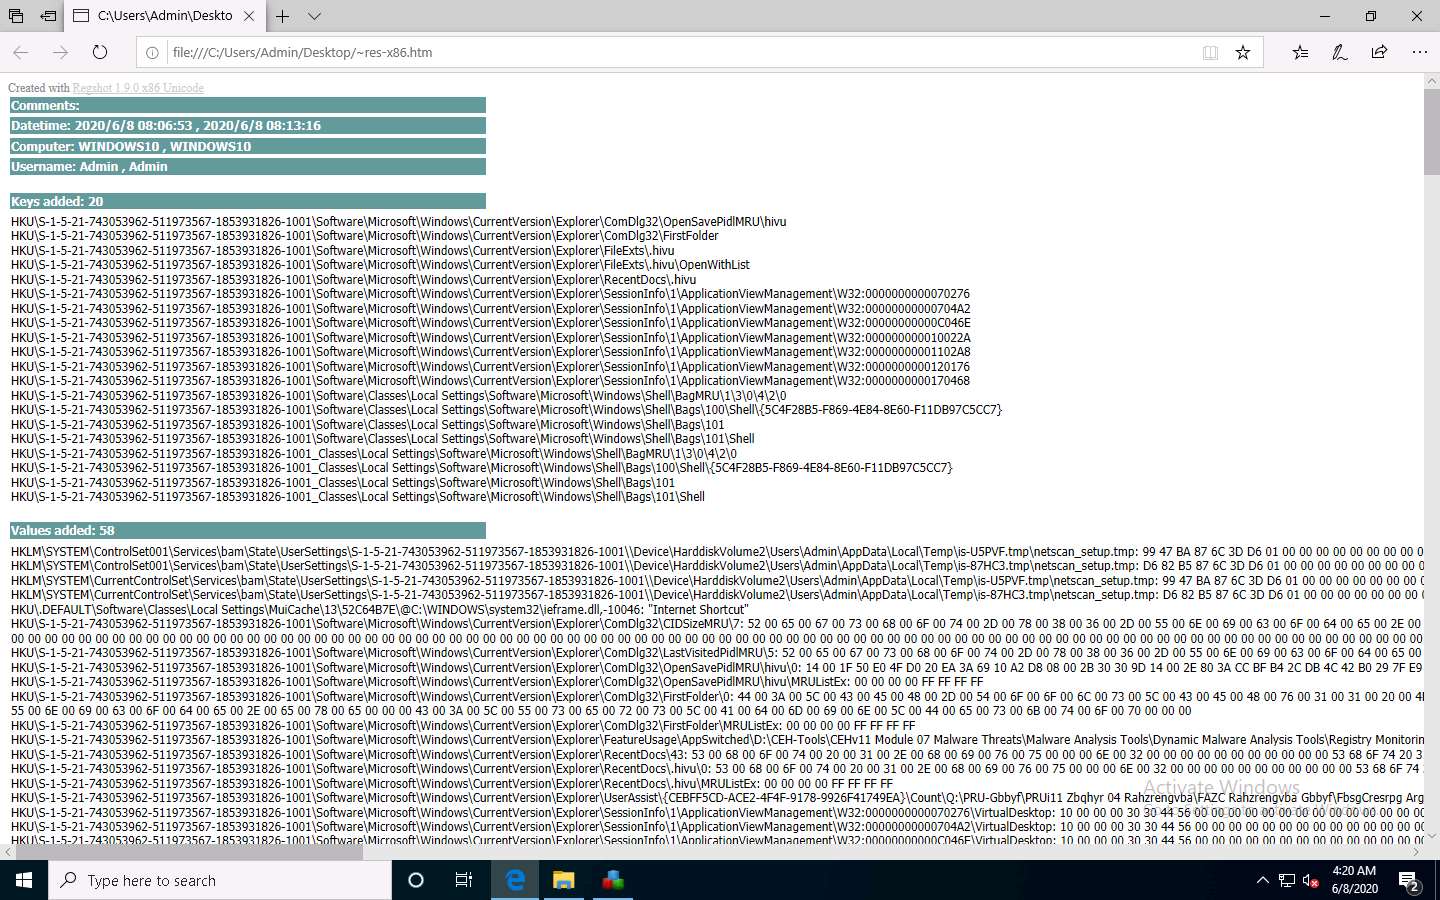
By examining modified registry entries in the result, you can find any unwanted registry entries on the machine and stop or delete them manually.
Close all open windows on the Windows 10 machine.
Now, we will perform an intensive scan for unwanted resources using jv16 PowerTools.
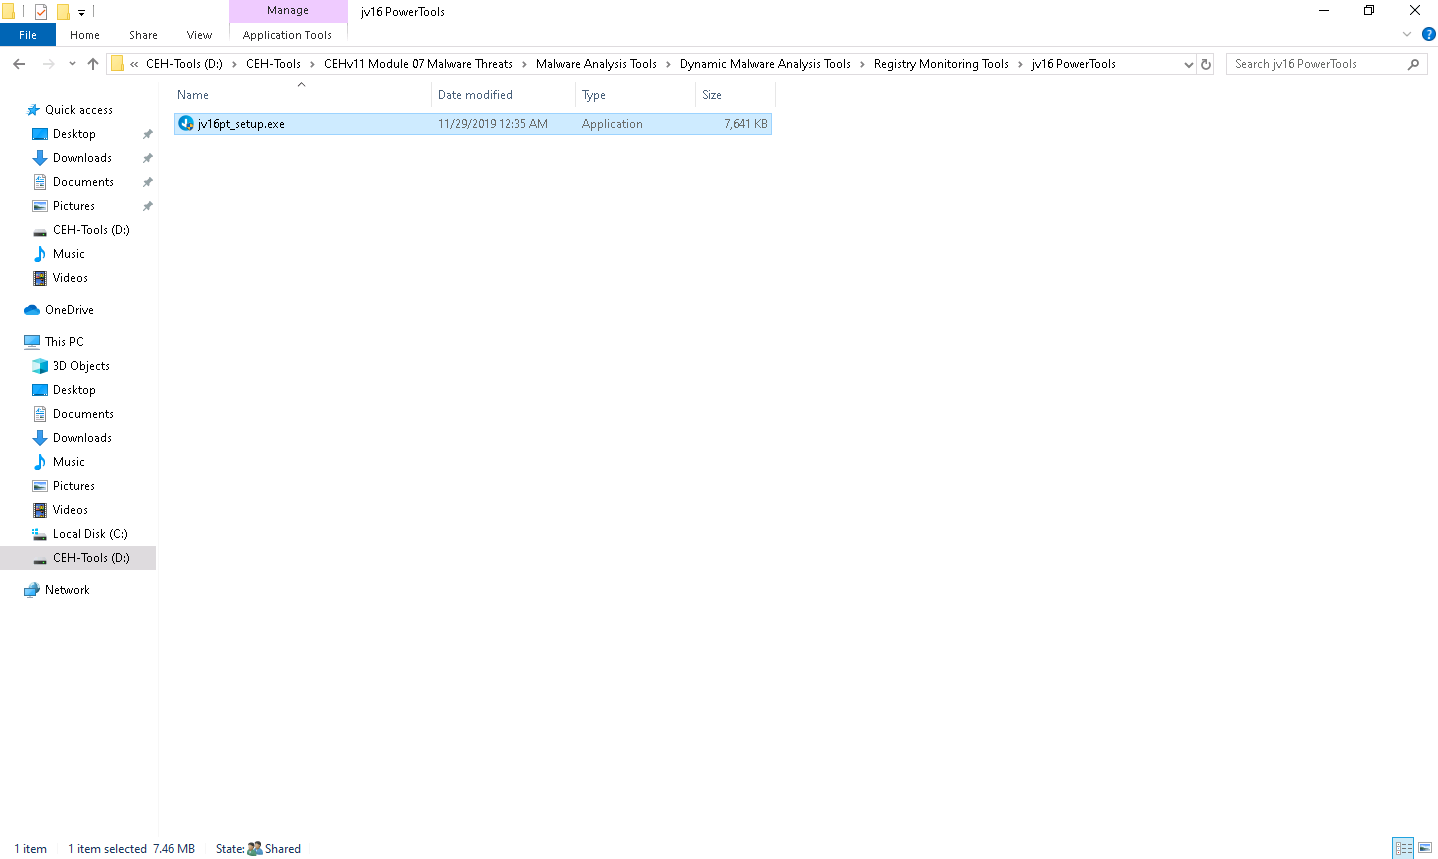
On the Windows 10 machine, navigate to D:\CEH-Tools\CEHv11 Module 07 Malware Threats\Malware Analysis Tools\Dynamic Malware Analysis Tools\Registry Monitoring Tools\jv16 PowerTools and double-click jv16pt_setup.exe.
If the User Account Control window appears, click Yes.
Follow the wizard-driven installation steps to install jv16 Power Tools.
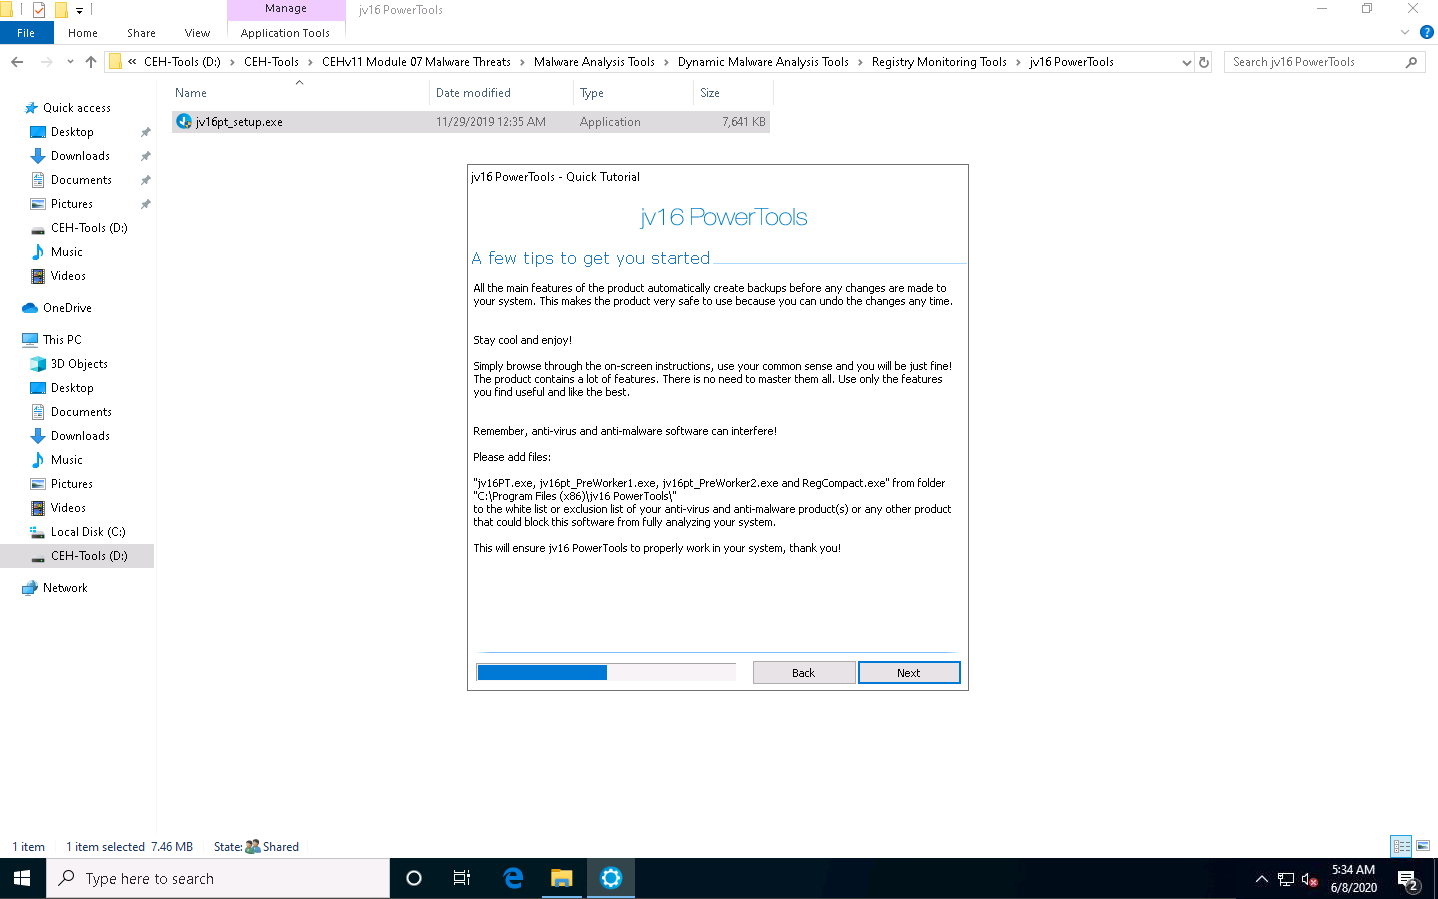
The jv16 PowerTools Quick Tutorial window appears; click Next.
If the jv16 PowerTools Quick Tutorial window does not appear, then double-click the jv16 PowerTools short-cut icon on Desktop to launch the application.
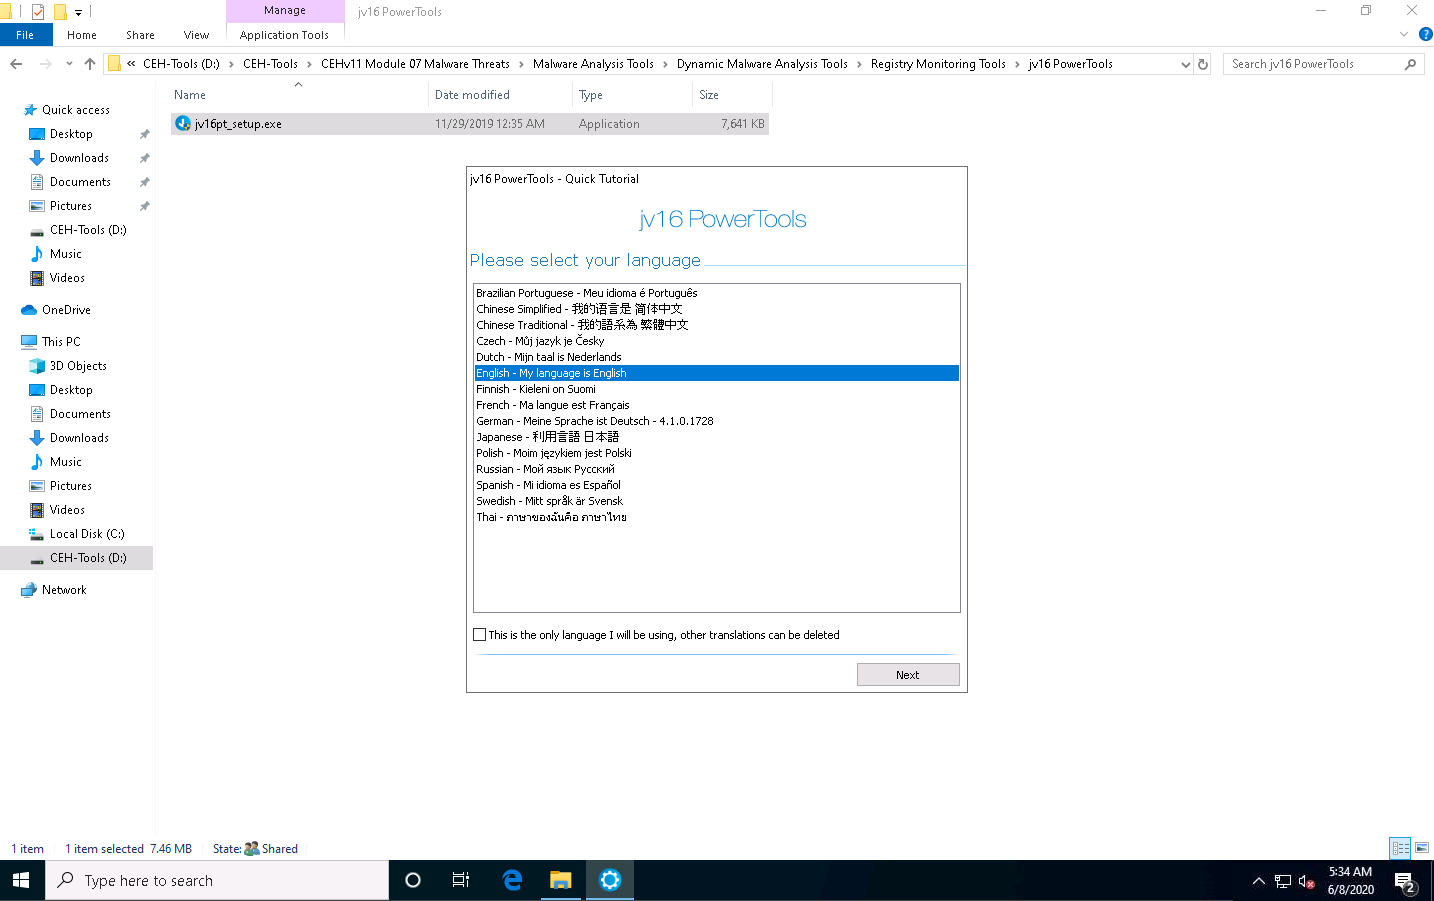
In the Please select your language wizard, choose a language (here, English) and click Next.
The How long would you like your trial to be? wizard appears; leave the fields blank and click Next.
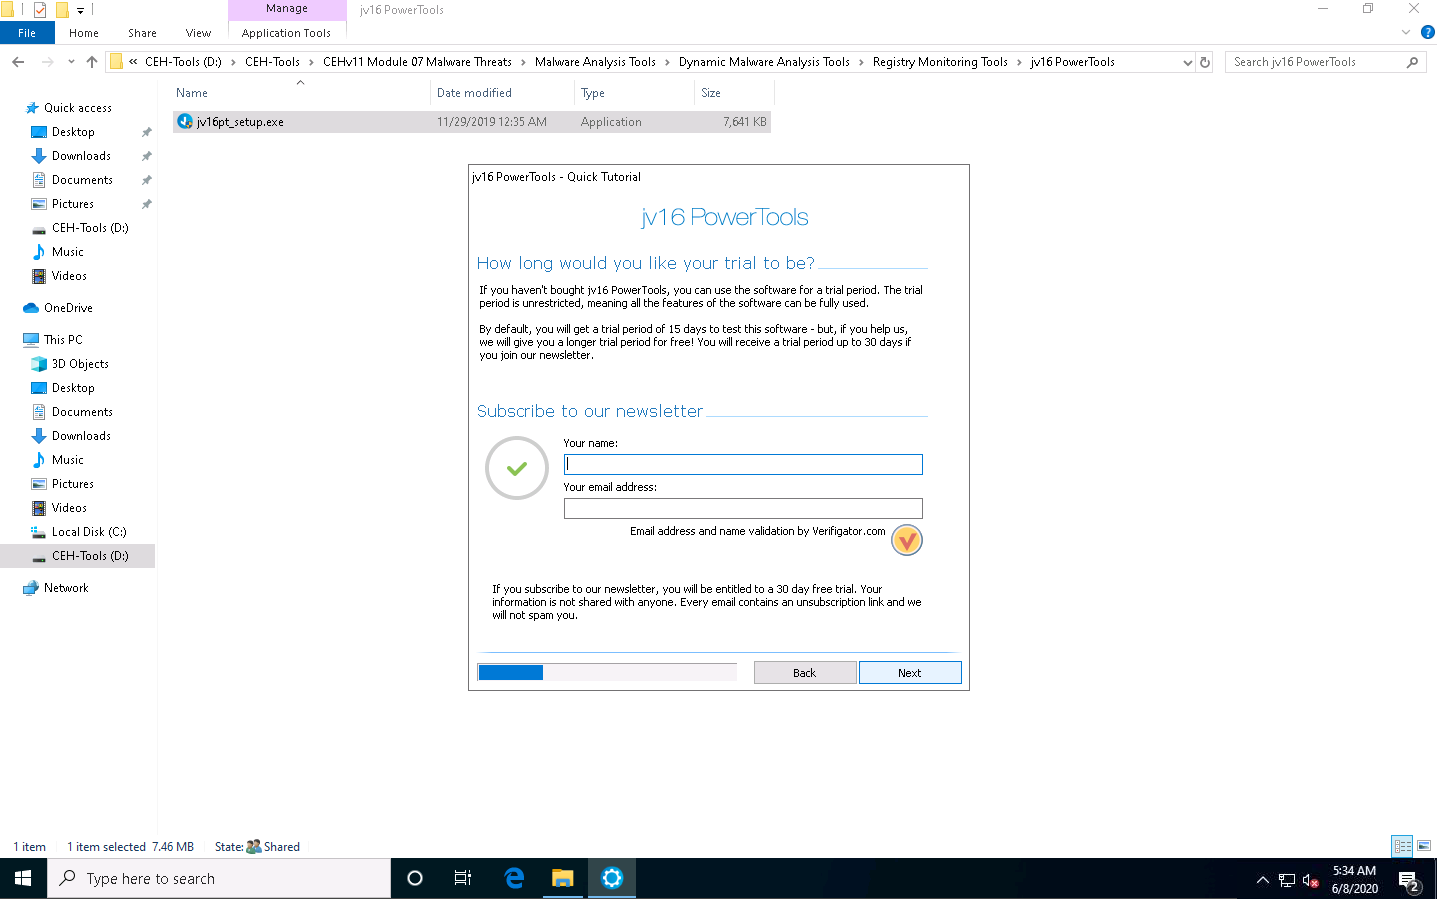
In the next How long would you like your trial to be? wizard screen, leave the fields blank and click Next.
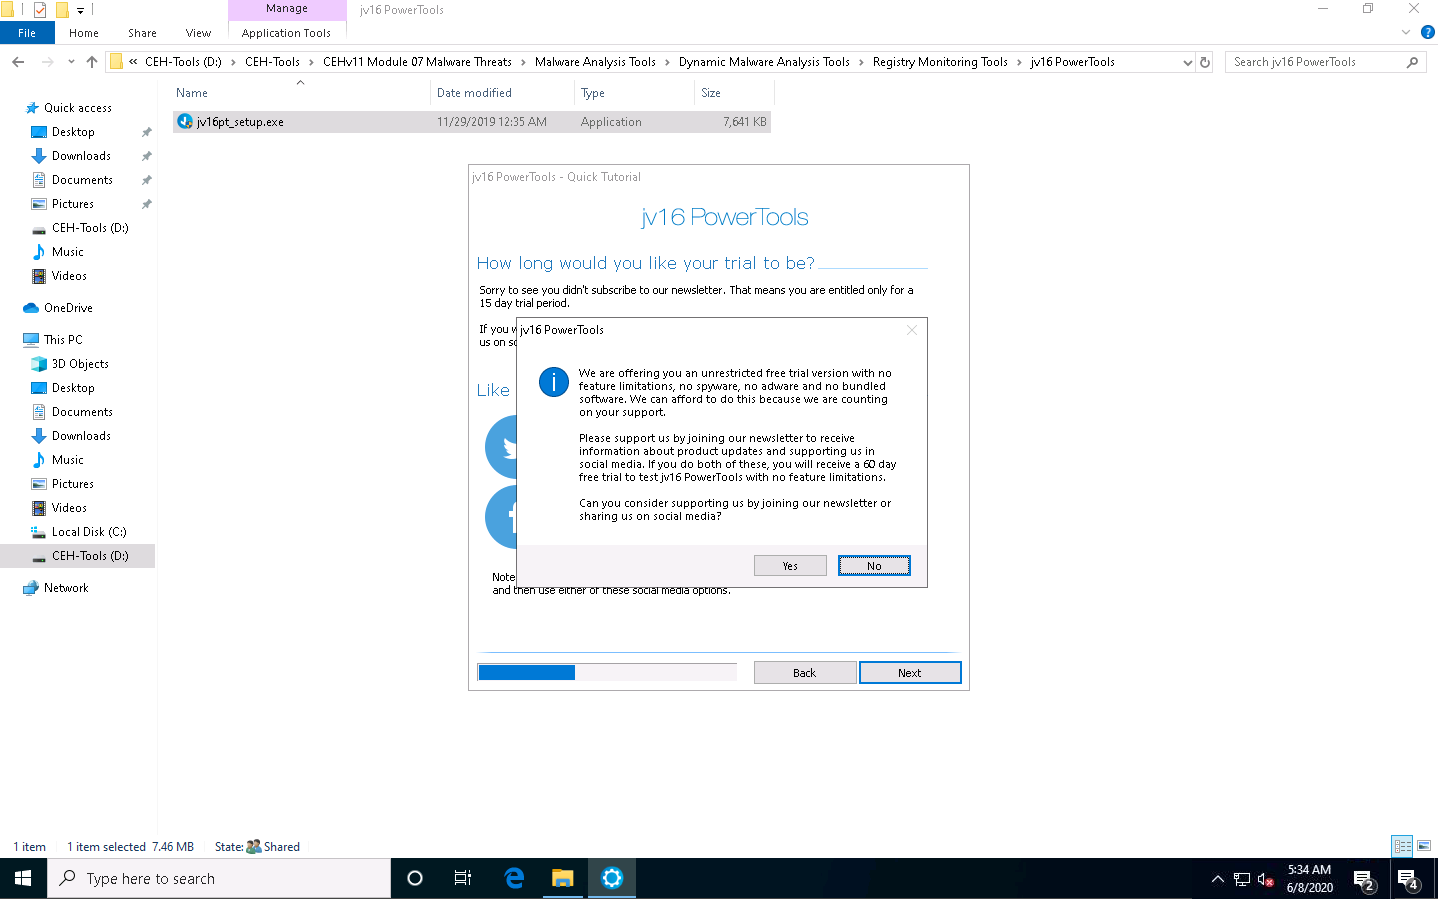
The jv16 PowerTools pop-up appears; click No.
The A few tips to get you started wizard appears; click Next.
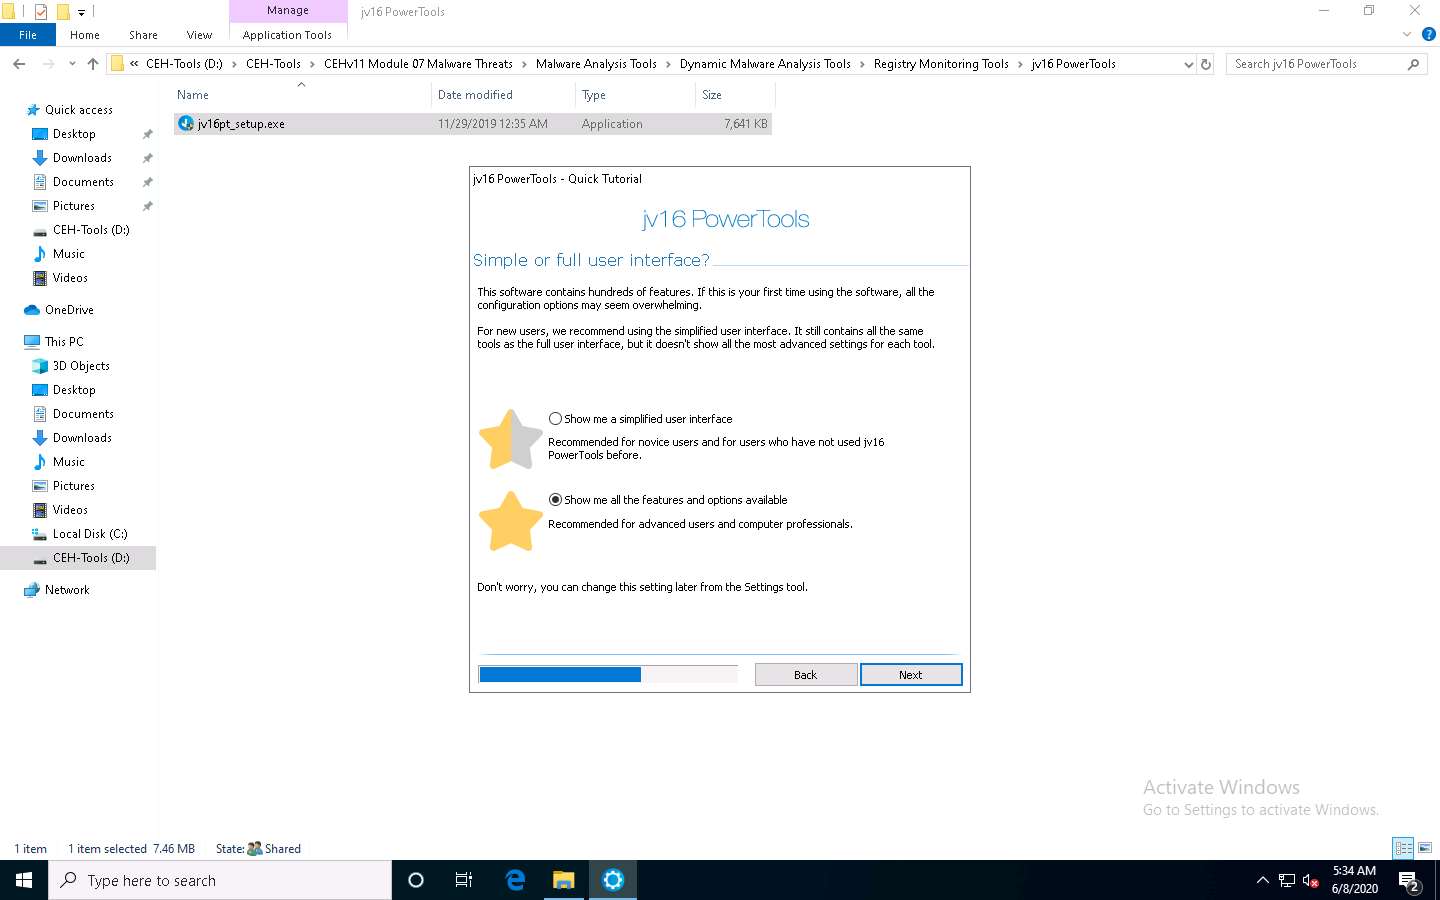
The Simple or full user interface wizard appears; choose the Show me all the features and options available radio button, and then click Next.
Click Next in the Global Ignore List wizard.
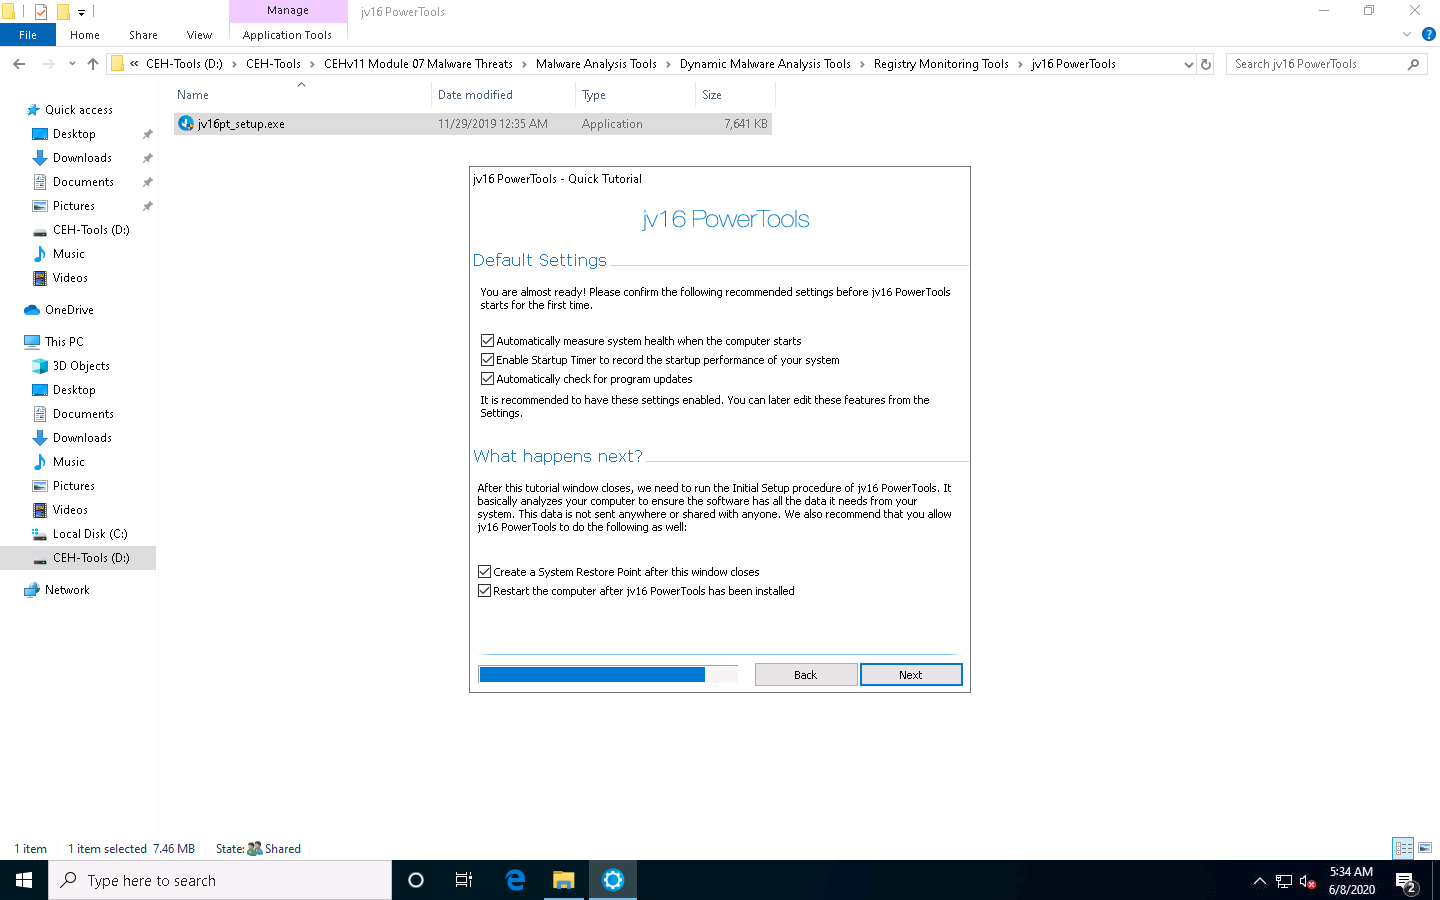
In the Default Settings wizard, leave all settings set to default, and then click Next.
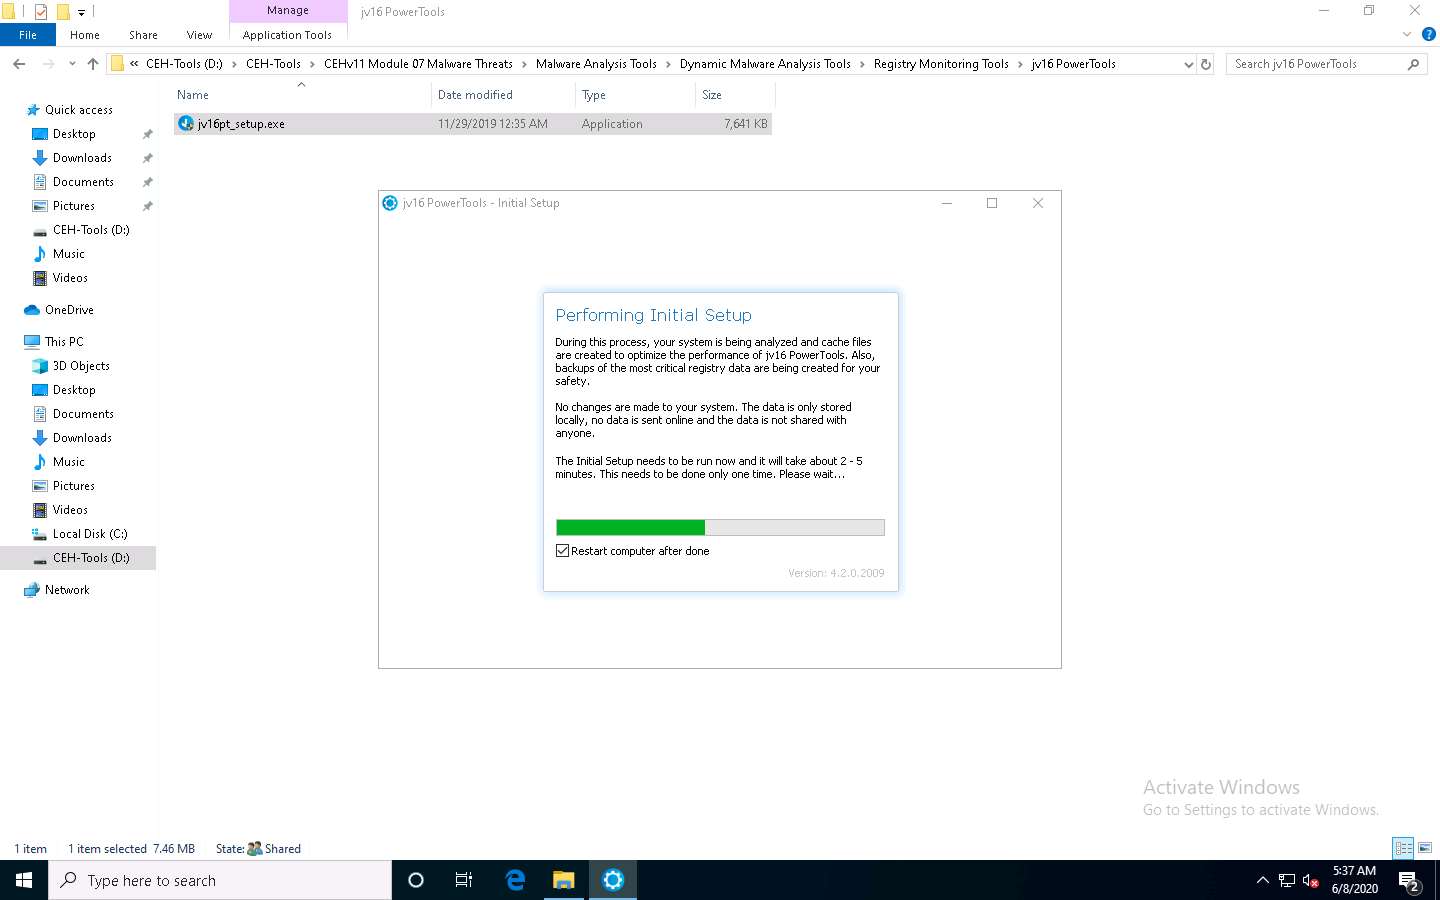
The Performing Initial Setup window appears. Make sure that the Restart computer after done option is checked. Once the setup is done, the machine will automatically restart.
Once the machine has restarted, click Ctrl+Alt+Delete to activate the machine. By default, Admin user account is selected, click Pa$$w0rd to enter the password and press Enter to log in.
Observe that the jv16 PowerTools application launches automatically, along with a jv16 PowerTools pop-up; click No.
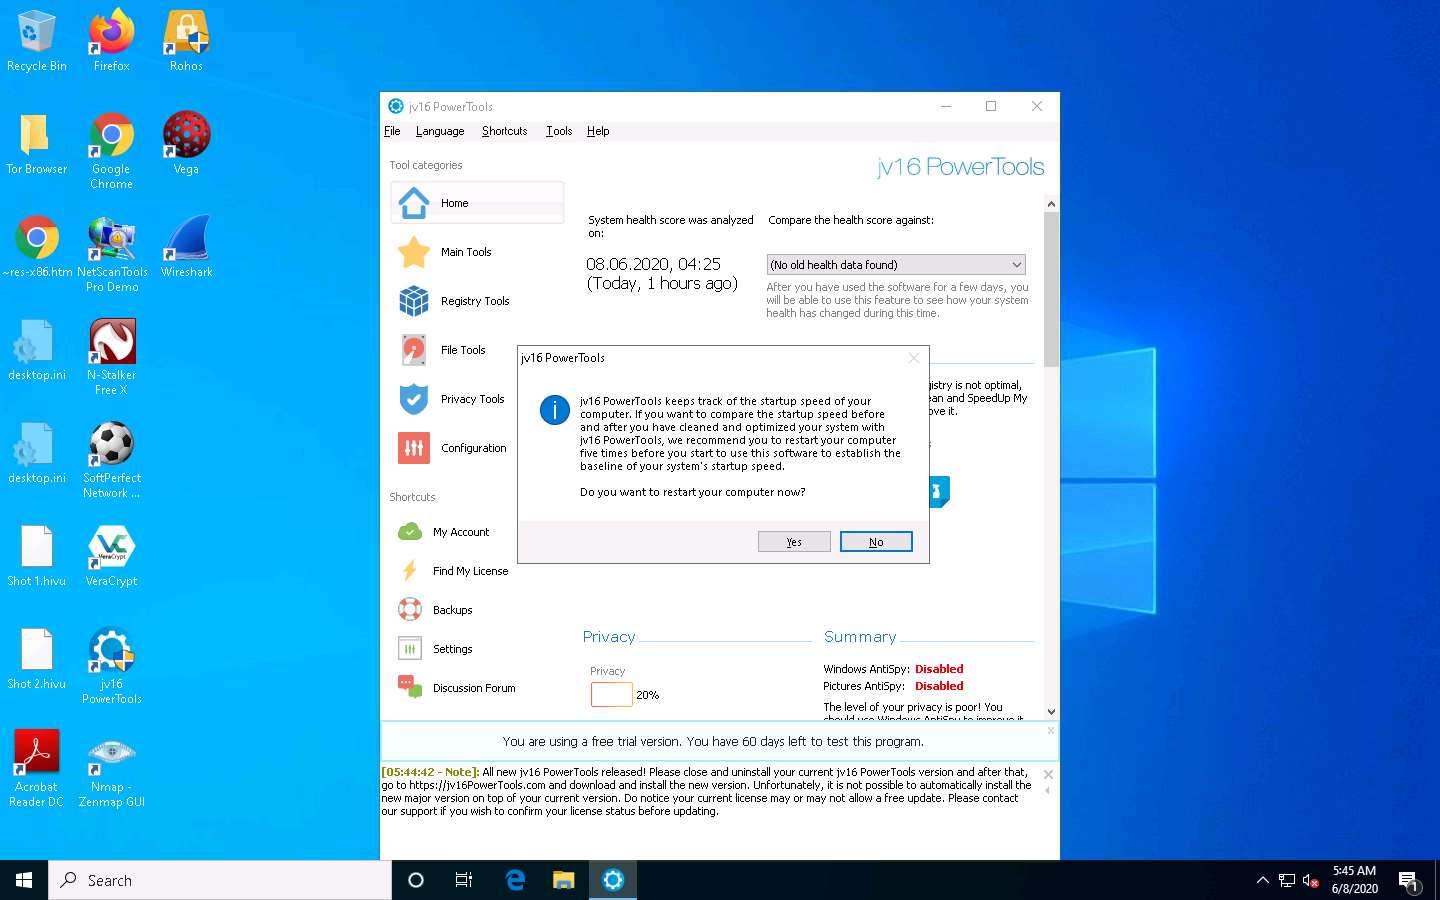
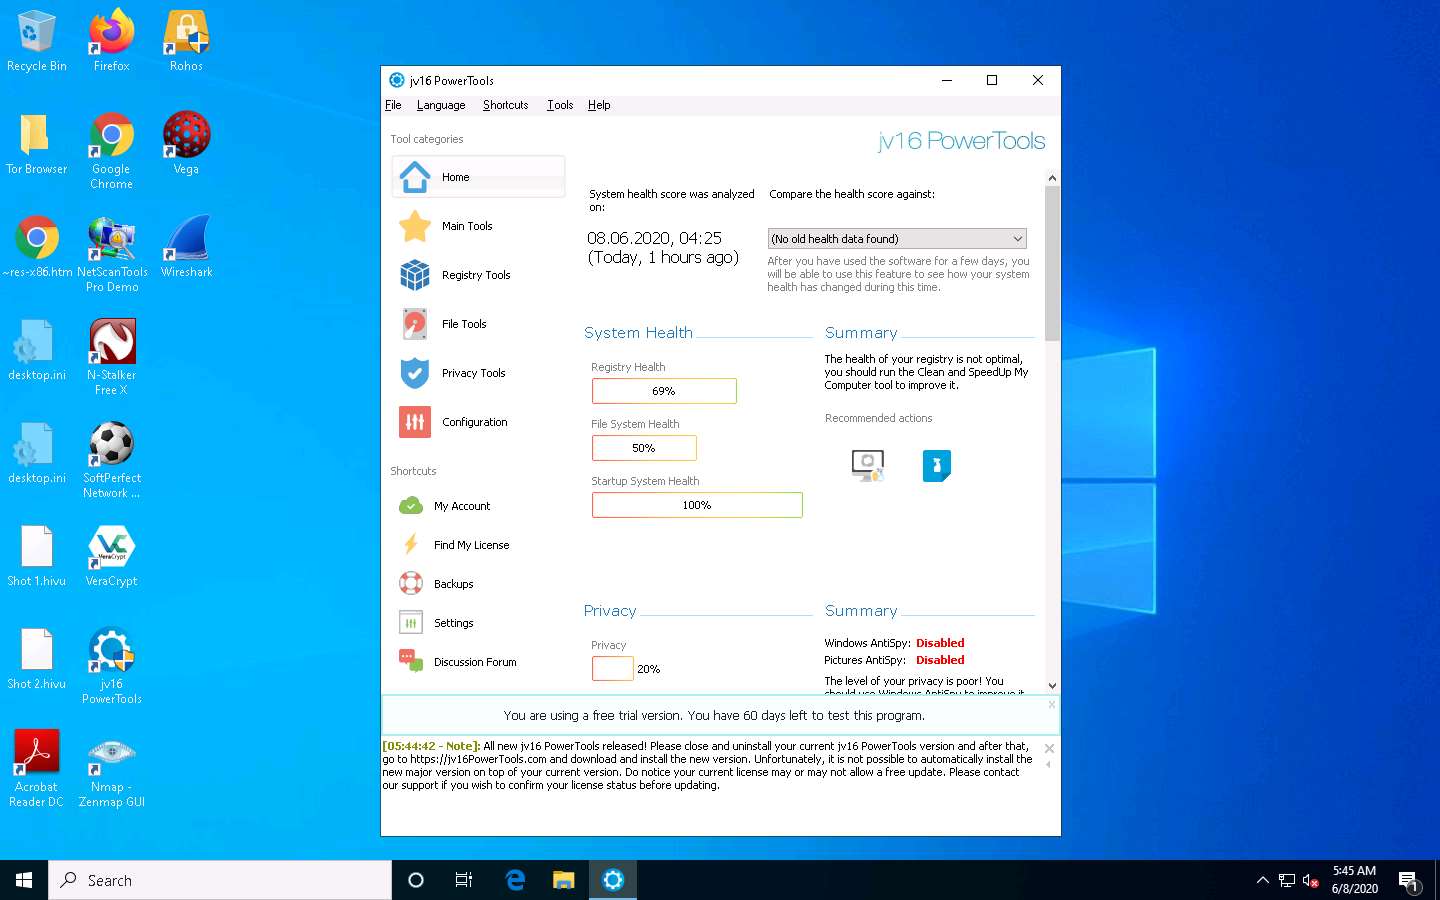
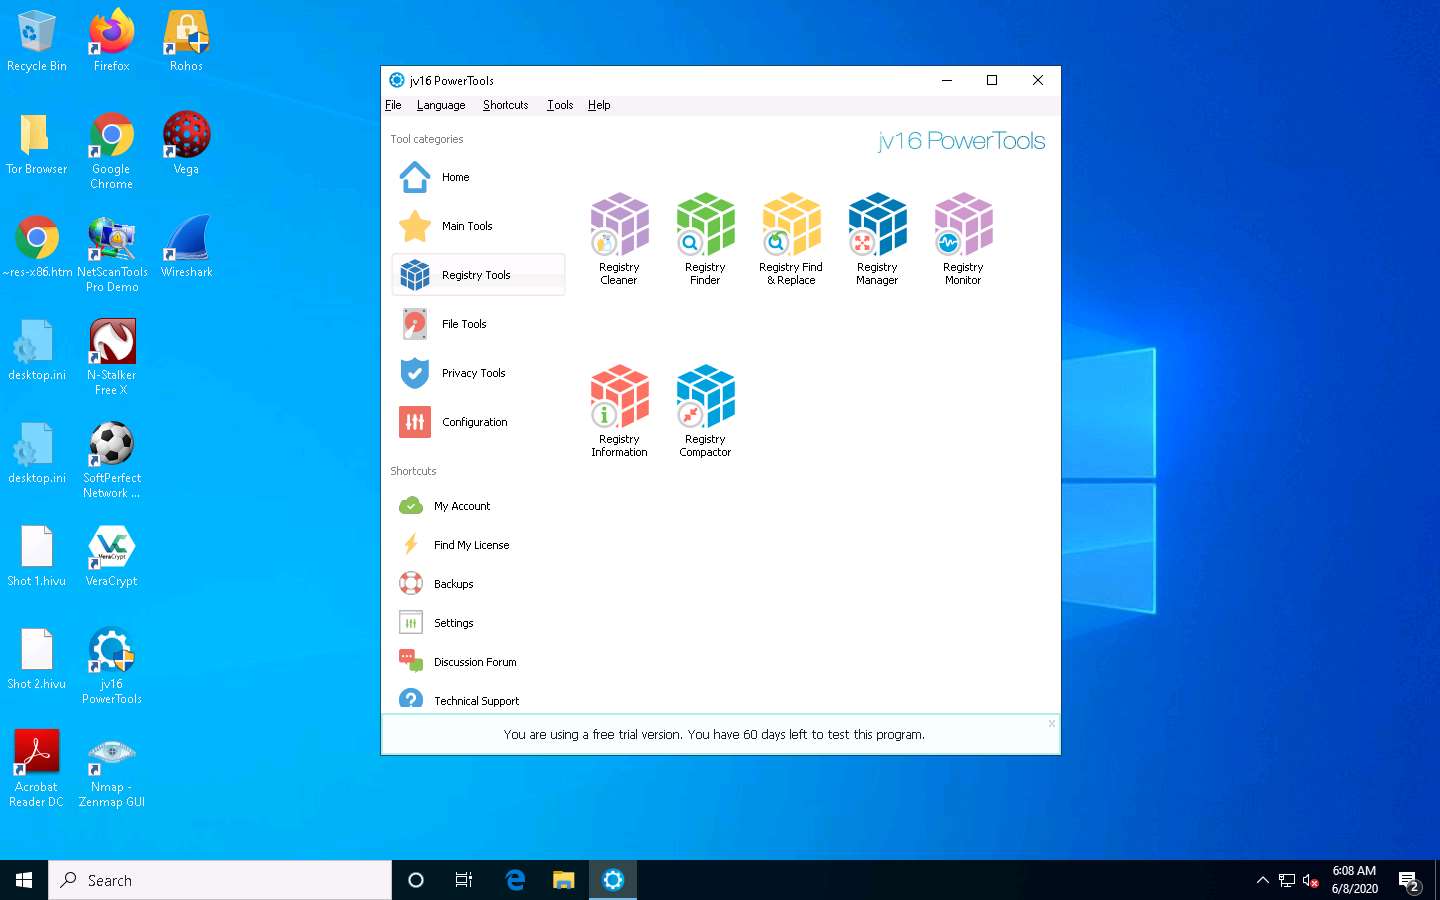
The jv16 PowerTools main window appears, as shown in the screenshot. By default, the Home option is selected, which displays the System Health, Privacy, Registry Integrity, and System Startup Times Summaries.
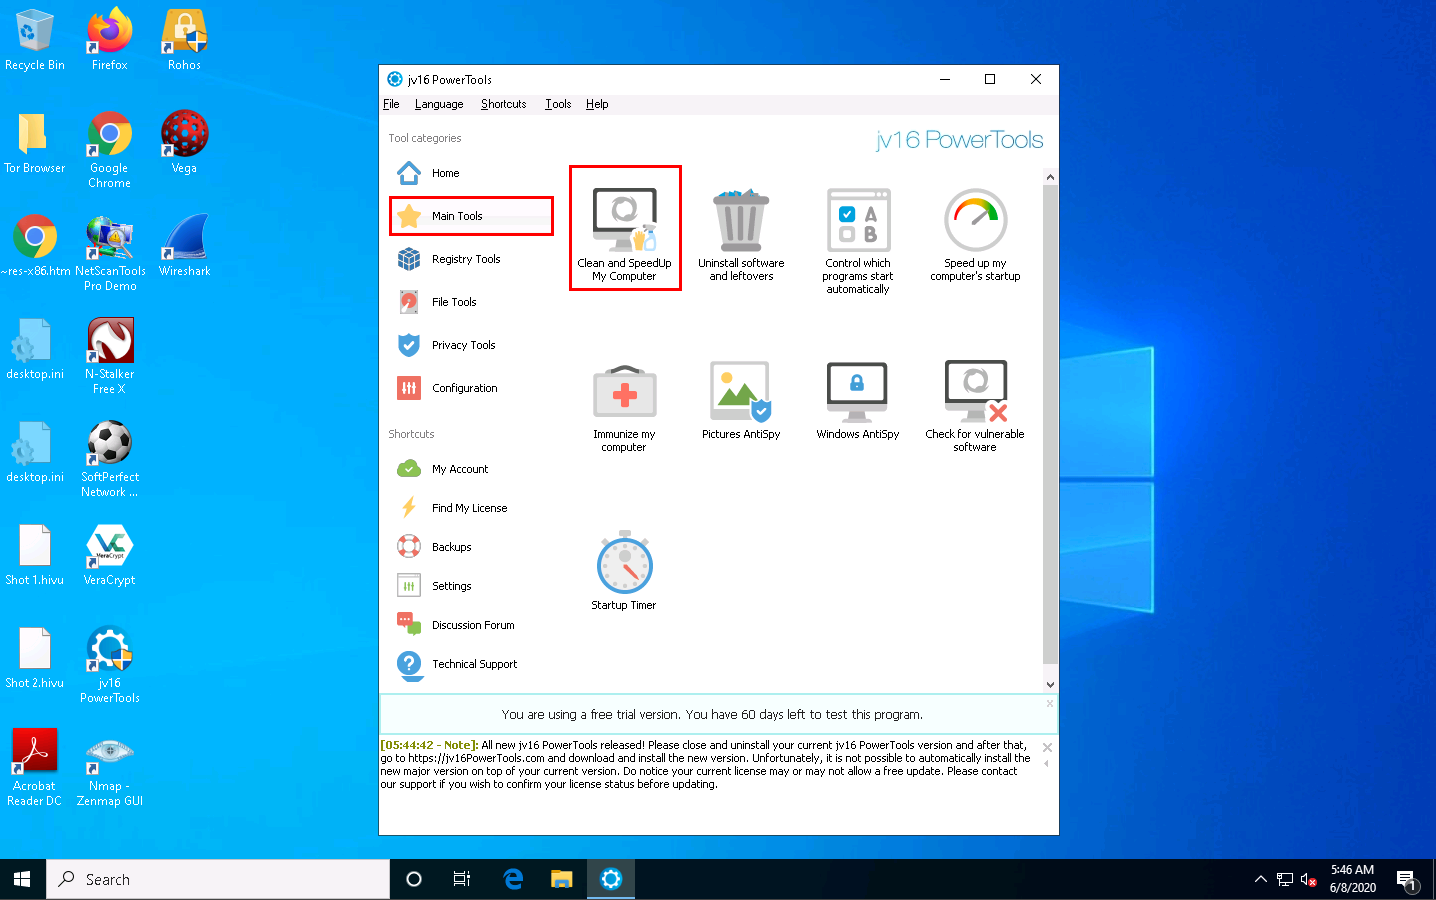
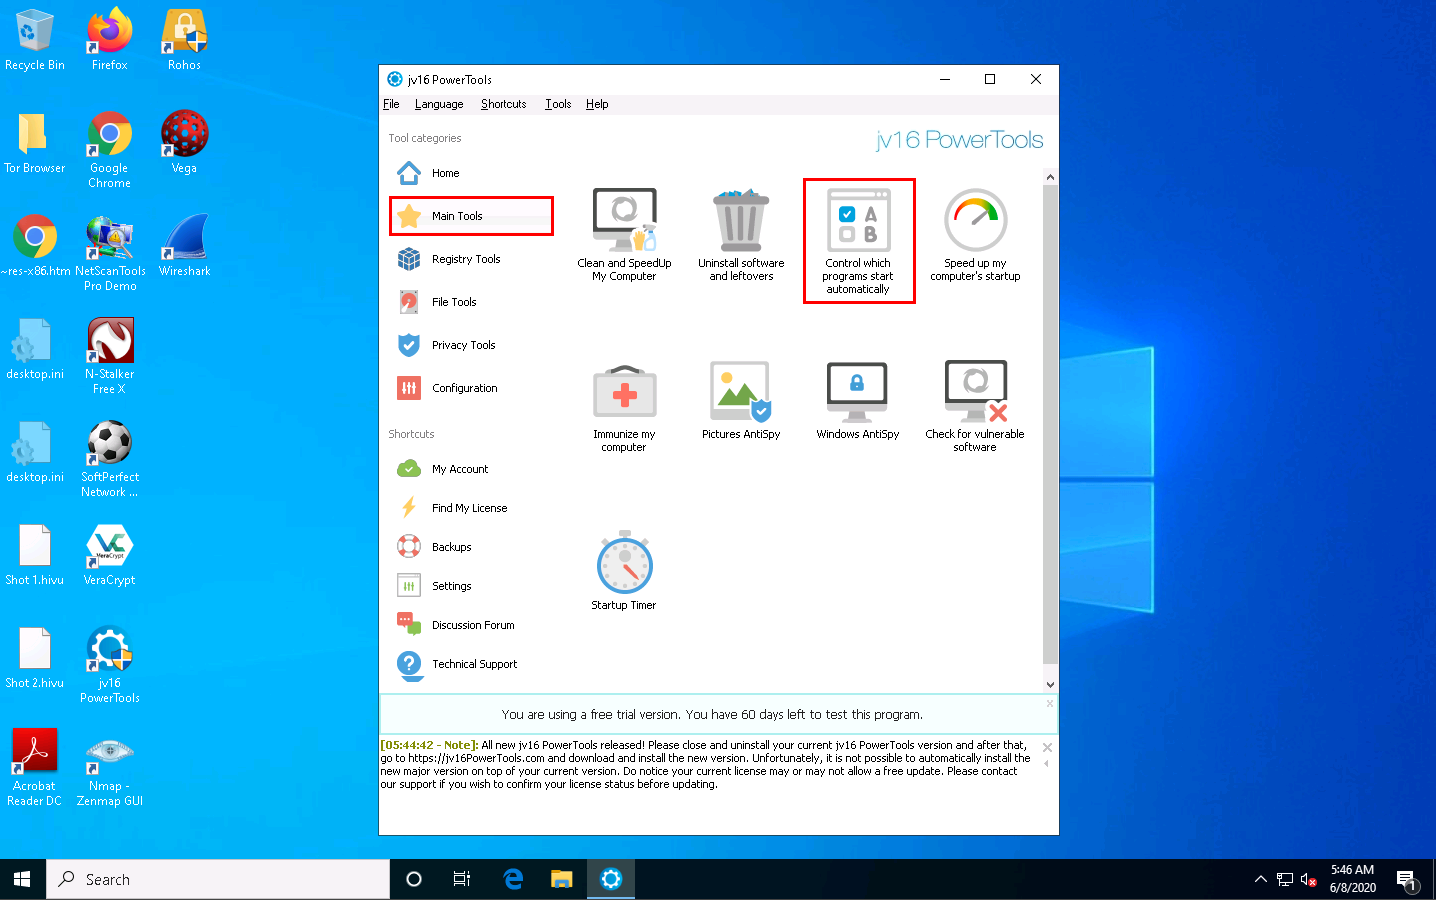
Click the Main Tools section from the left pane to view the available tools in jv16 PowerTools. The Main Tools section lists out all available tool features, as shown in the screenshot.
Click the Clean and SpeedUp My Computer icon.
The Clean and SpeedUp My Computer wizard appears. Click the Settings and click Start.
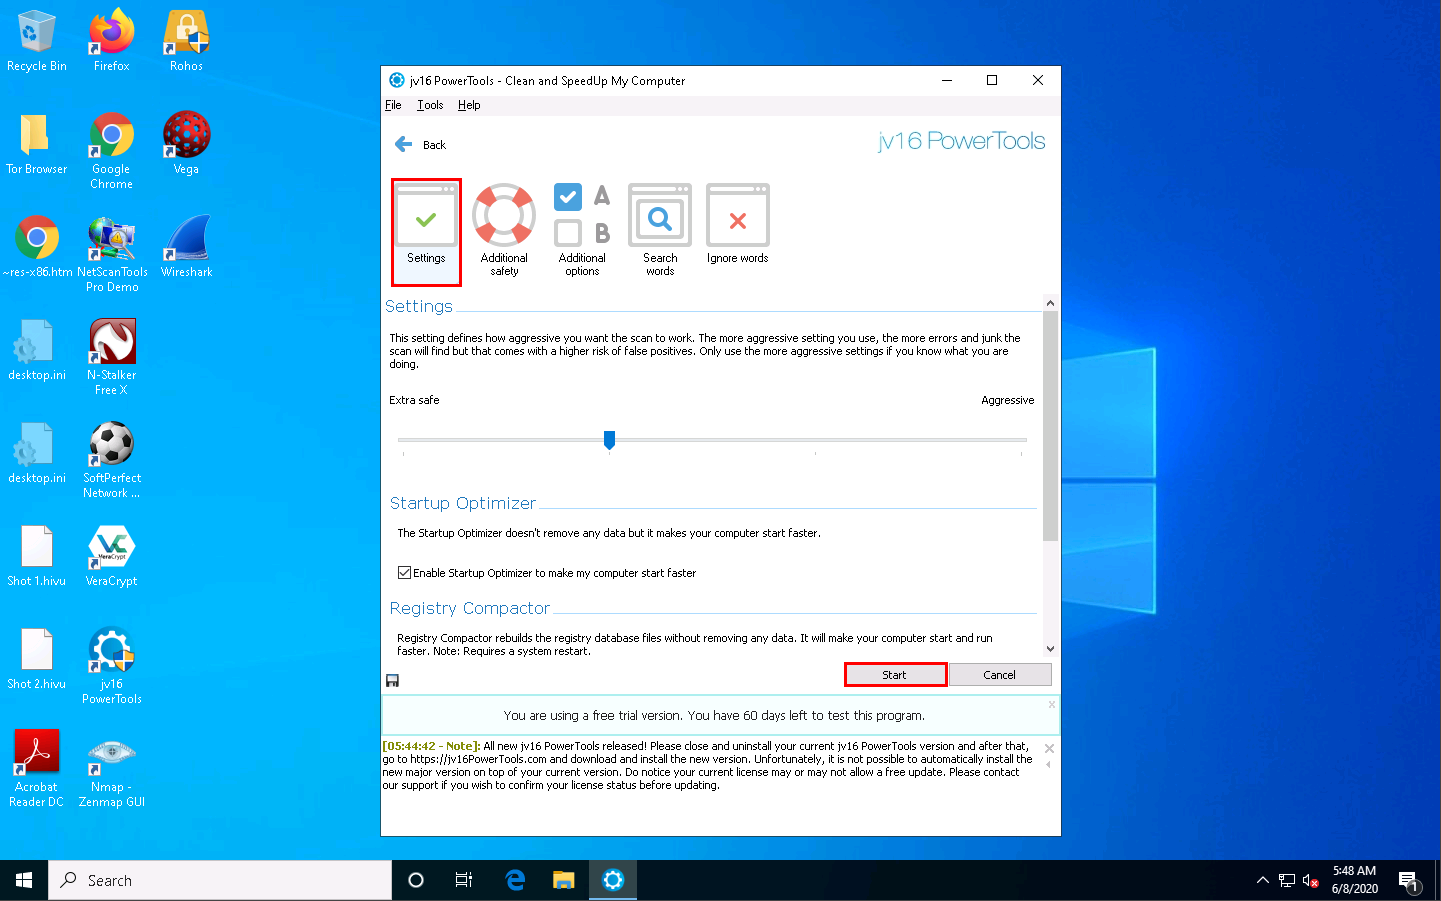
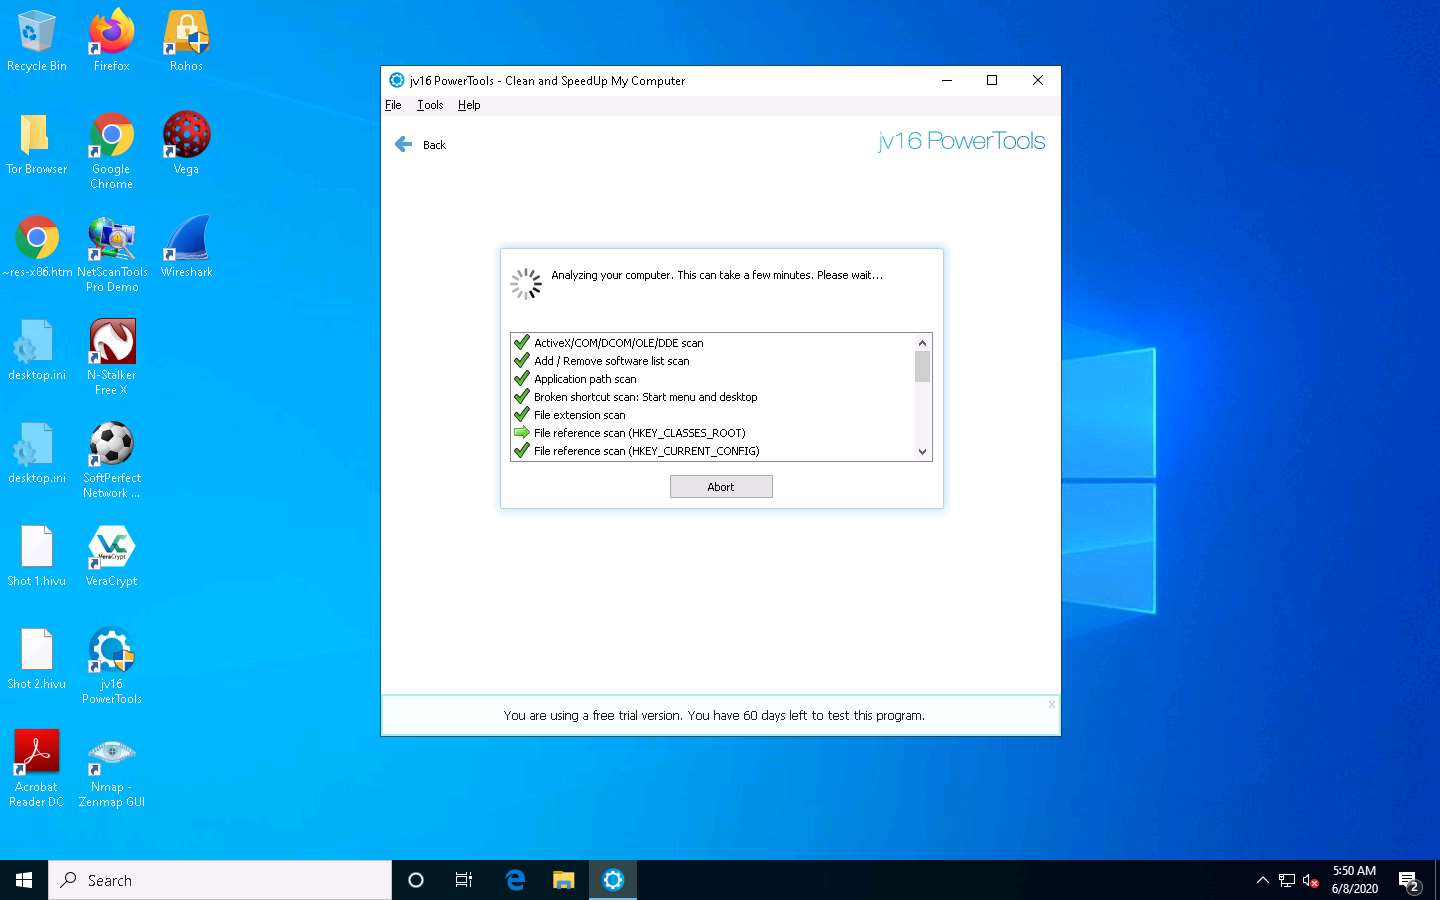
The tool starts analyzing the machine. The process takes a few minutes.
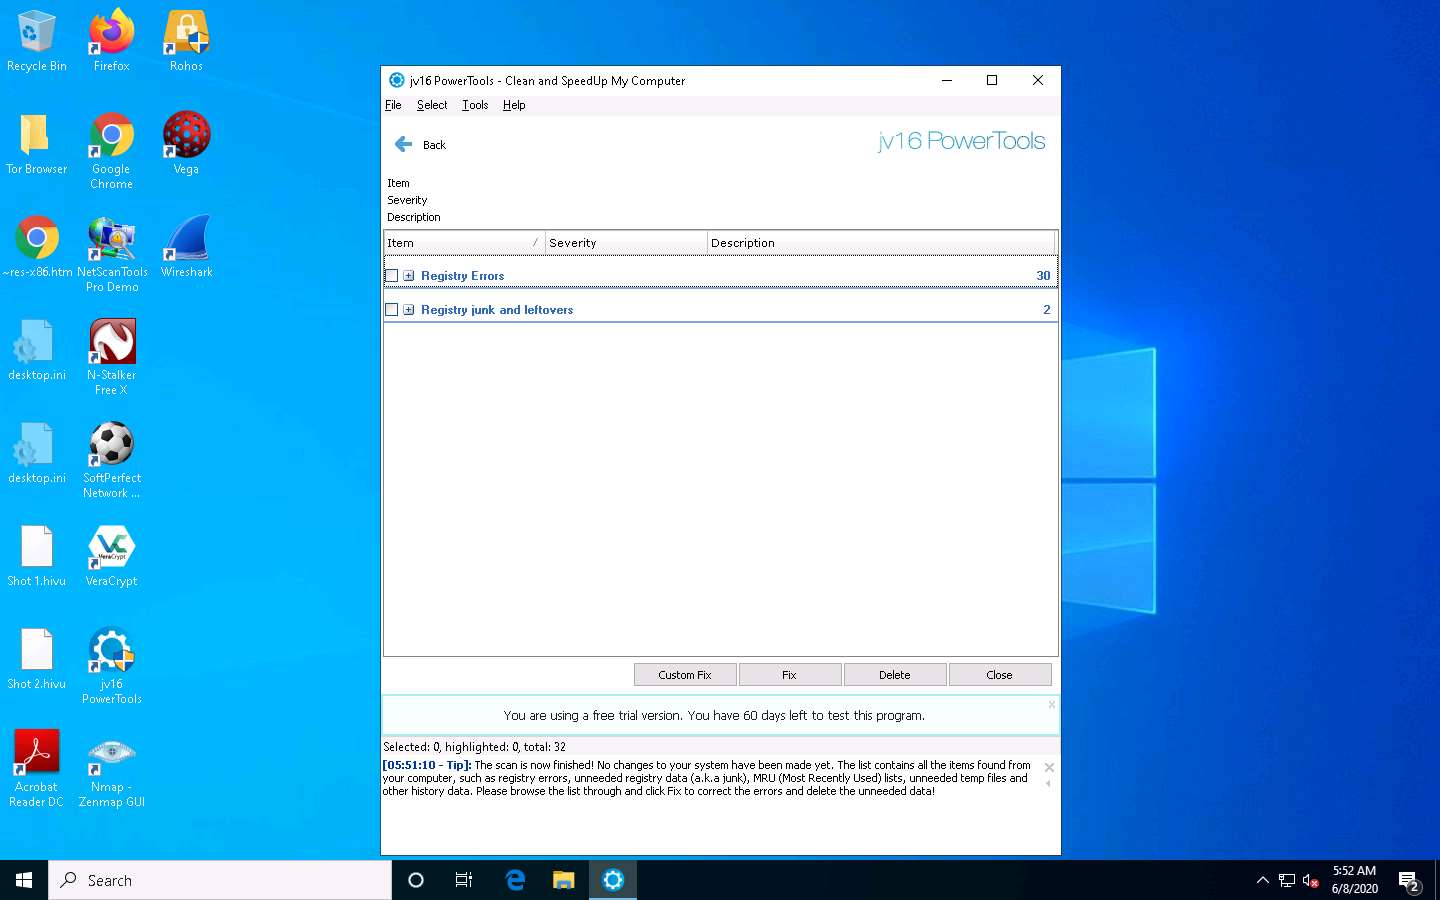
Once the scanning is complete, jv16 PowerTools displays the Registry Errors, Temp Files, and other results.
To view the registry errors, expand the Registry Errors node, and then expand the Invalid ActiveX/DDE/COM/DCOM/OLE item node.
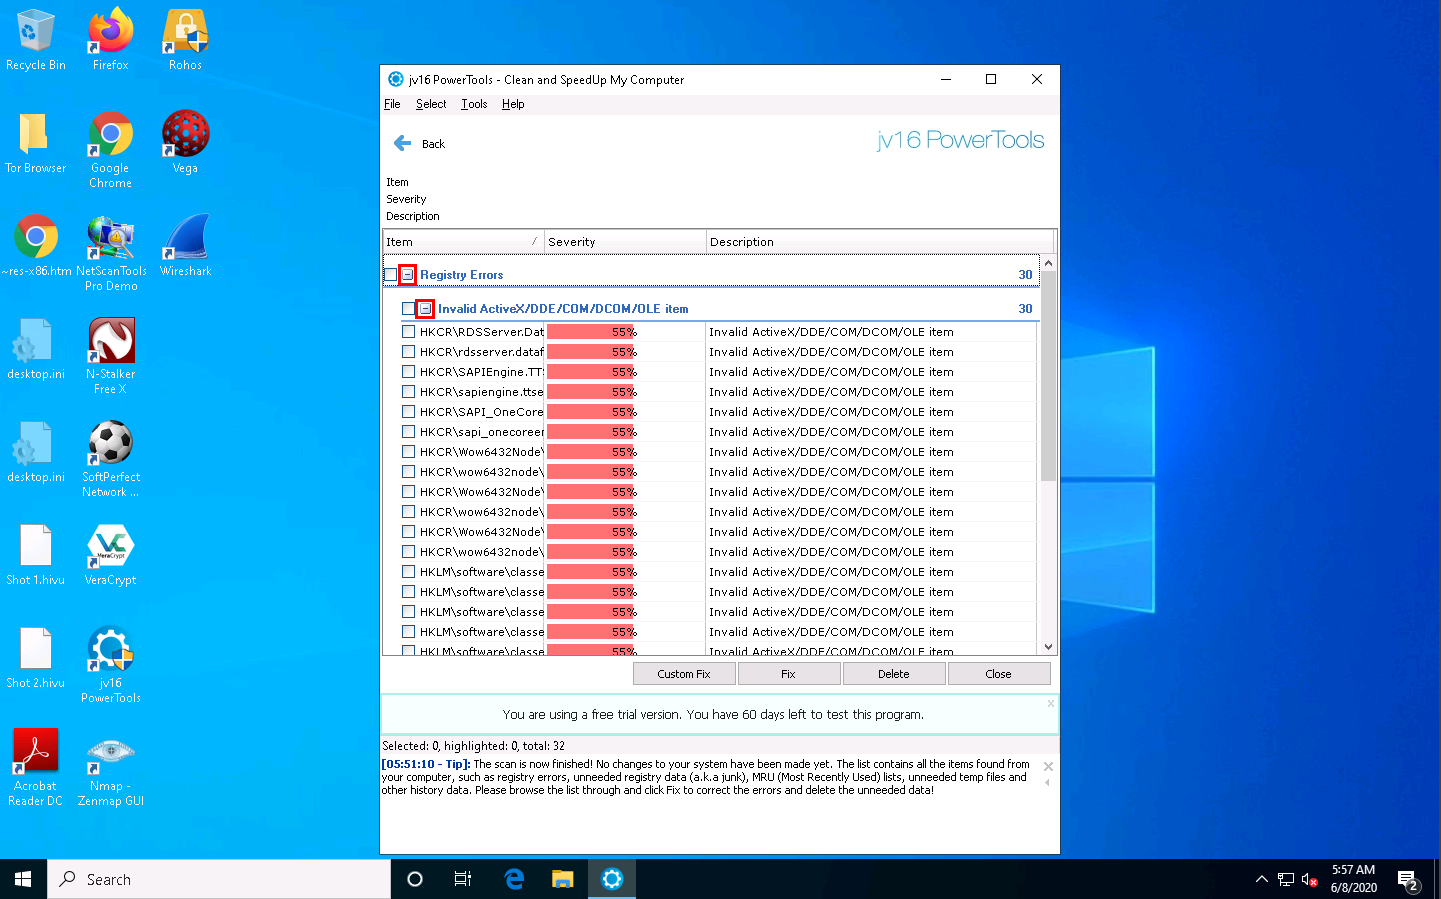
In the same way, expand the other items in the list to view all temporary files, log files, and other data.
Select all items in the application window, and then click Delete.
The registry errors might differ in your lab.
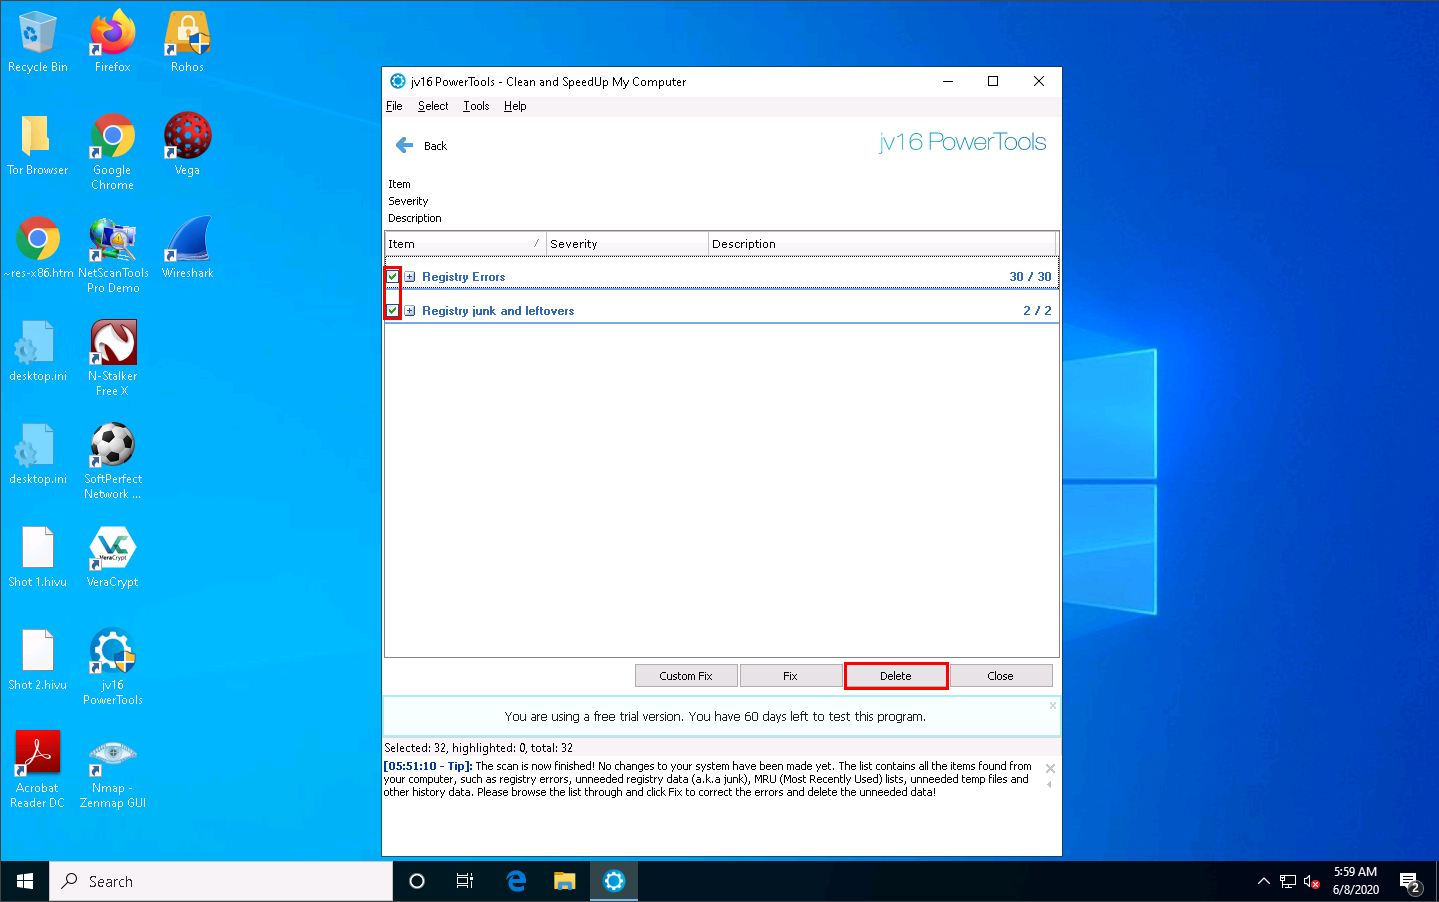
The jv16 PowerTools pop-up appears. If you want to create a backup, click Yes. In this lab, we have selected the No option, which deletes all files.
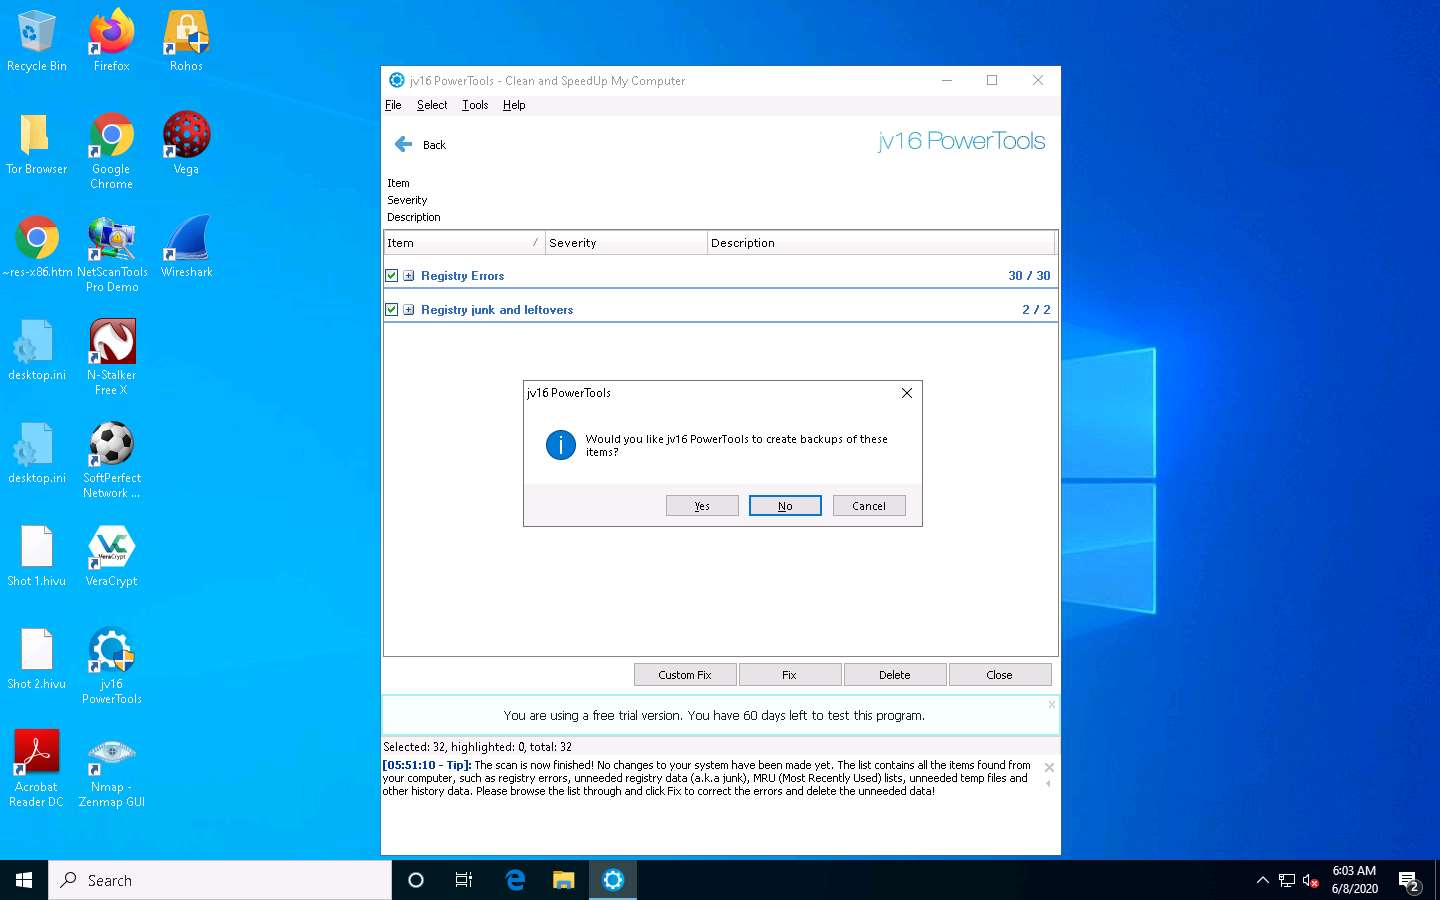
This deletes all unwanted or harmful registries, logs, temporary files, and other identified files, ensuring the safety of your computer.
If a jv16 Power Tools pop-up appears, asking you to restart the computer, click No.
If a Clean and Fix My Computer dialogue-box appears, close it.
jv16 PowerTools redirects you to the Main Tools section; click Control which programs start automatically.
Select the software of your choice in the Startup Manager and assign the appropriate action for the software you check.
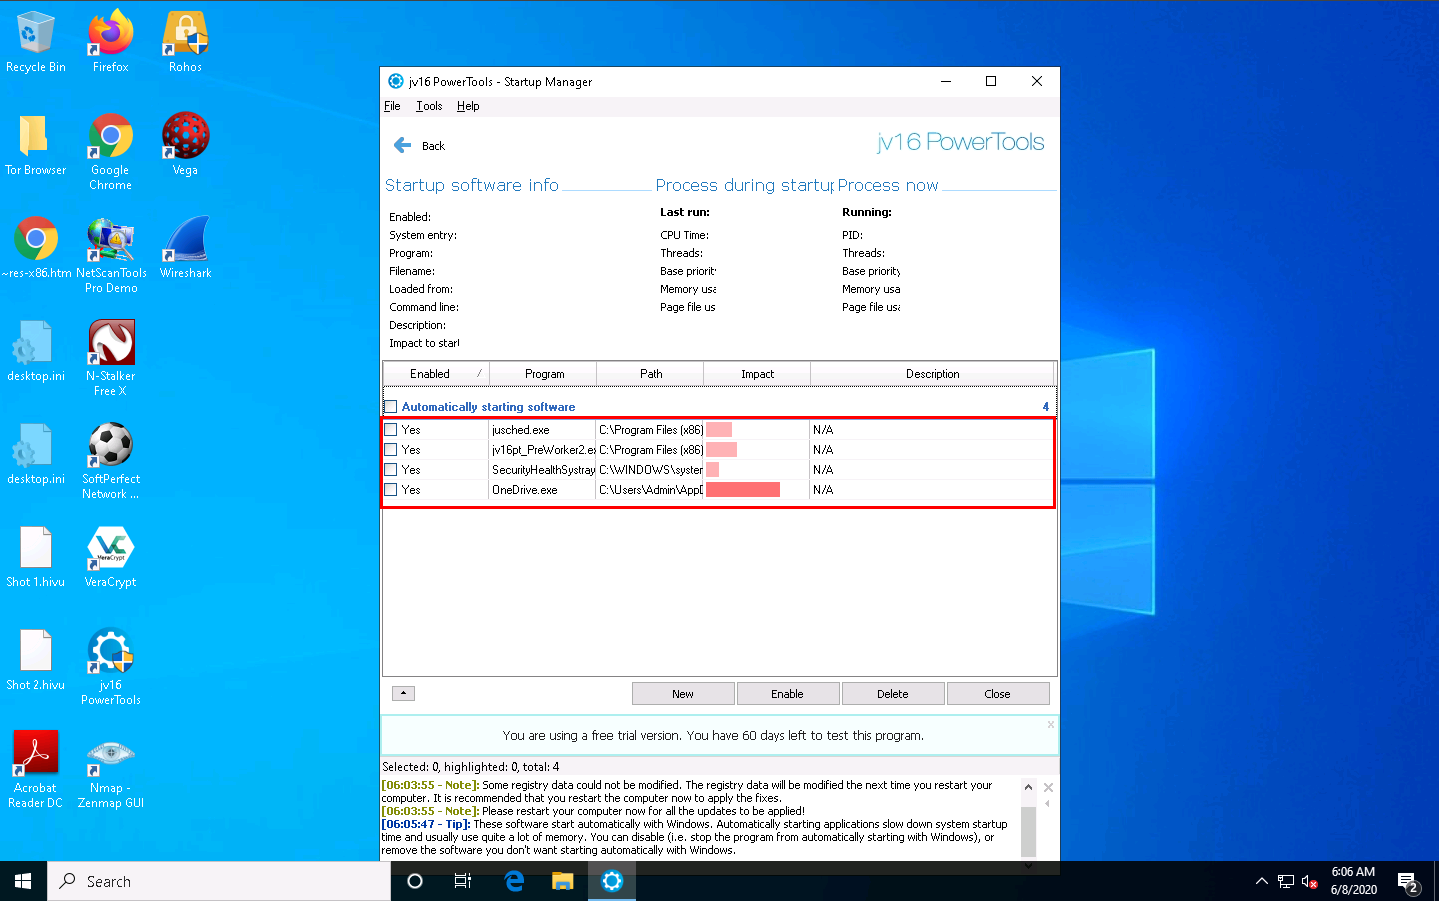
Thus, you could find any Trojans or malicious files running at system startup and choose the appropriate actions against them. Click Close in the Startup Manager wizard, which will redirect you to the Main Tools section of jv16 PowerTools.
Select Registry Tools to view Registry-related functions.
This section helps you to find, manage, monitor, compress, clean, or replace registry files.
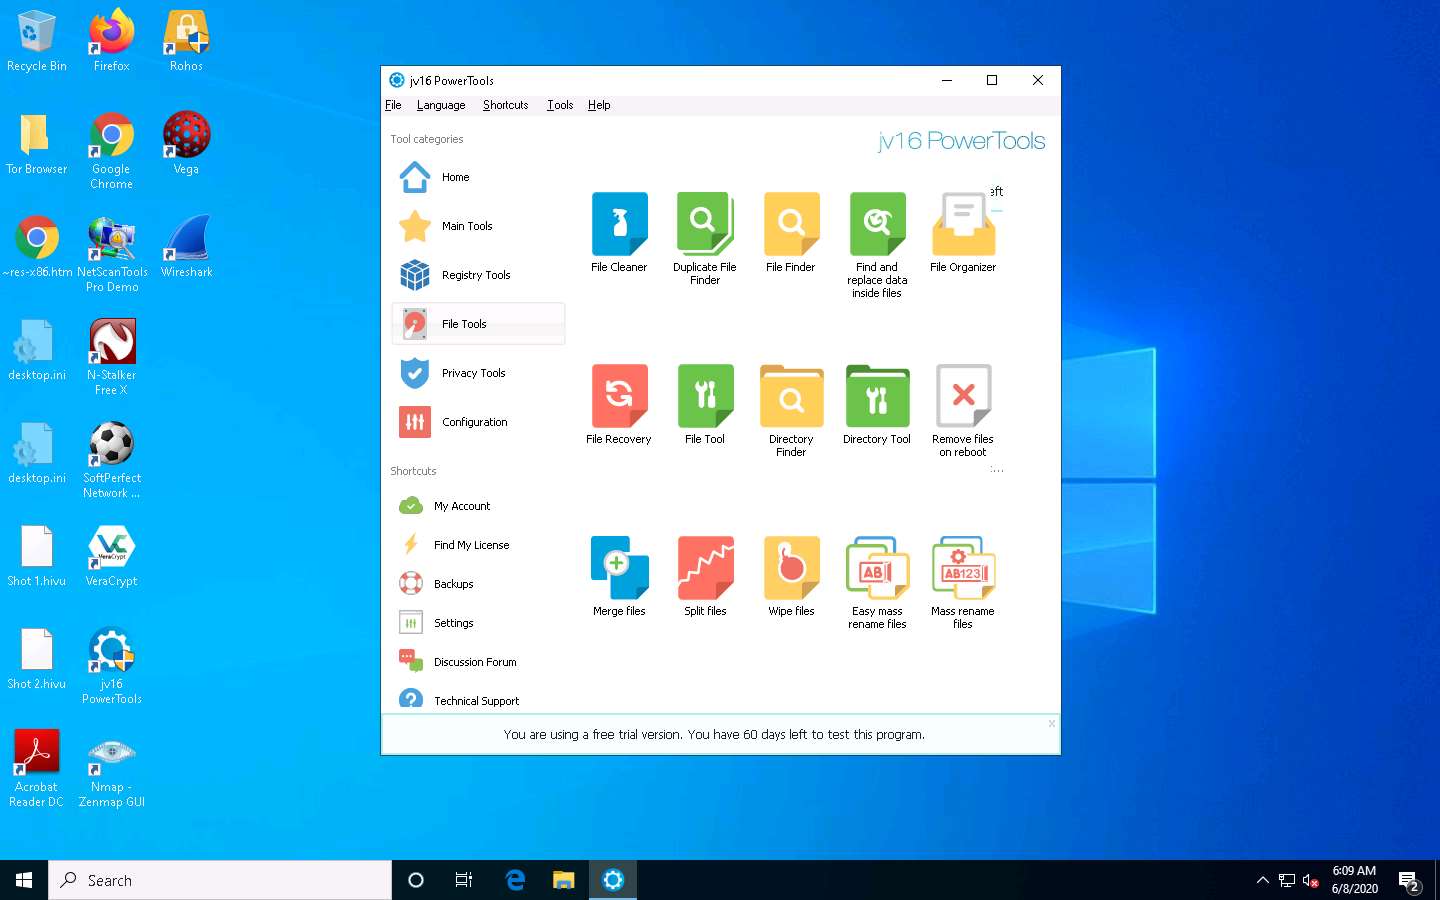
Click File Tools to view file-related functions.
This section helps you to find, recover, clean, organize, or merge files or directories.
Select Privacy Tools to view privacy-related functions.
This section helps you to check for vulnerable software, spyware, clear your history, and perform other tasks.
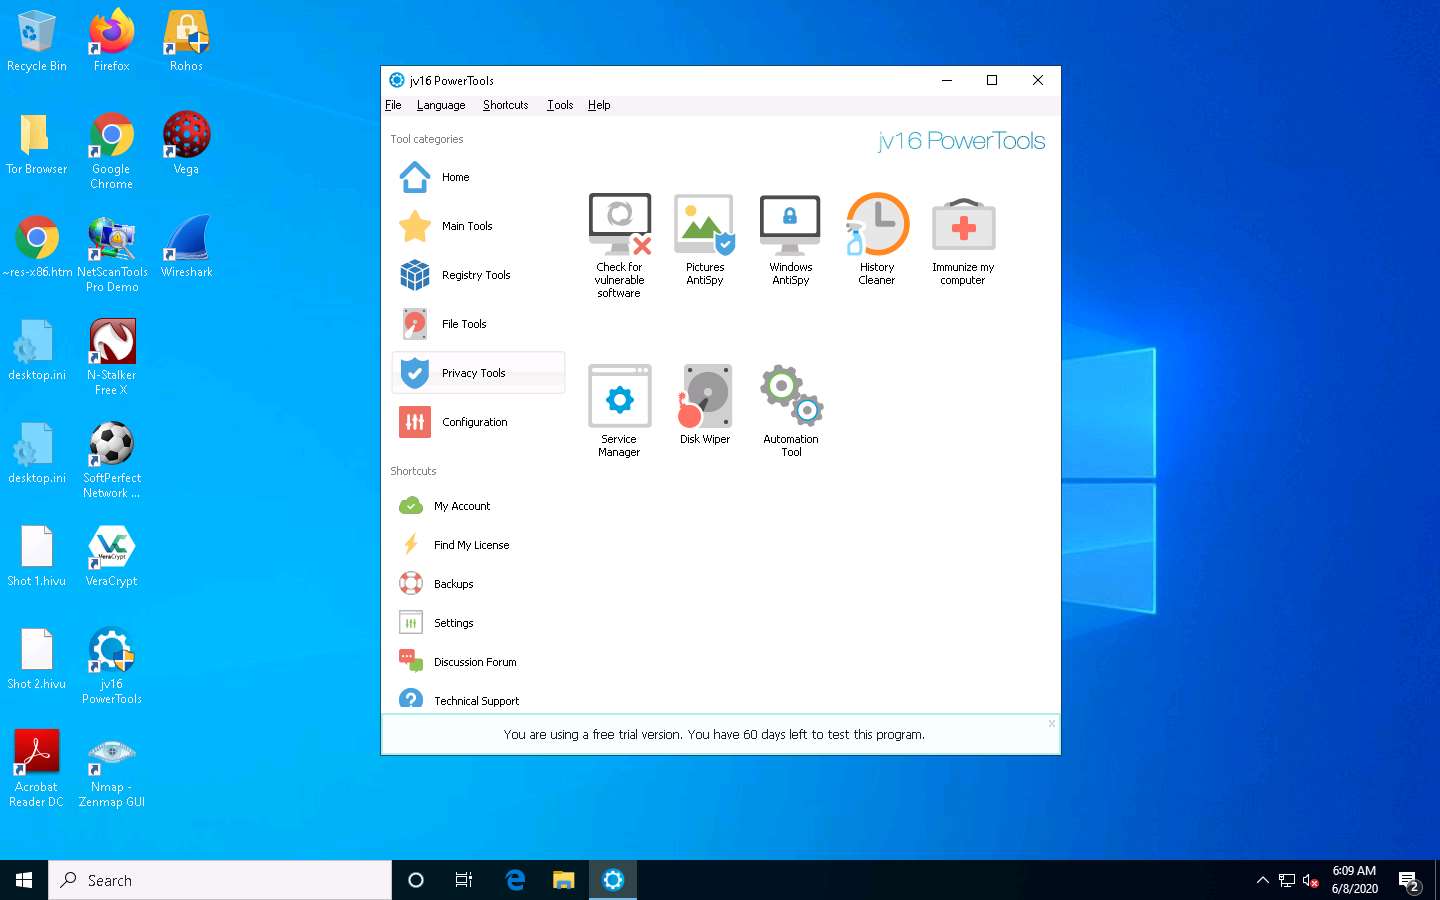
The Disk Wiper option wipes the disk—this is not recommended.
Select Backups to view the system-related backups.

The Jv16 PowerTools - Backup Tool window appears, displaying the registry, file, and other backups.
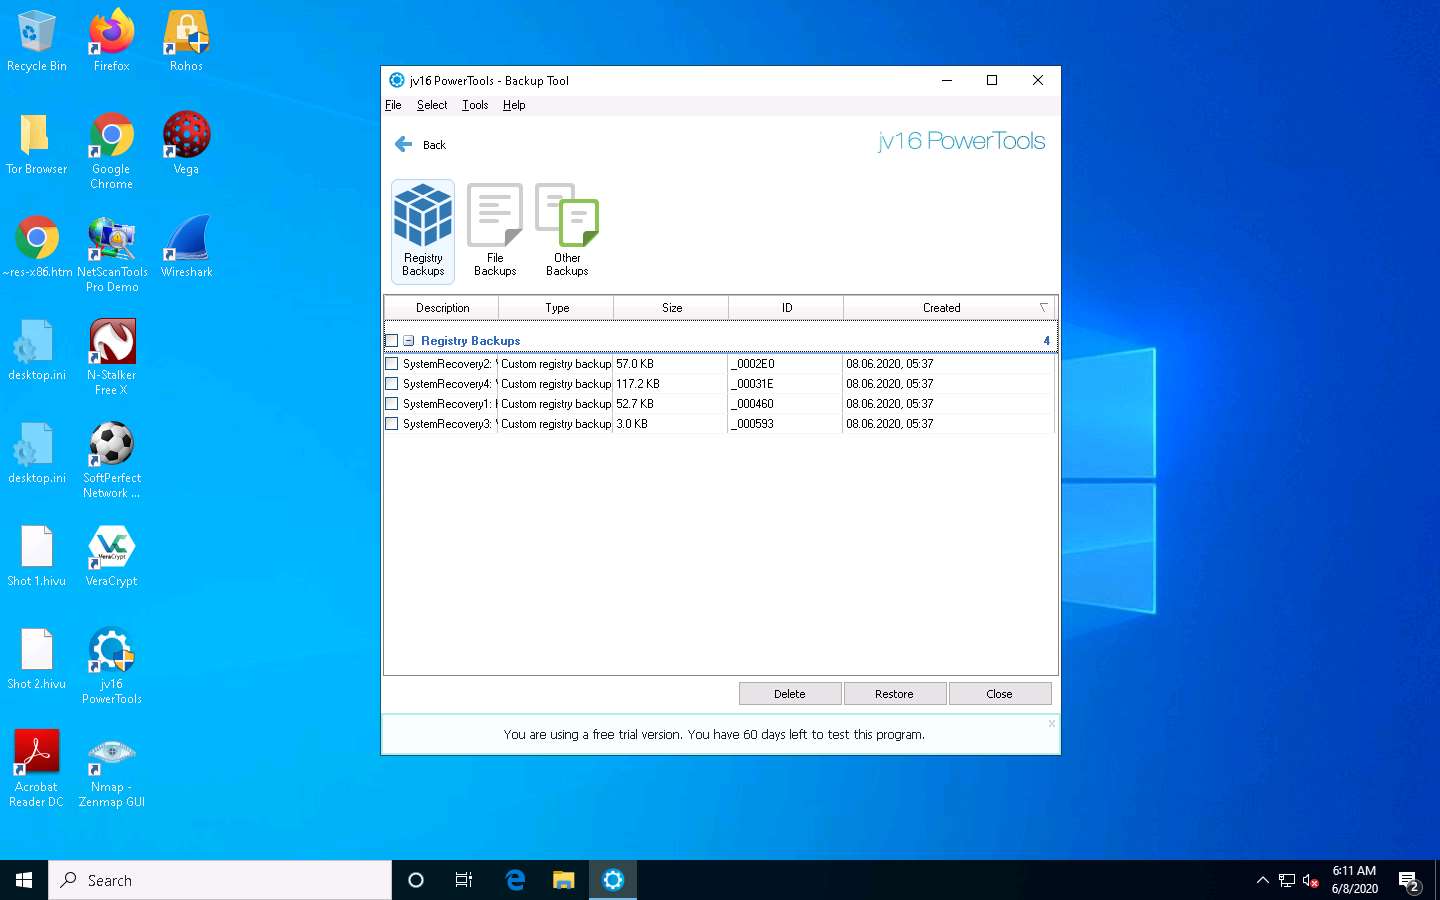
You can choose whether to delete or restore backups in this window.
Click Close on the Jv16 PowerTools - Backup Tool window; this will redirect you to the Main Tools section of jv16 PowerTools.
If a restart prompt appears, then restart the machine.
Examining the result of the jv16 PowerTools scan reveals unwanted registry entries and other suspicious activities on the machine and allows the user to stop or delete them.
Close the jv16 PowerTools main window.
You can also use other registry monitoring tools such as Reg Organizer (https://www.chemtable.com), Registry Viewer (https://accessdata.com), RegScanner (https://www.nirsoft.net), or Registrar Registry Manager (https://www.resplendence.com) to perform registry monitoring.
Task 4: Perform Windows Services Monitoring using Windows Service Manager (SrvMan)
Attackers design malware and other malicious code in such a way that they install and run on a computer device in the form of a service. As most services run in the background to support processes and applications, malicious services are invisible, even when they are performing harmful activities on the system, and can even function without intervention or input. Malware spawns Windows services that allow attackers to control the victim machine and pass malicious instructions remotely. Malware may also employ rootkit techniques to manipulate the following registry keys to hide their processes and services.
HKEY_LOCAL_MACHINE\System\CurrentControlSet\Services These malicious services run as the SYSTEM account or another privileged account, which provides more access compared to regular user accounts, making them more dangerous than common malware and executable code. Attackers also try to conceal their actions by naming the malicious services with the names similar to genuine Windows services to avoid detection.
You can trace malicious services initiated by the suspect file during dynamic analysis by using Windows service monitoring tools such as Windows Service Manager (SrvMan), which can detect changes in services and scan for suspicious Windows services.
SrvMan has both GUI and Command-line modes. It can also be used to run arbitrary Win32 applications as services (when such a service is stopped, the main application window automatically closes).
Here, we will use the SrvMan tool to check for suspicious windows services.
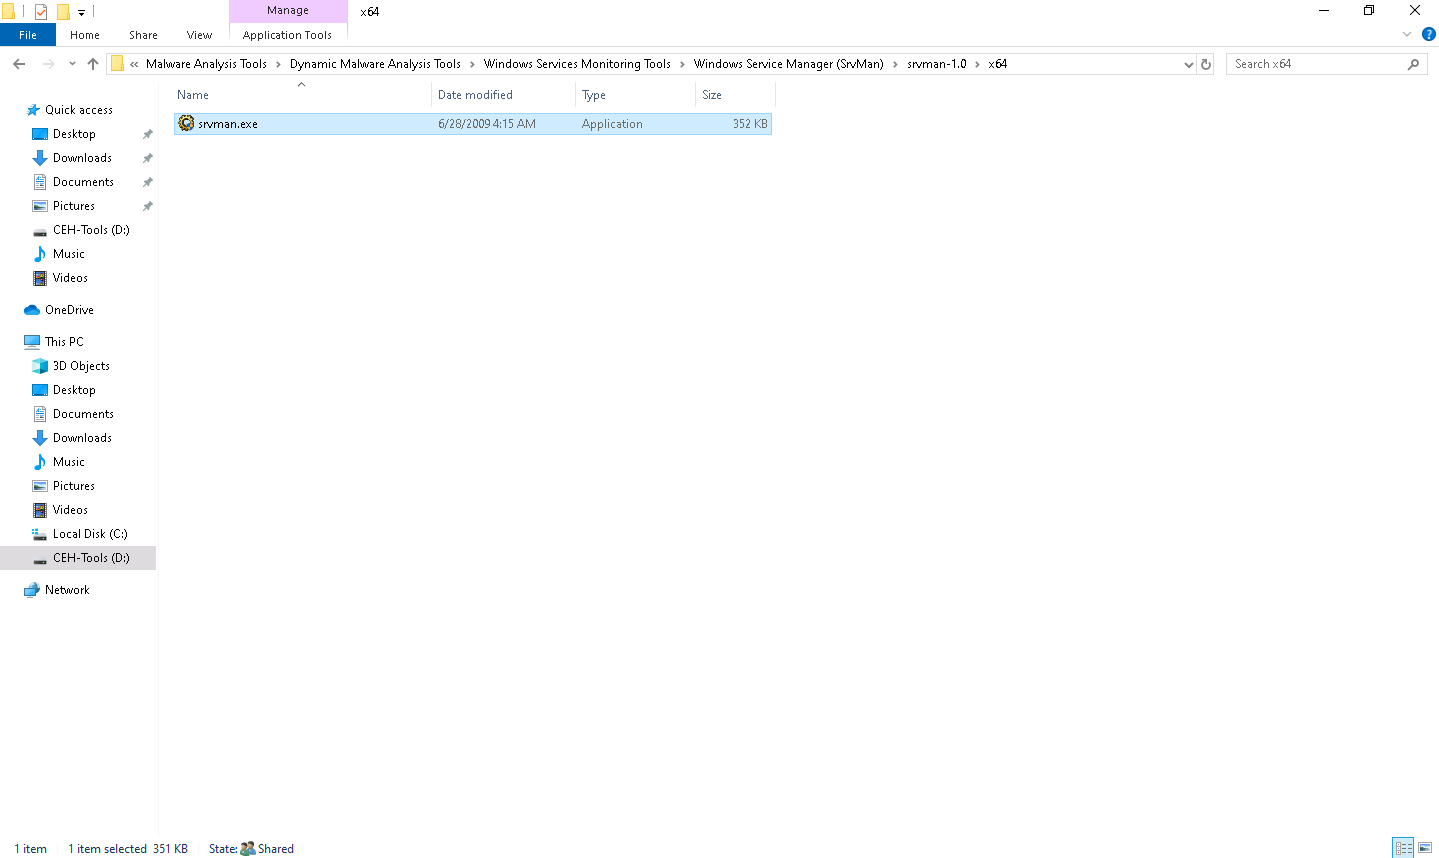
On the Windows 10 machine, navigate to D:\CEH-Tools\CEHv11 Module 07 Malware Threats\Malware Analysis Tools\Dynamic Malware Analysis Tools\Windows Services Monitoring Tools\Windows Service Manager (SrvMan)\srvman-1.0\x64 and double-click srvman.exe.
You can choose any of the executable files for the Windows Service Manager according to your computer and OS design.
If a User Account Control window appears, click Yes.
The Service Manager main window appears, listing all services available or running on the machine, as shown in the screenshot.
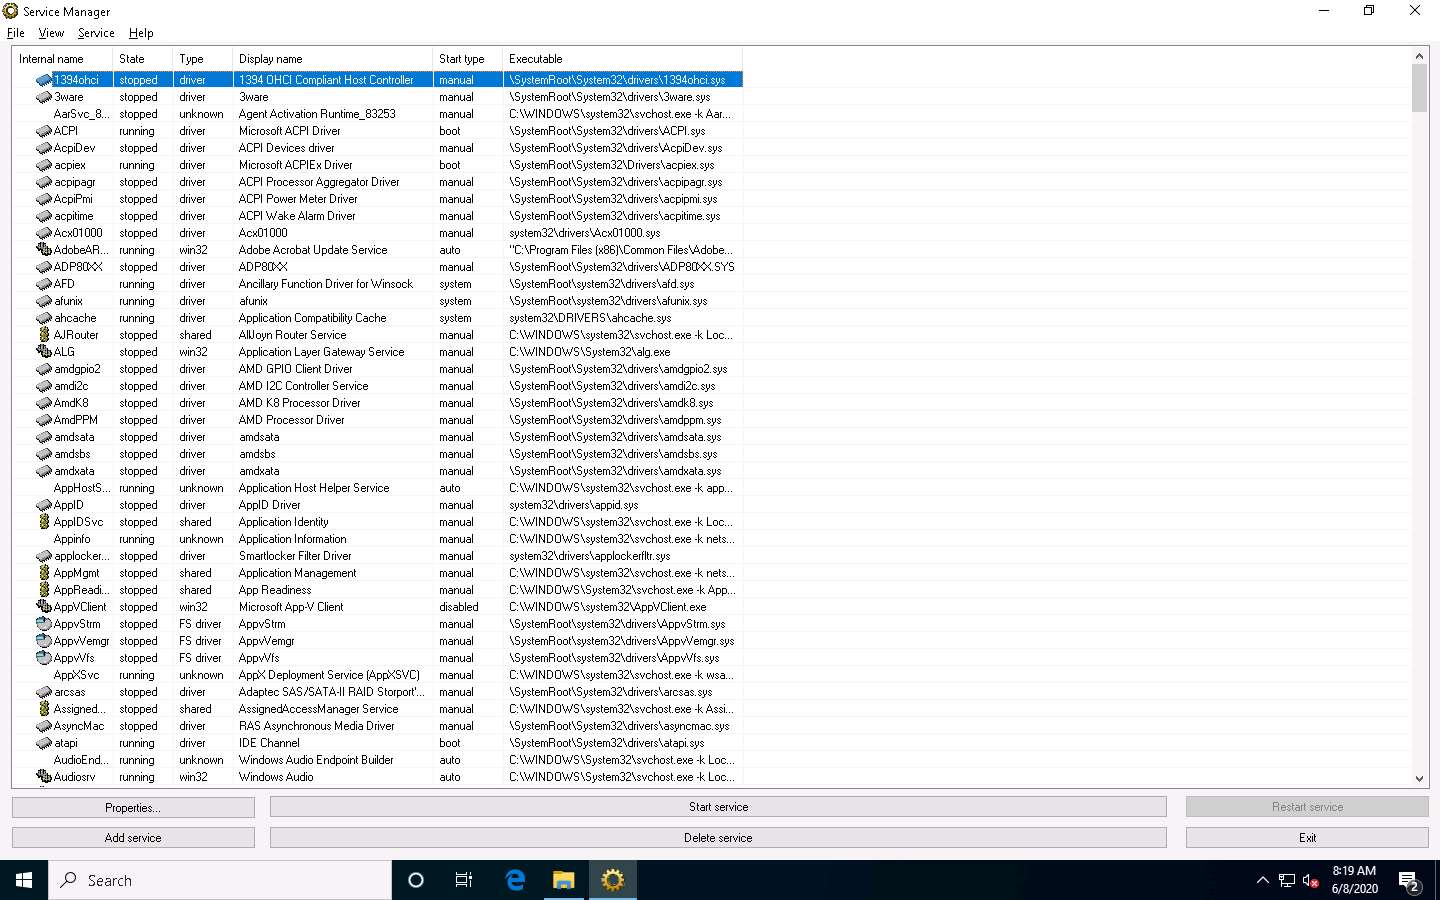
The Service Manager shows the Internal name, State, Type, Display name, Start type, and Executable data of the services.
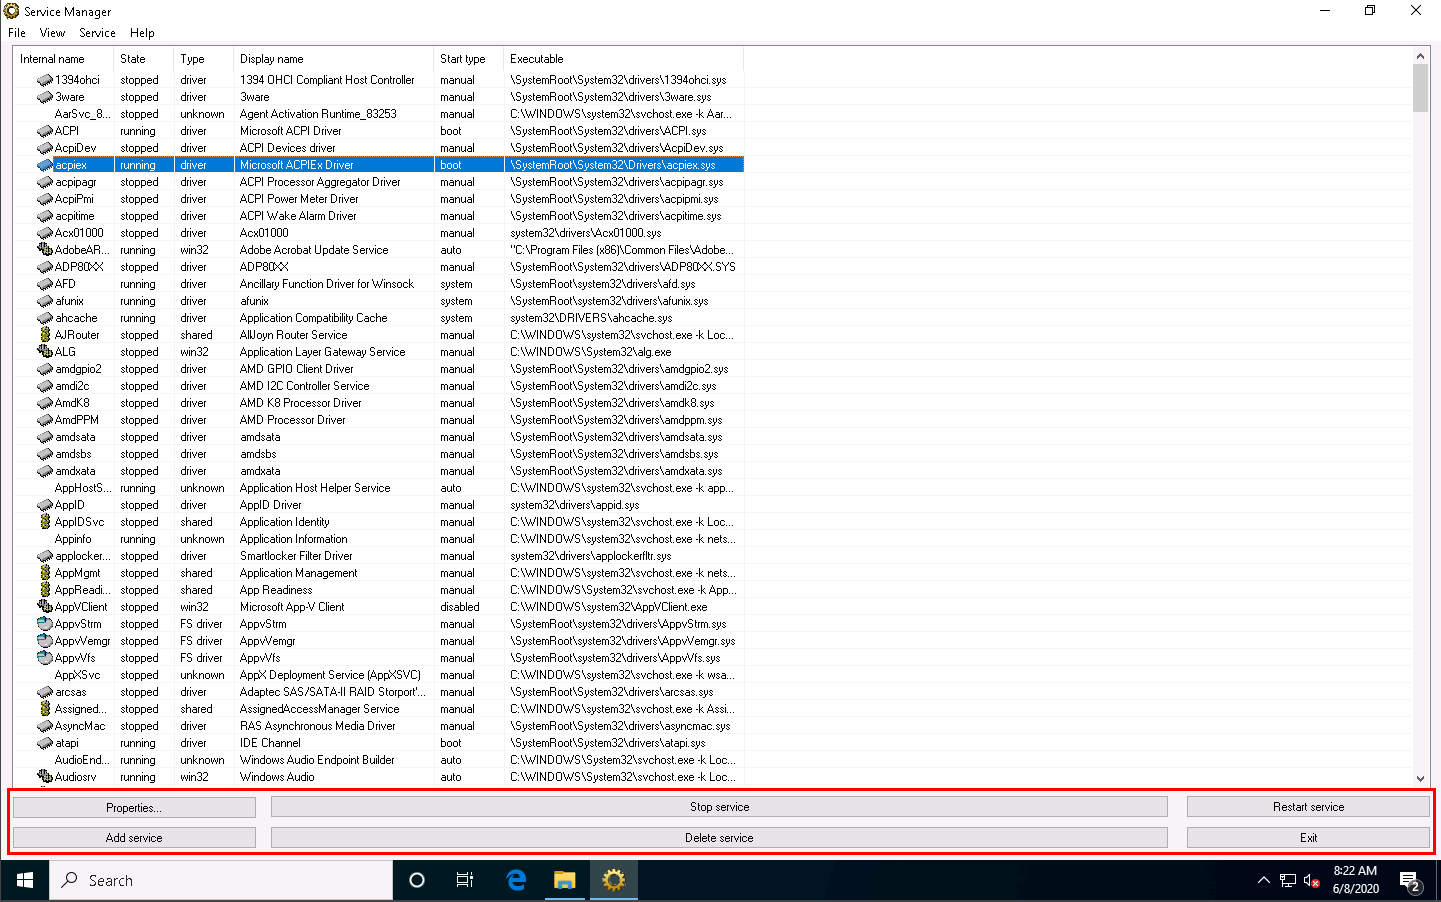
Here, you can choose any unwanted service that is running on your computer, and Stop or Delete that service by choosing the appropriate action.
You can view the properties of the selected service by clicking on Properties.
To Start a stopped service, click the Start service button. To stop a running service, click Stop service.
To restart any running service, click the Restart service button.
To add a new service to your machine, click the Add service button.
To delete any running or stopped service, click the Delete service button.
Thus, you can monitor the unwanted services running on the machine using the Windows Service Manager.
Close the Service Manager window.
You can also use other Windows service monitoring tools such as Advanced Windows Service Manager (https://securityxploded.com), Process Hacker (https://processhacker.sourceforge.io), Netwrix Service Monitor (https://www.netwrix.com), or AnVir Task Manager (https://www.anvir.com) to perform Windows services monitoring.
Task 5: Perform Startup Program Monitoring using Autoruns for Windows and WinPatrol
Startup programs are applications or processes that start when your system boots up. Attackers make many malicious programs such as Trojans and worms in such a way that they are executed during startup, and the user is unaware of the malicious program running in the background.
An ethical hacker or penetration tester must identify the applications or processes that start when a system boots up and remove any unwanted or malicious programs that can breach privacy or affect a system’s health. Therefore, scanning for suspicious startup programs manually or using startup program monitoring tools like Autoruns for Windows and WinPatrol is essential for detecting malware.
Autoruns for Windows This utility can auto-start the location of any startup monitor, display which programs are configured to run during system bootup or login, and show the entries in the order Windows processes them. As soon as this program is included in the startup folder, Run, RunOnce, and other Registry keys, users can configure Autoruns to show other locations, including Explorer shell extensions, toolbars, browser helper objects, Winlogon notifications, and auto-start services. Autoruns’ Hide Signed Microsoft Entries option helps the user zoom in on third-party auto-starting images that add to the users’ system, and it has support for looking at the auto-starting images configured for other accounts configured on the system.
WinPatrol WinPatrol provides the user with 14 different tabs to help in monitoring the system and its files. This security utility gives the user a chance to look for programs that are running in the background of a system so that the user can take a closer look and control the execution of legitimate and malicious programs.
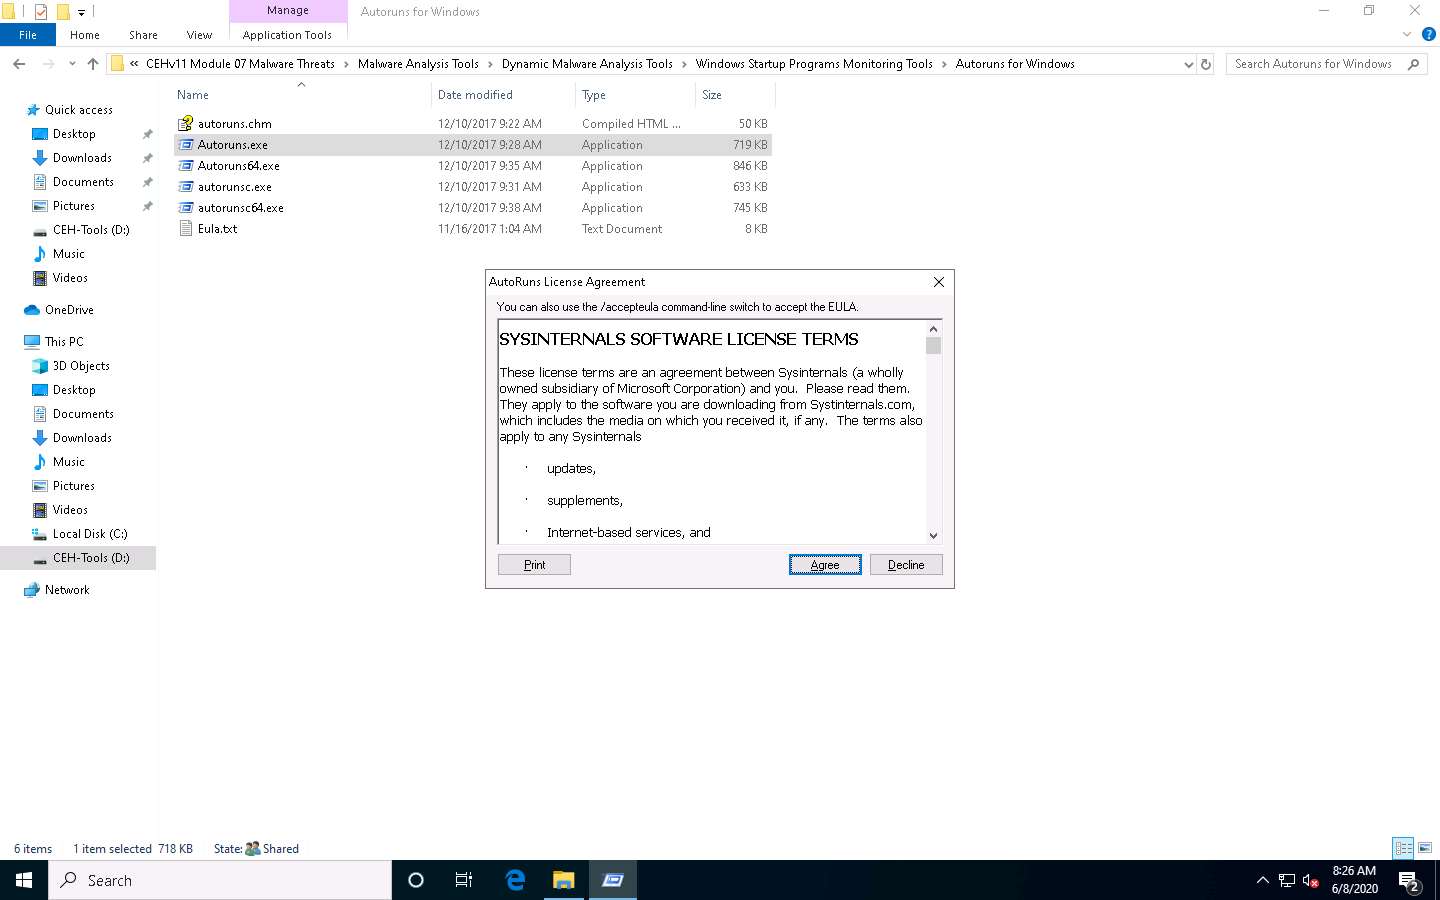
On the Windows 10 machine, navigate to D:\CEH-Tools\CEHv11 Module 07 Malware Threats\Malware Analysis Tools\Dynamic Malware Analysis Tools\Windows Startup Programs Monitoring Tools\Autoruns for Windows and double-click Autoruns.exe.
The AutoRuns License Agreement window appears; click Agree.
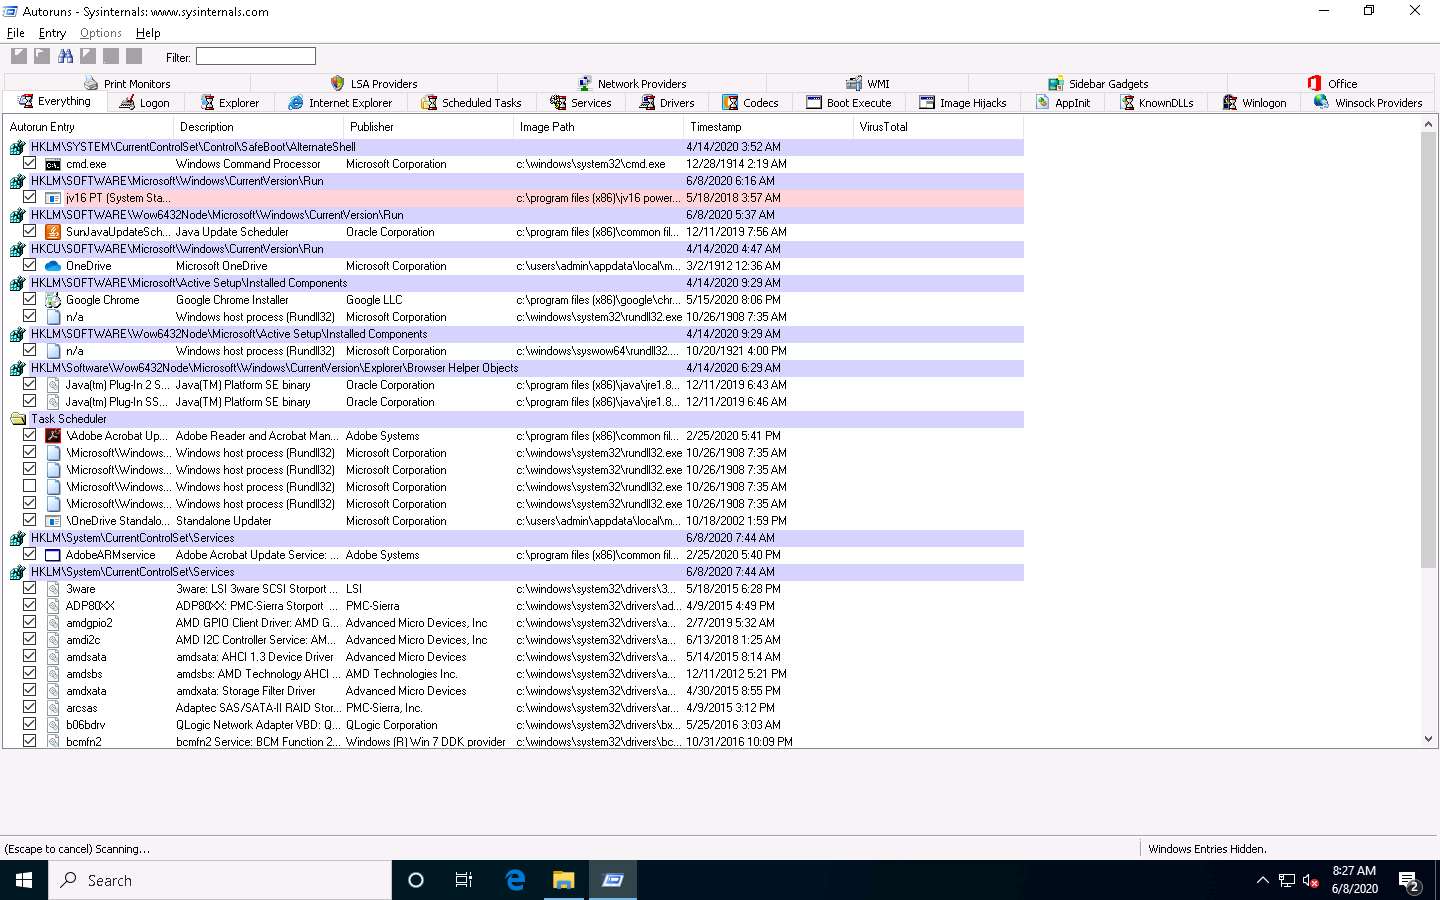
The Autoruns main window appears. It displays all processes, dll’s, and services, as shown in the screenshot.
The application lists displayed under all the tabs may vary in your lab environment.
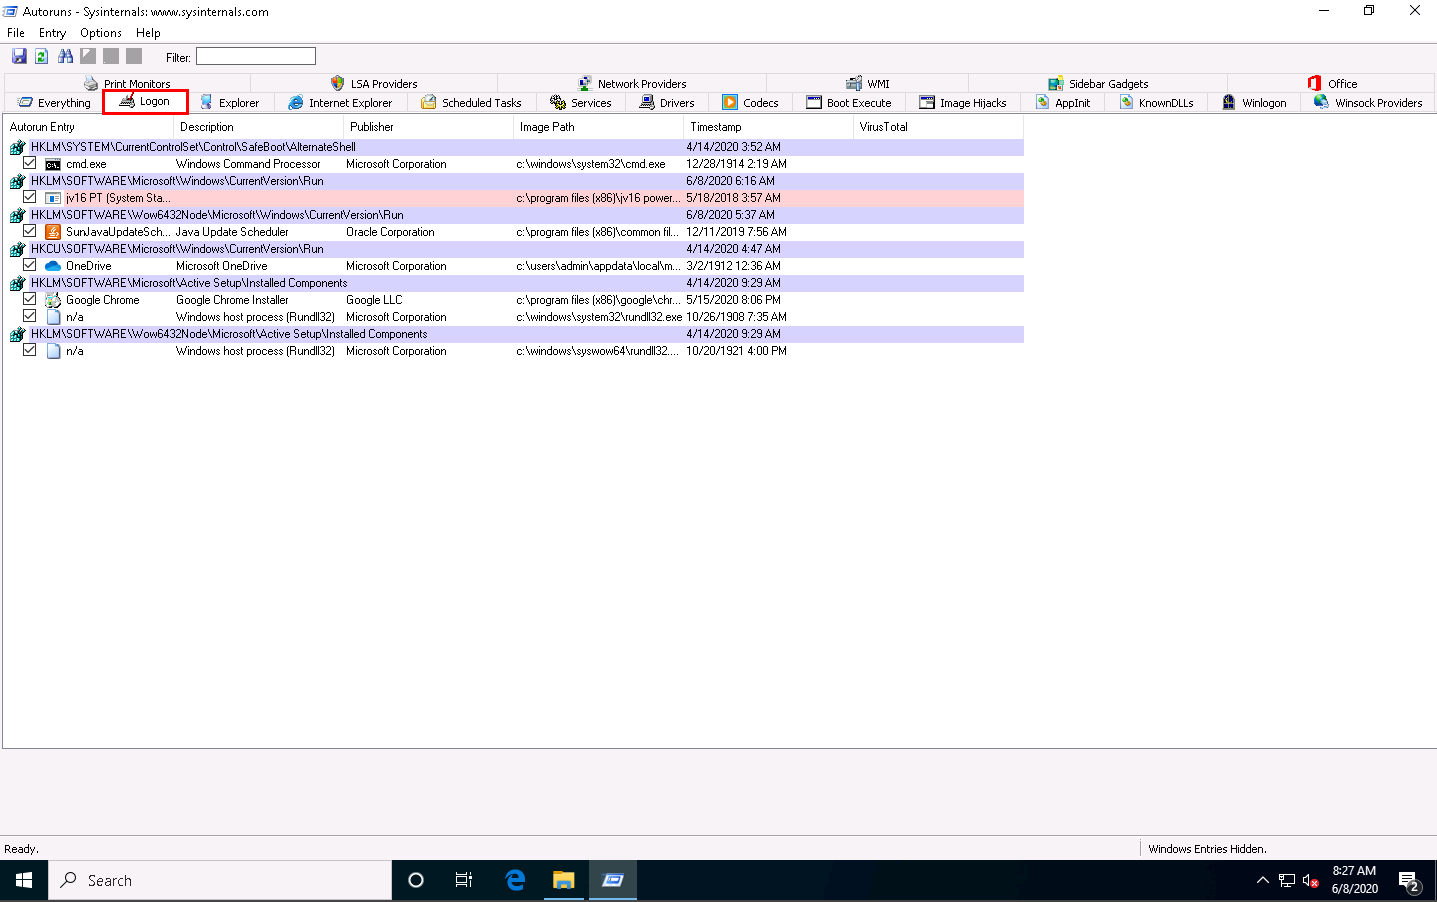
Click the Logon tab to view the applications that run automatically during login.
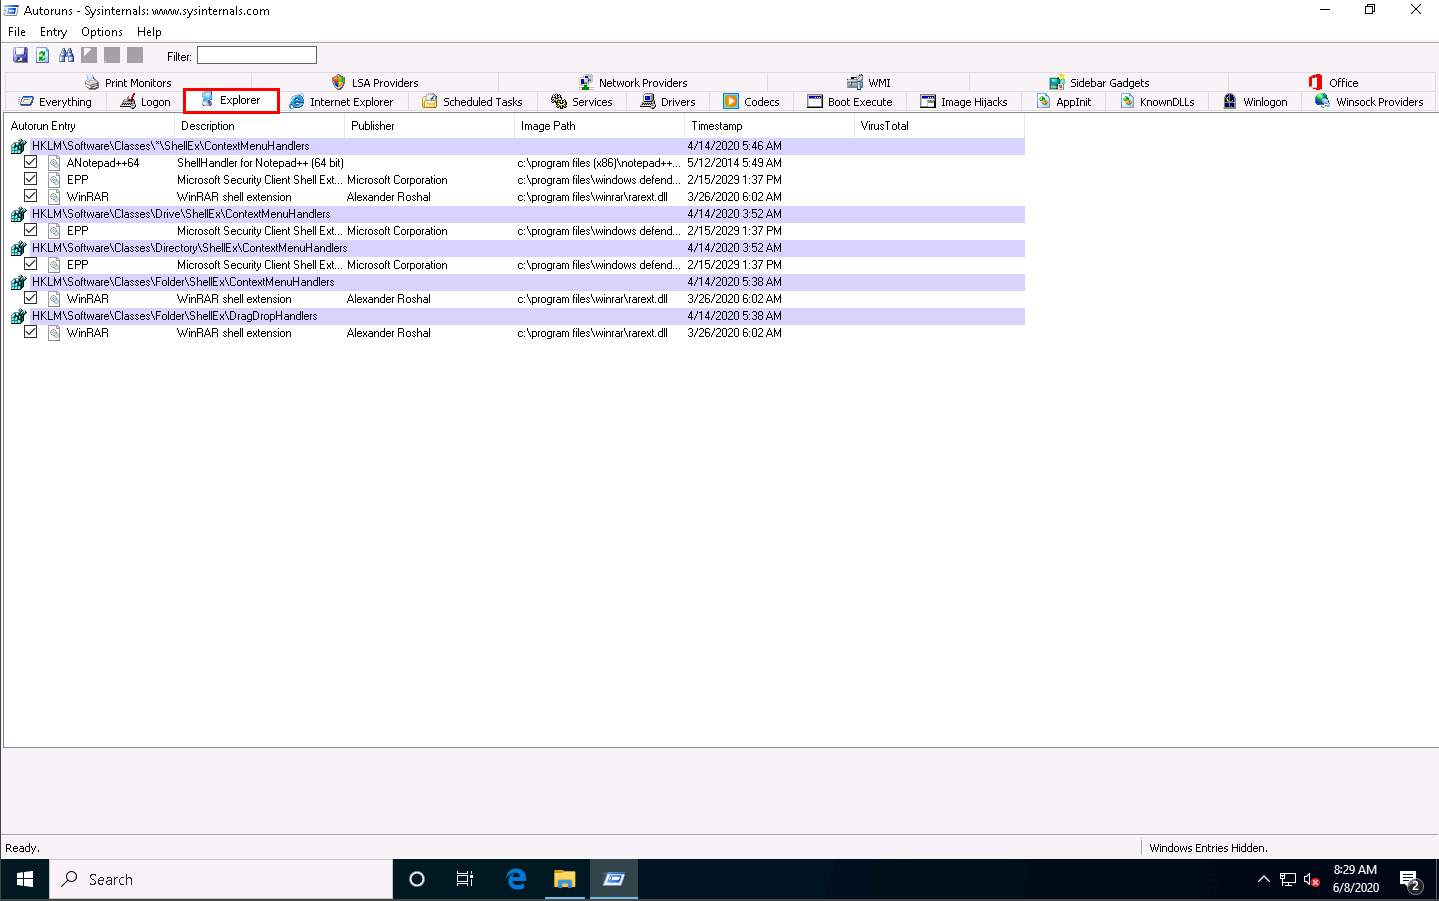
Click the Explorer tab to view the explorer applications that run automatically at system startup.
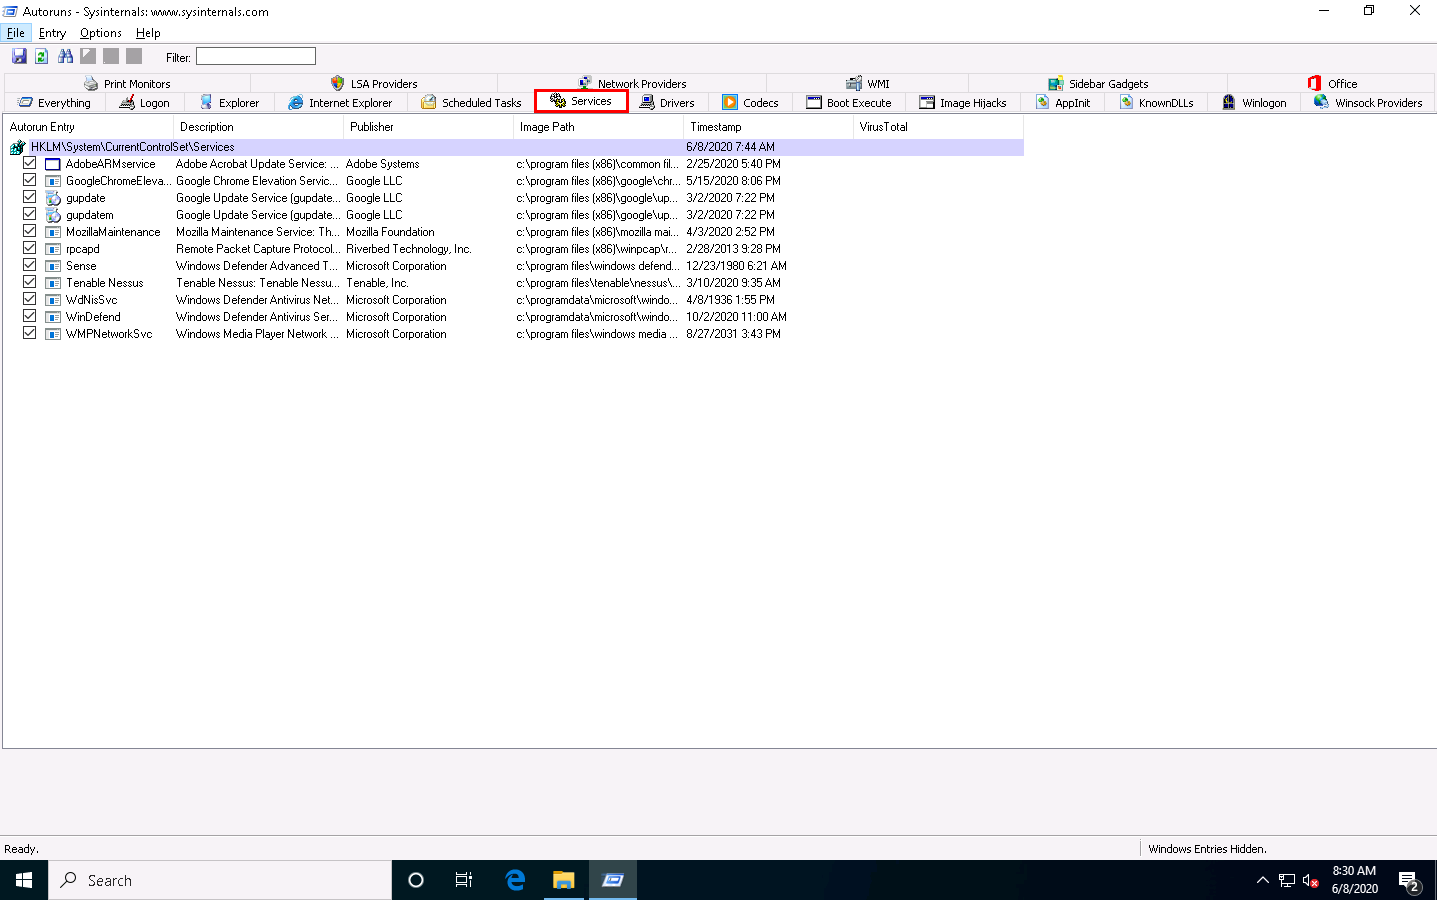
Clicking the Services tab displays all services that run automatically at system startup.
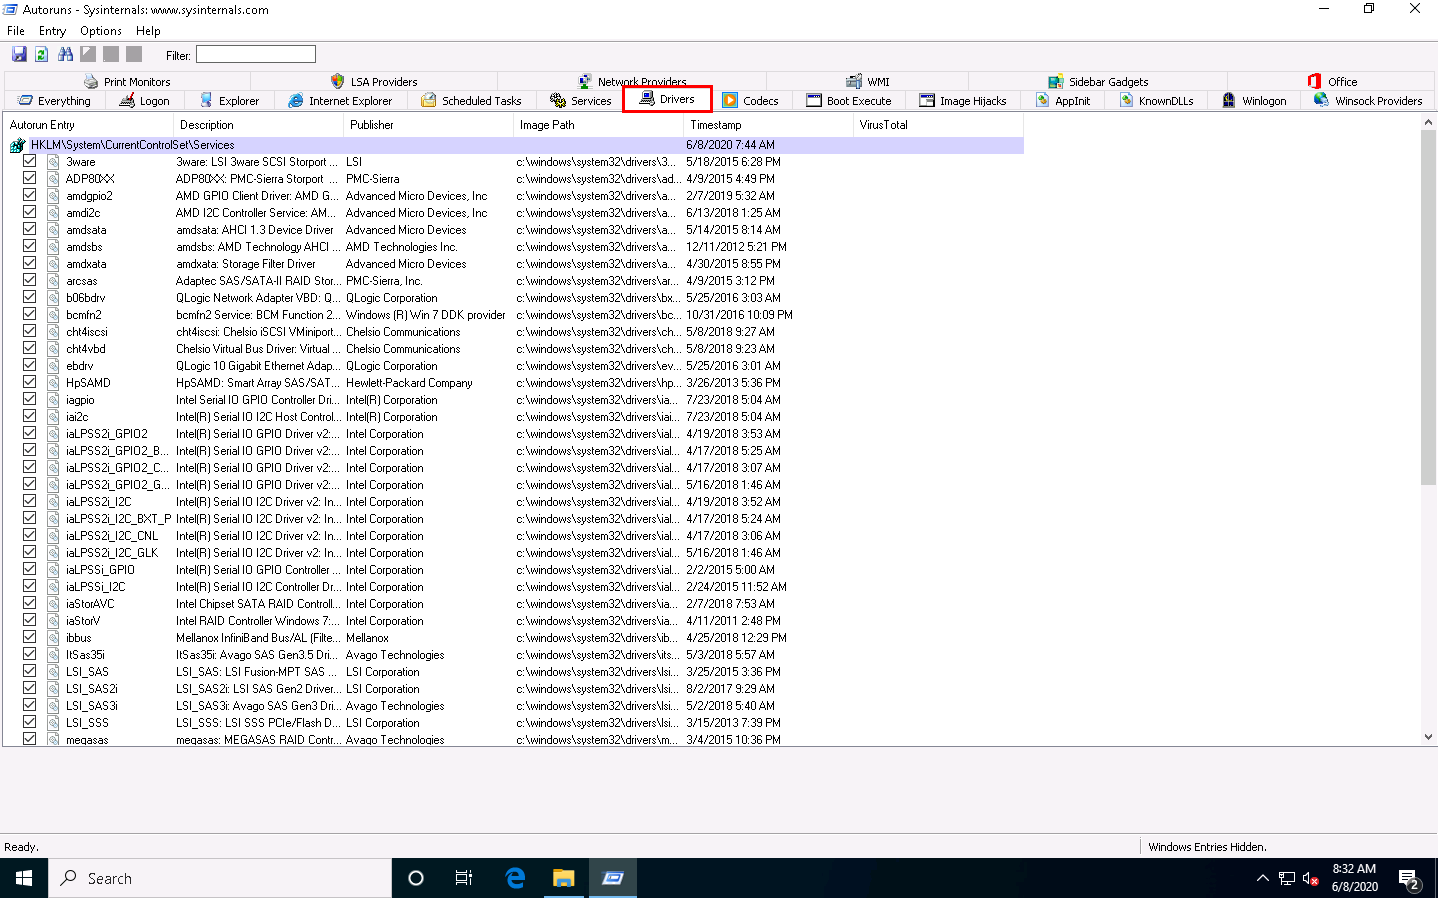
Click the Drivers tab to view all application drivers that run automatically at system startup.
Click any driver to display its size, version, and the time at which it was automatically run at system startup (for the first time).
The list displayed under this tab may vary in your lab environment.
Click the KnownDLLs tab to view all known DLLs that start automatically at system startup.
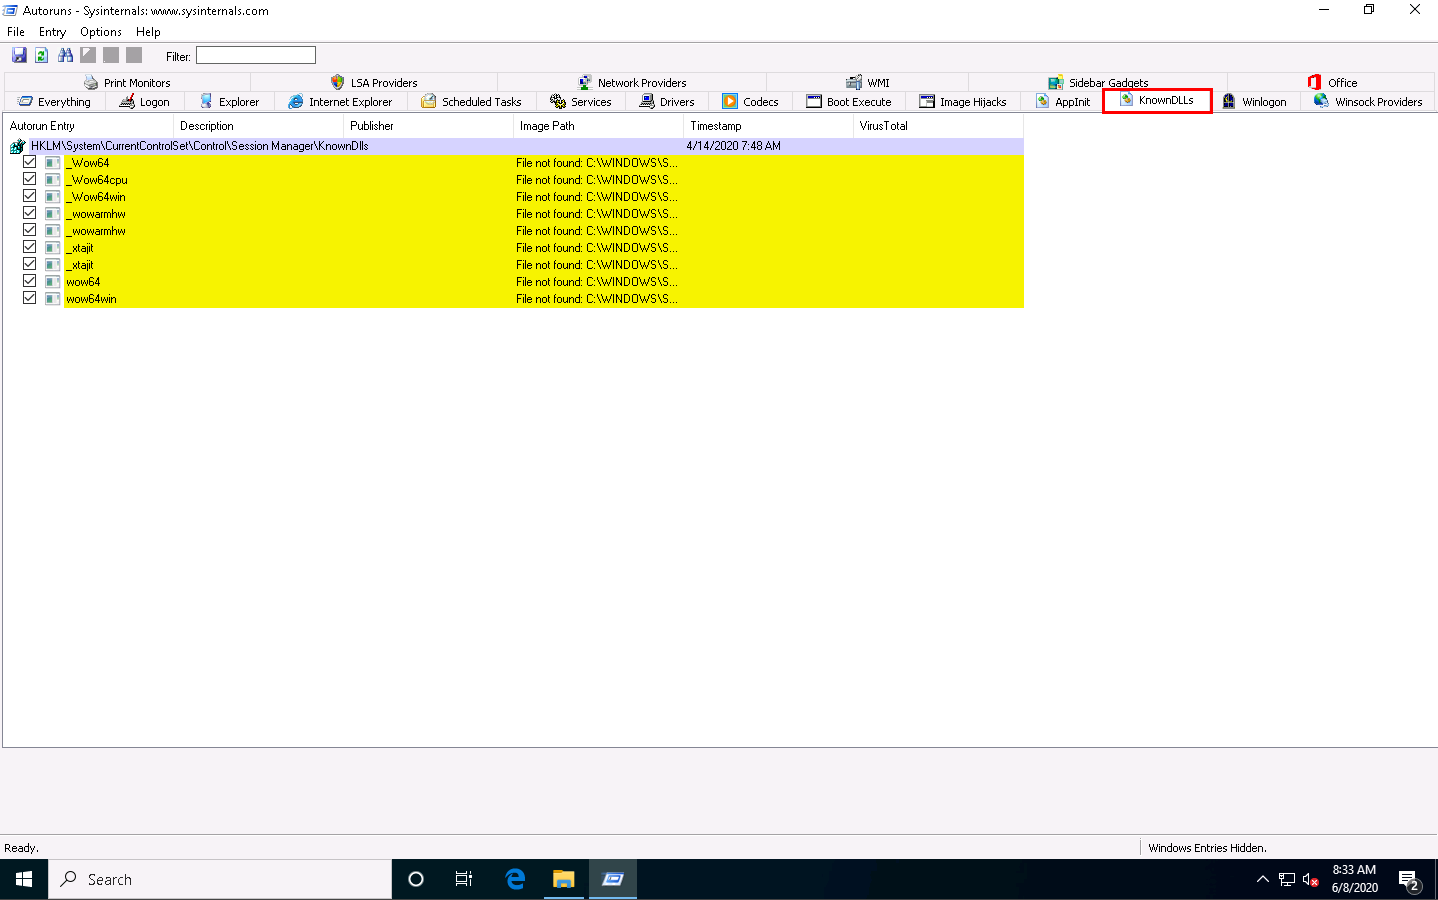
By examining all these tabs, you can find any unwanted processes or applications running on the machine when the system boots up and stop or delete them manually.
Close the Autoruns main window.
Now, we will find out which applications or processes start when the system boots up using the WinPatrol tool.
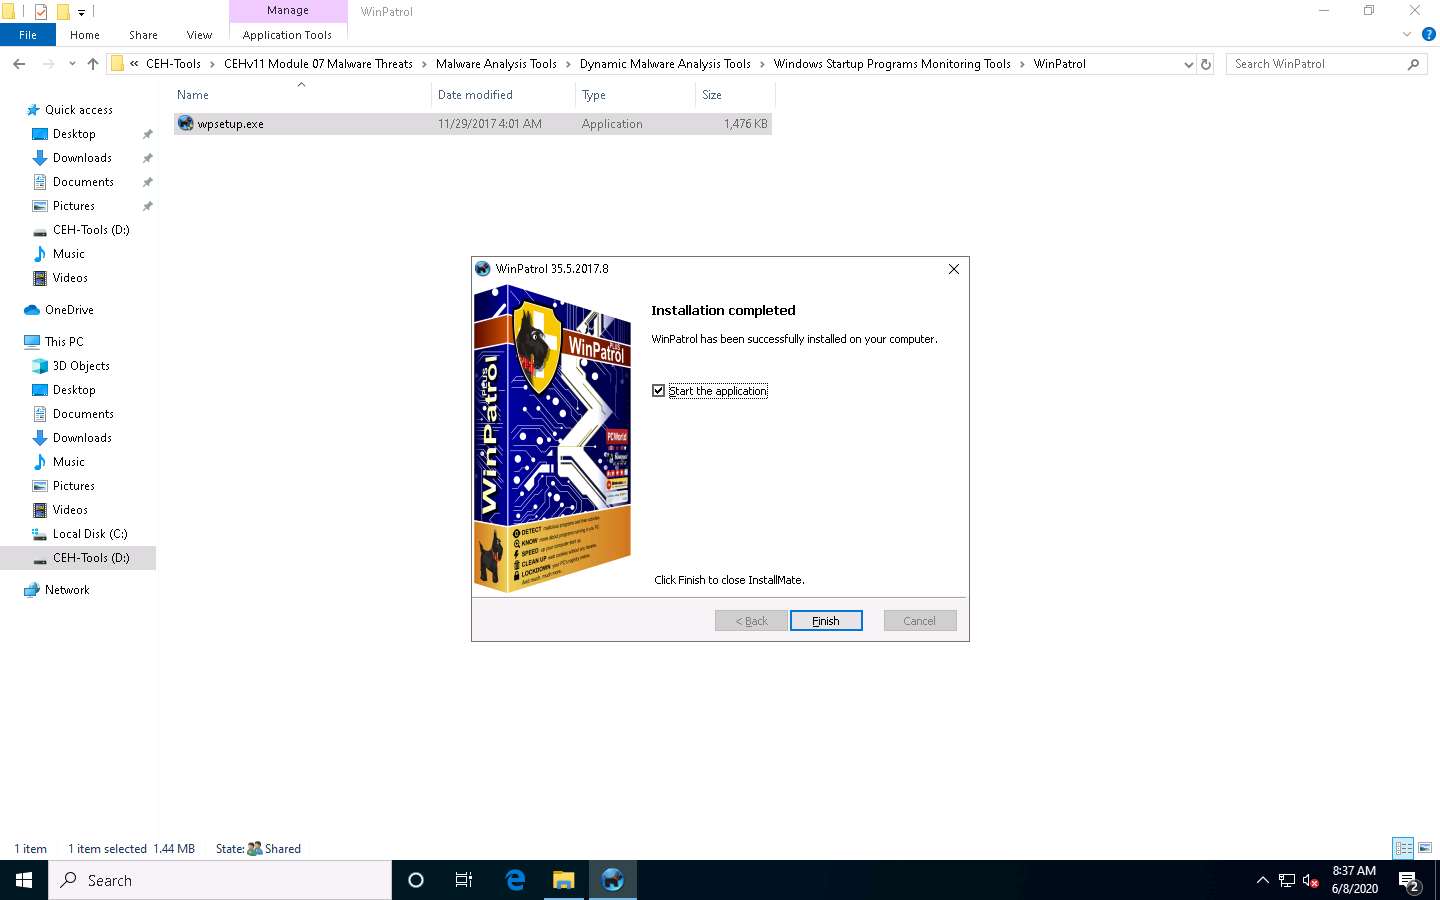
On the Windows 10 machine, navigate to D:\CEH-Tools\CEHv11 Module 07 Malware Threats\Malware Analysis Tools\Dynamic Malware Analysis Tools\Windows Startup Programs Monitoring Tools\WinPatrol. Double-click wpsetup.exe to launch the setup.
If a User Account Control window appears, click Yes.
Follow the wizard-driven installation steps to install WinPatrol.
In the Installation completed wizard, make sure that the Start the application options is checked, and then click Finish. This will automatically launch the application.
The WinPartol application window appears with the PLUS tab open by default. Click the Startup Programs tab.
Select any program that affects your system bootup (here, OneDrive) and click Disable, as shown in the screenshot.
The screenshot may differ from the image on the screen in your lab environment
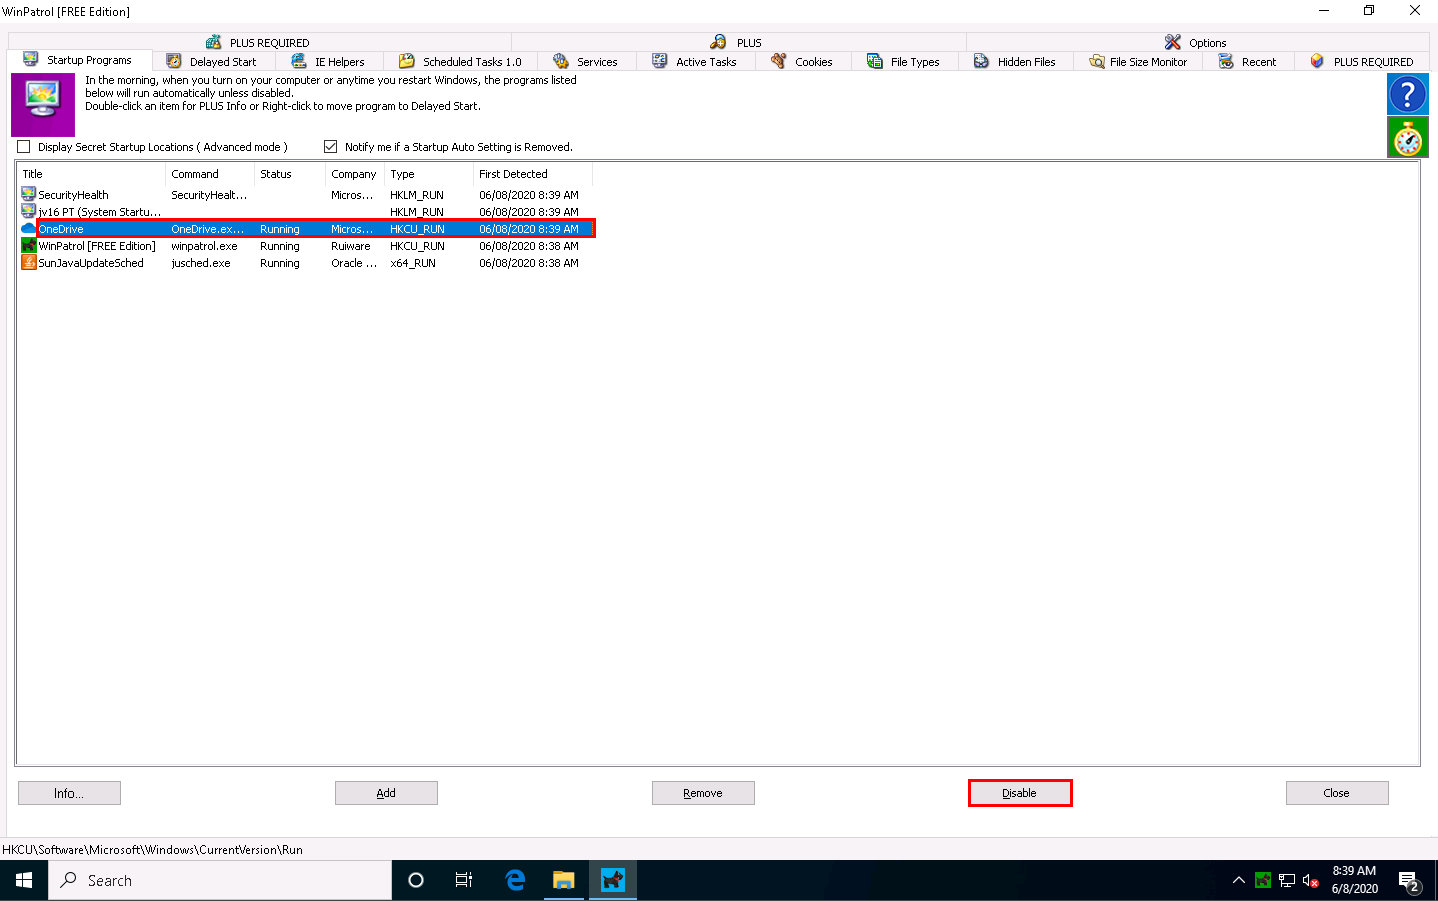
A popup appears, as shown in the screenshot. Click Yes to proceed.
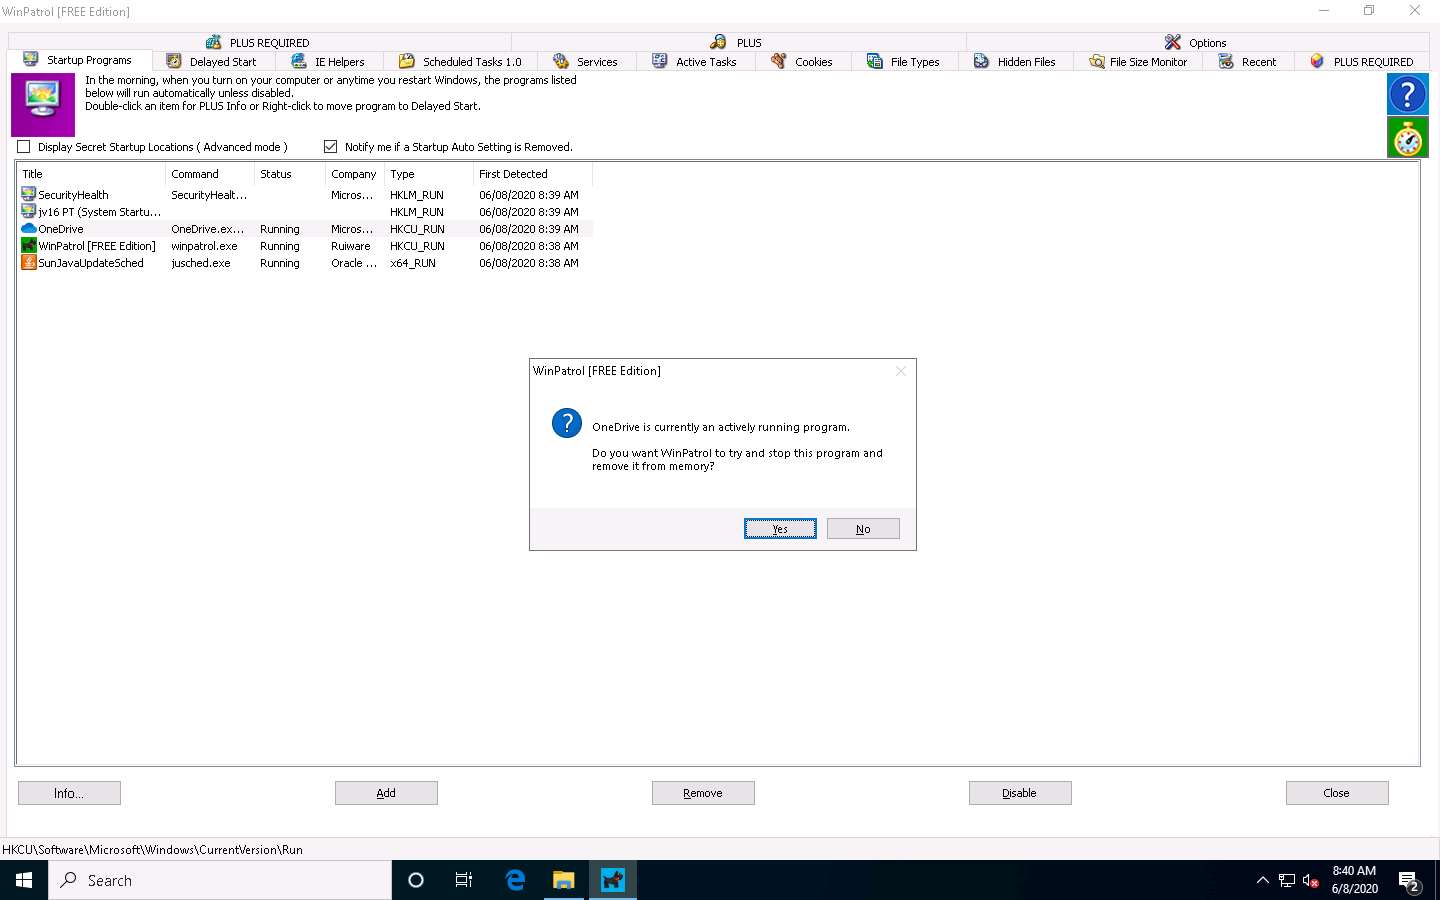
The OneDrive program will be deleted from the Startup Programs list. This is how to manage the Startup Programs for a Windows machine.
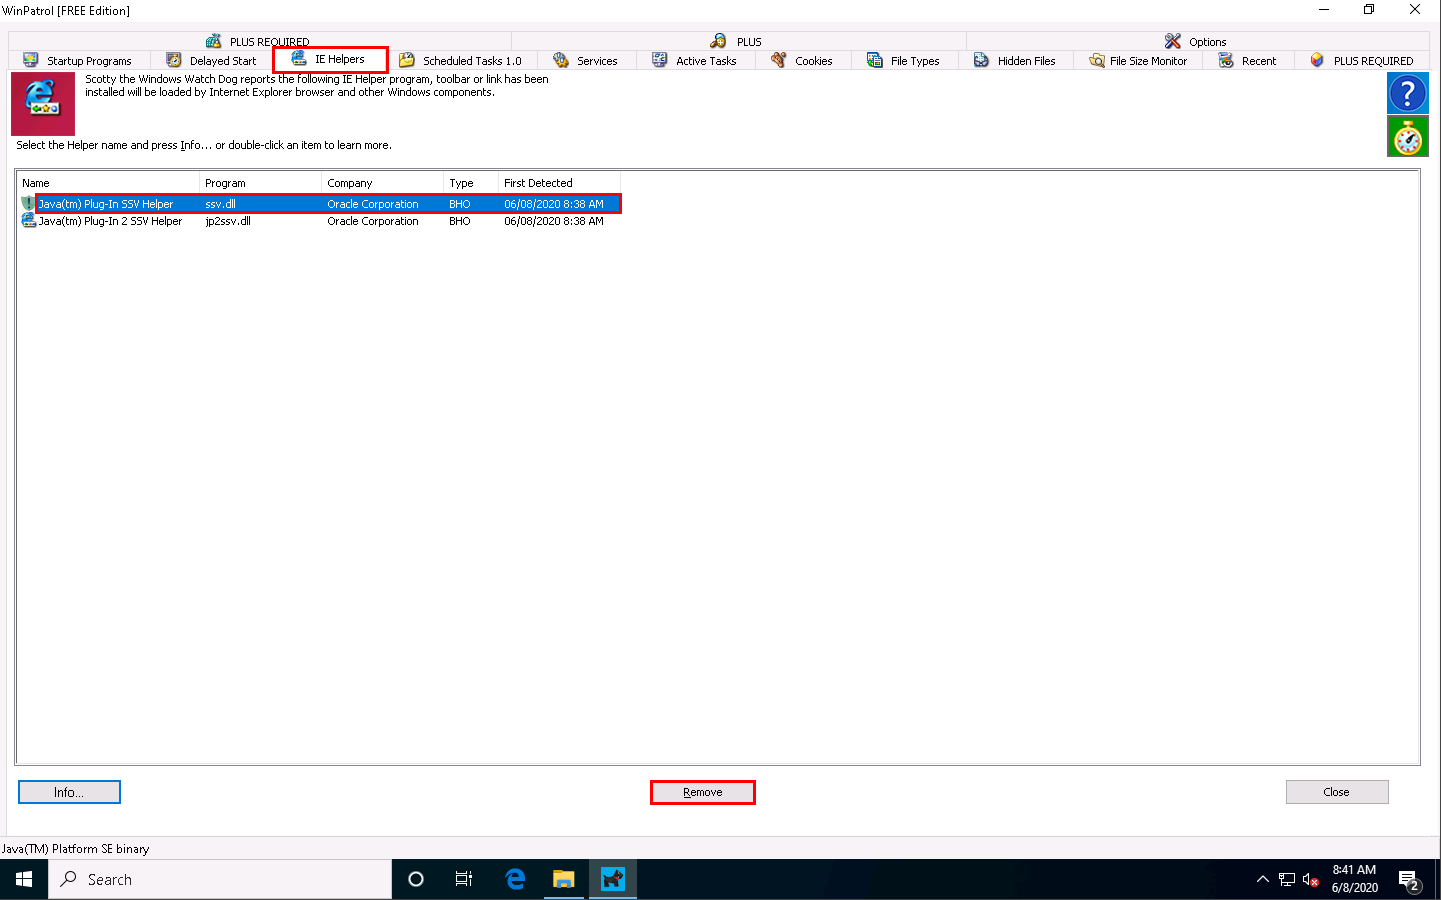
Now, switch to the IE Helpers tab. It shows all toolbars and links loaded by IE or other windows component. Select duplicate or non-required programs (here Java(tm) Plug-In SSV Helper), and then click Remove.
If a popup appears, as shown in the screenshot. Click Yes to proceed.
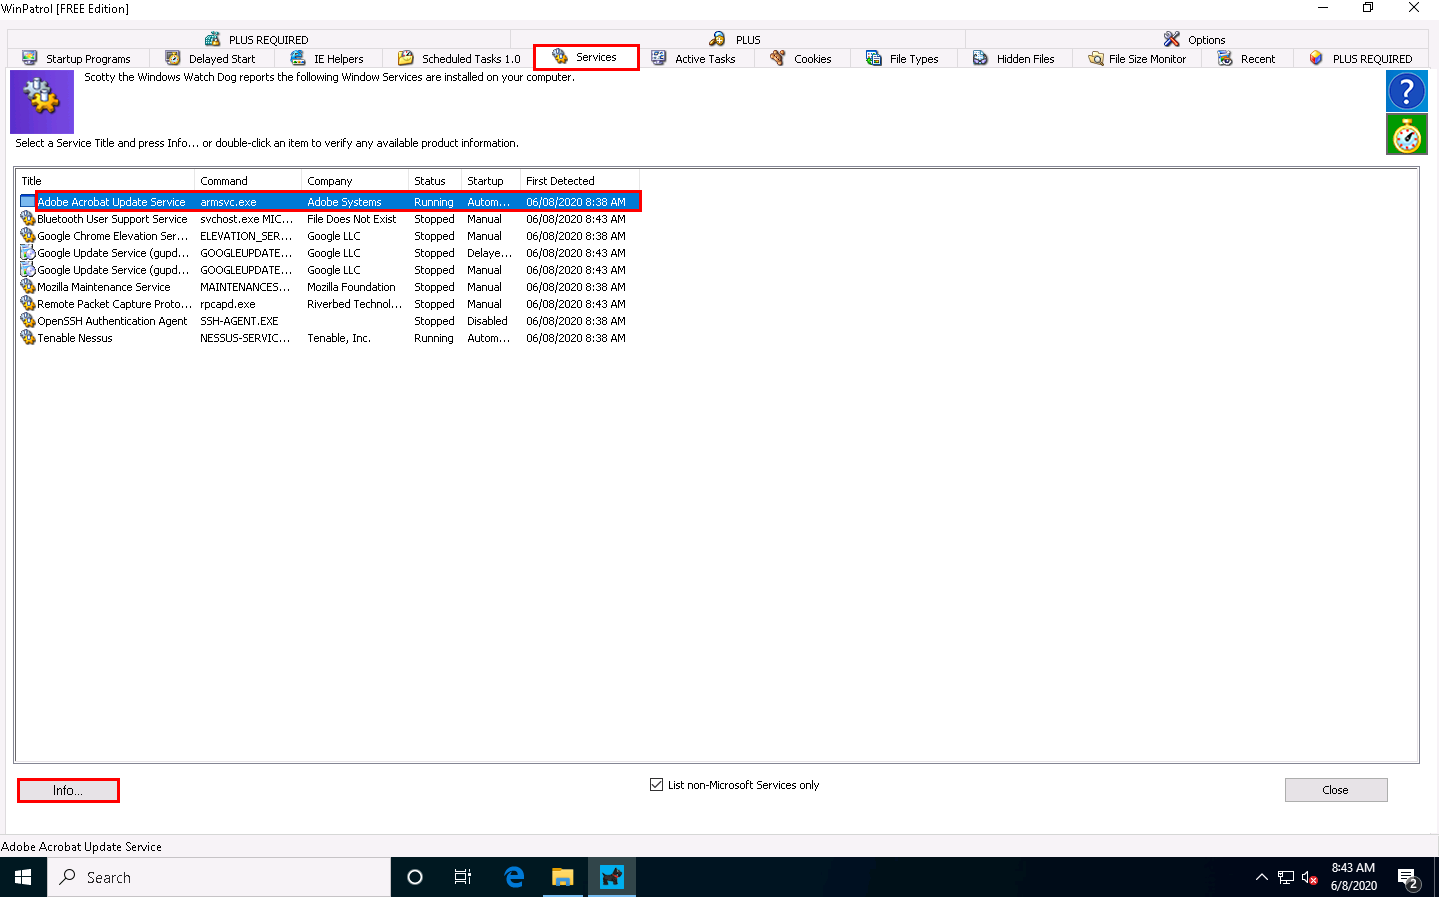
Switch to the Services tab to display the installed services on your system. Select any service and click Info…, as shown in the screenshot.
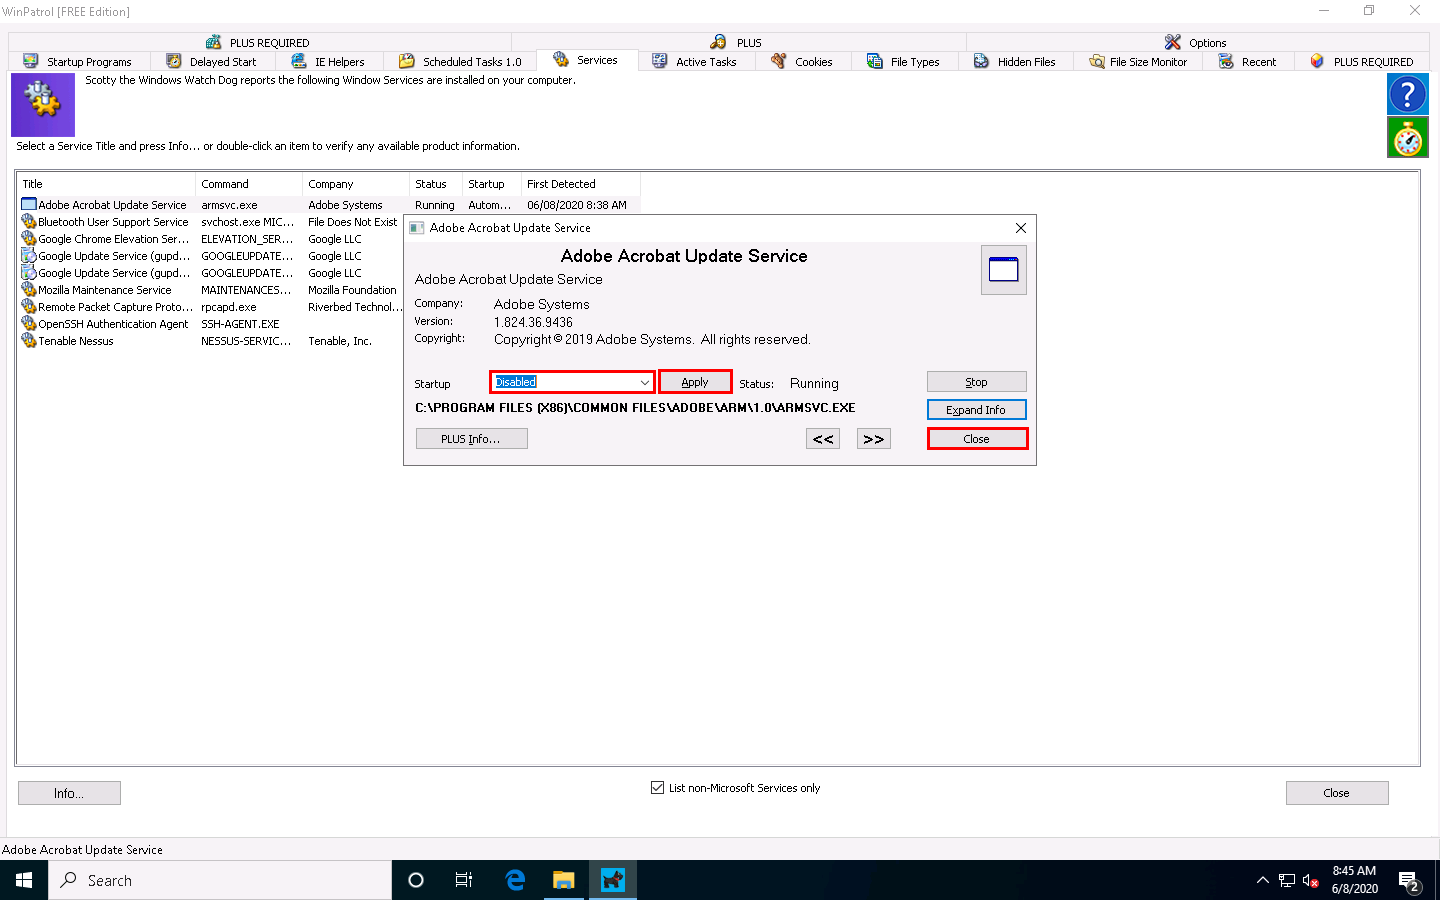
A window showing the service information appears. To disable a service, select Disabled from the drop-down list and click Apply, as shown in the screenshot. Click Close to exit the window.
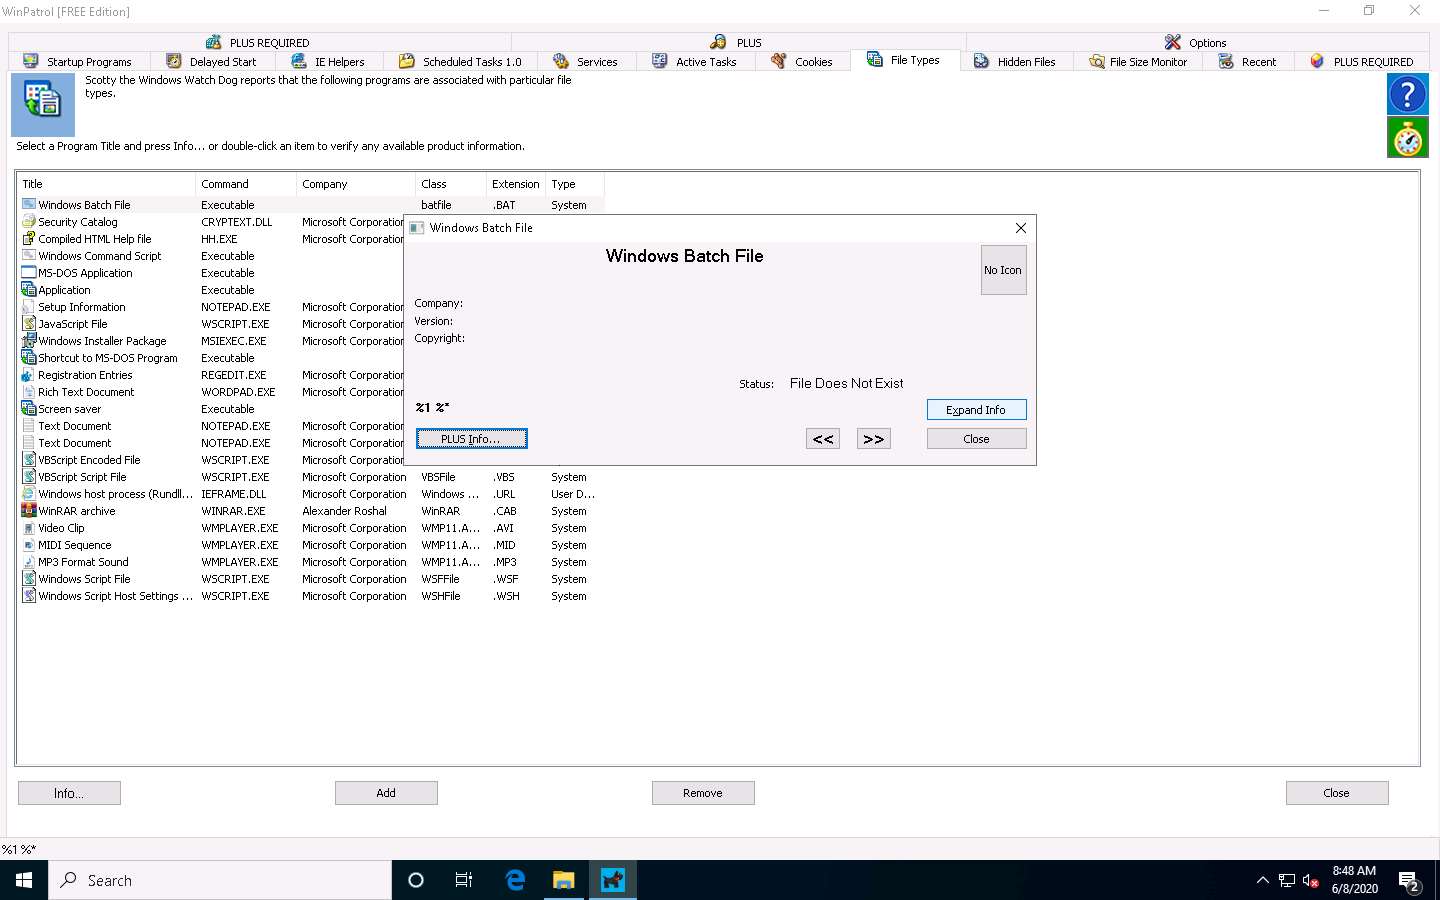
Switch to the File Types tab to view the programs associated with a file. Select a program and click Info… to view the available information.
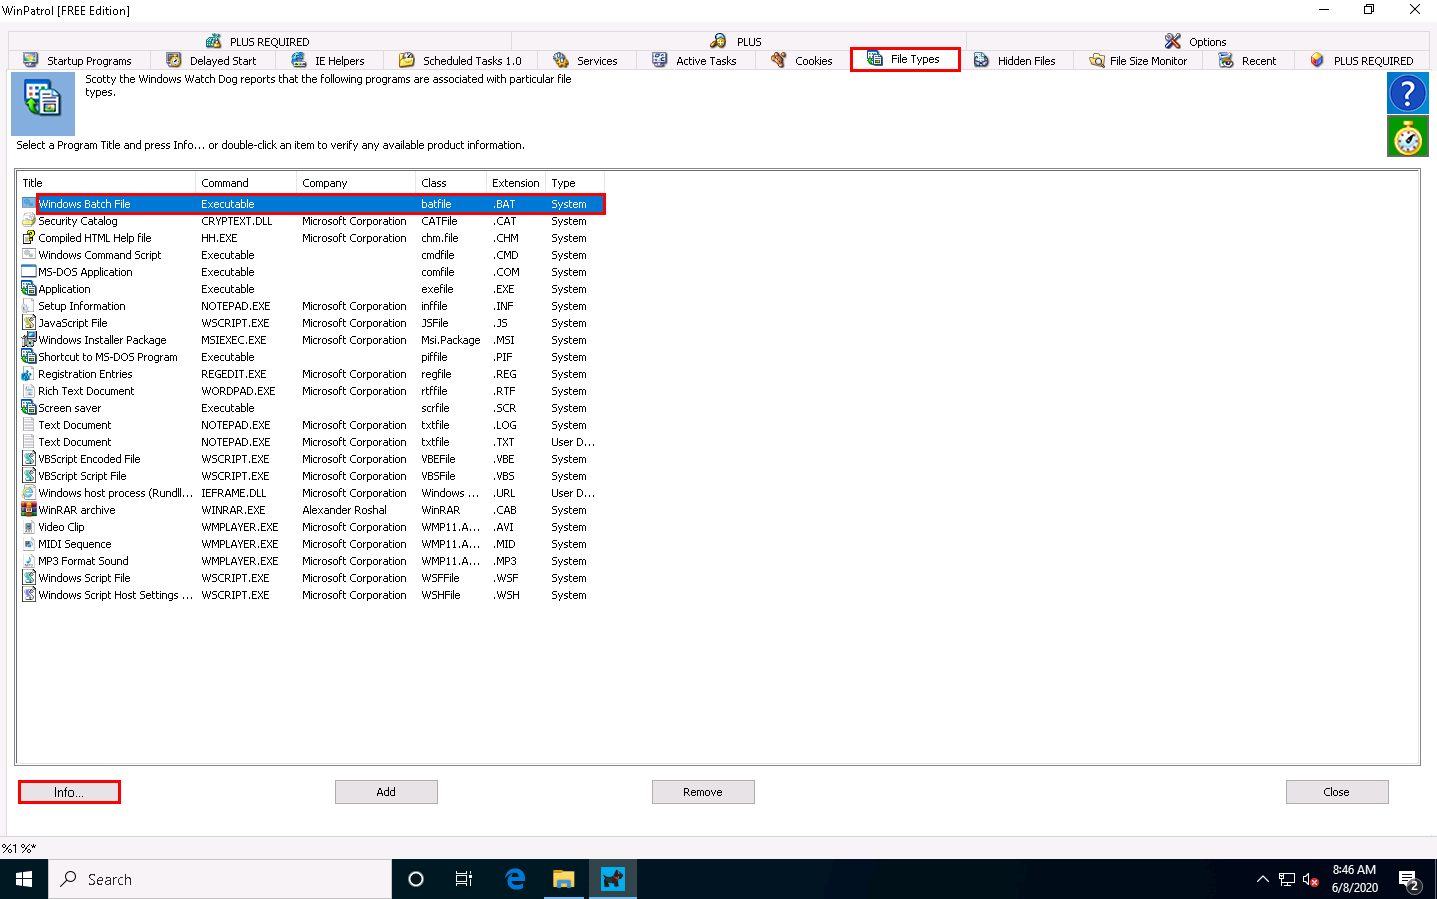
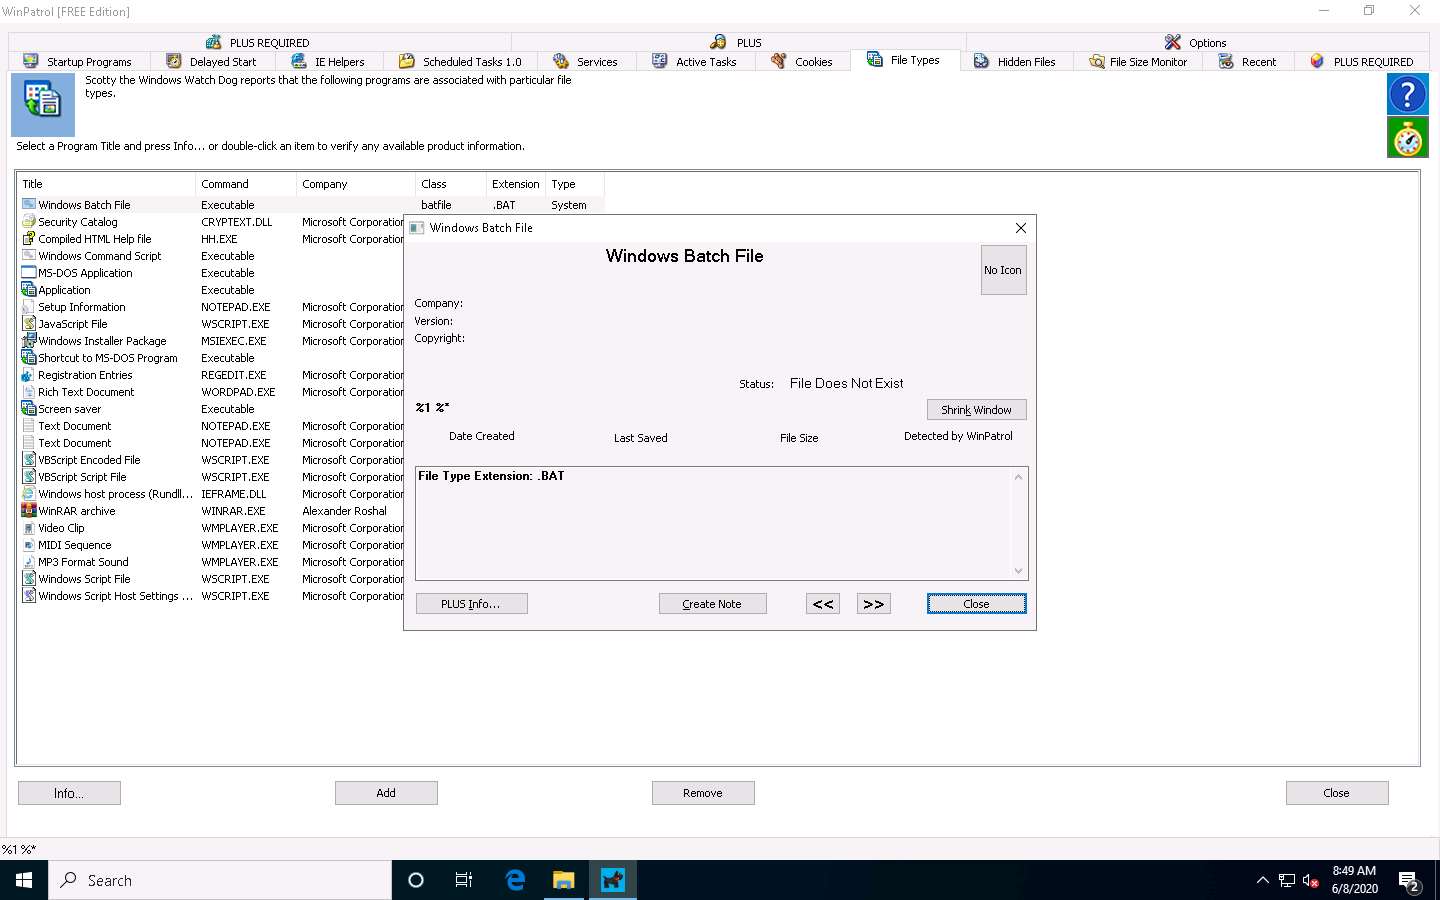
The Windows Batch File window appears, as shown in the screenshot. Click Expand Info to view the full info about the program.
The expanded view shows all information related to the program and its associated file, as demonstrated in the screenshot. Analyze the info and close the window.
Now, switch to the Active Tasks tab to view the current tasks running on your computer. Select any task and click Kill Task to end the task, as shown in the screenshot.
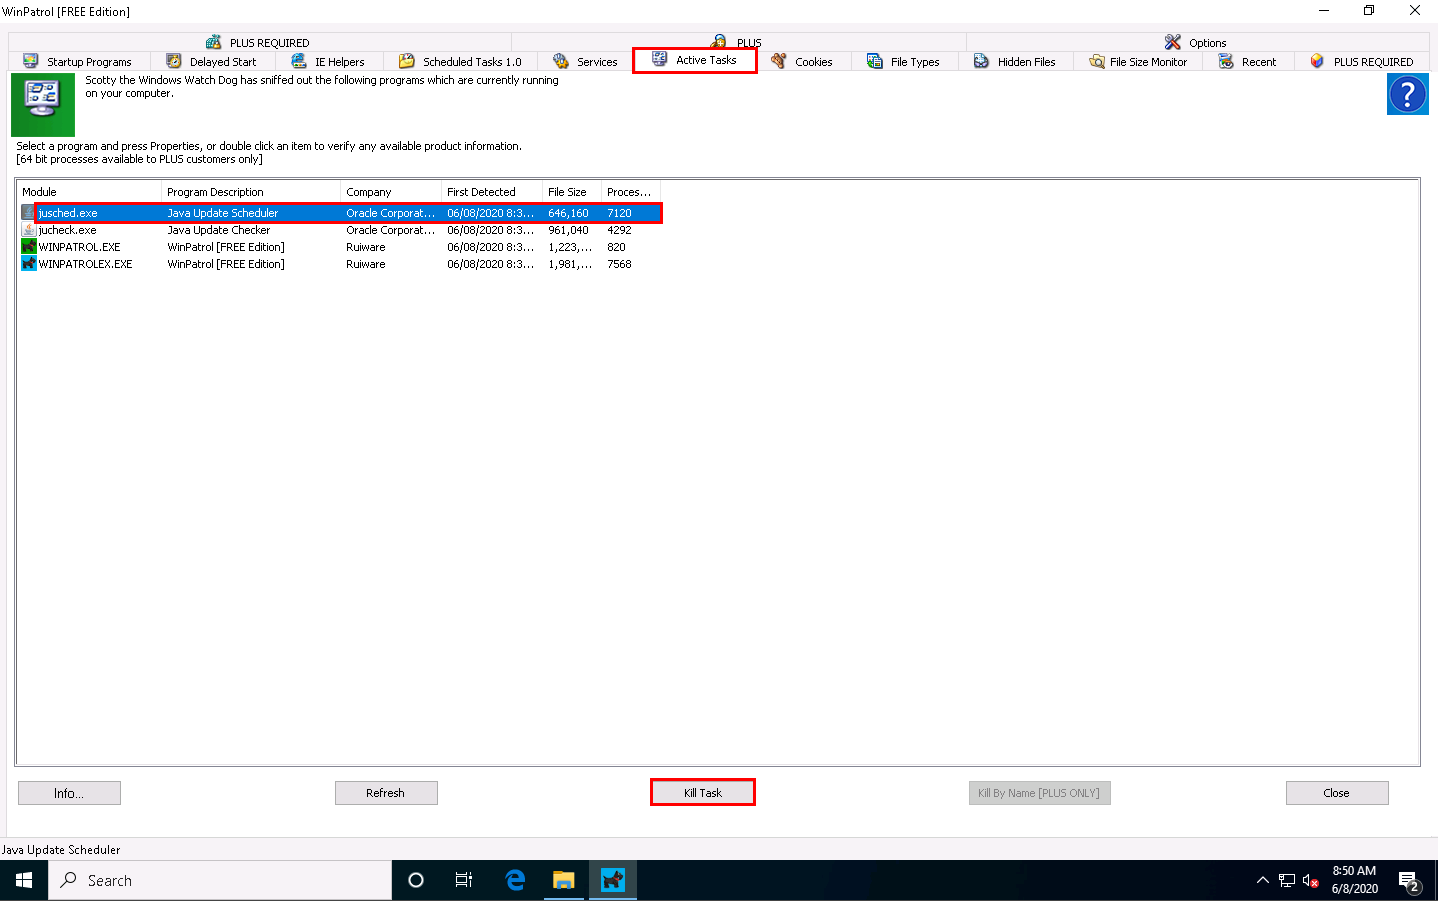
By examining all these tabs, you can find any unwanted process or application running on the machine when the system boots up and manually stop or delete them.
Close all open windows on the Windows 10 machine.
You can also use other Windows startup programs monitoring tools such as Autorun Organizer (https://www.chemtable.com), Quick Startup (https://www.glarysoft.com), StartEd Pro (http://www.outertech.com), or Chameleon Startup Manager (http://www.chameleon-managers.com) to perform startup programs monitoring.
Task 6: Perform Installation Monitoring using Mirekusoft Install Monitor
When the system or users install or uninstall any software application, there is a chance that it will leave traces of the application data on the system. Installation monitoring help to detect hidden and background installations that malware performs.
Mirekusoft Install Monitor automatically monitors what gets placed on your system and allows you to uninstall it completely. Install Monitor works by monitoring what resources such as file and registry, are created when a program is installed. It provides detailed information about the software installed, including how much disk space, CPU, and memory your programs are using. It also provides information about how often you use different programs. A program tree is a useful tool that can show you which programs were installed together.
Here, we will use the Mirekusoft Install Monitor tool to detect hidden and background installations.
On the Windows 10 machine, navigate to D:\CEH-Tools\CEHv11 Module 07 Malware Threats\Malware Analysis Tools\Dynamic Malware Analysis Tools\Installation Monitoring Tools\Mirekusoft Install Monitor and double-click SetupInstallMonitor.exe.
If Update Available wizard appears, click Update button.
If a User Account Control window appears, click Yes.
Follow the installation steps to install Mirekusoft Install Monitor.
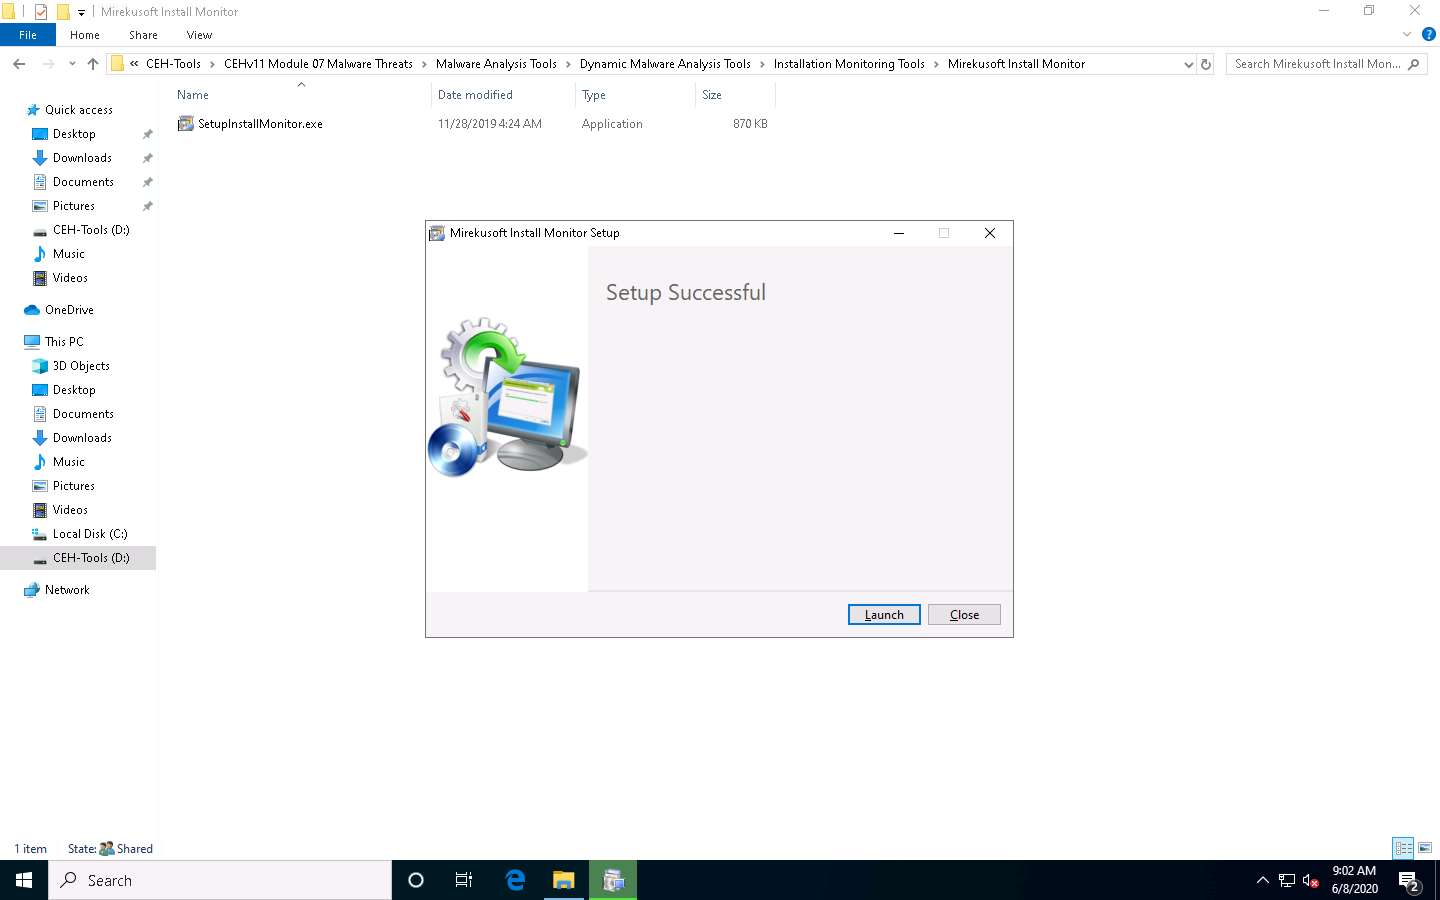
The Setup Successful wizard appears; click Launch.
If a User Account Control window appears, click Yes.
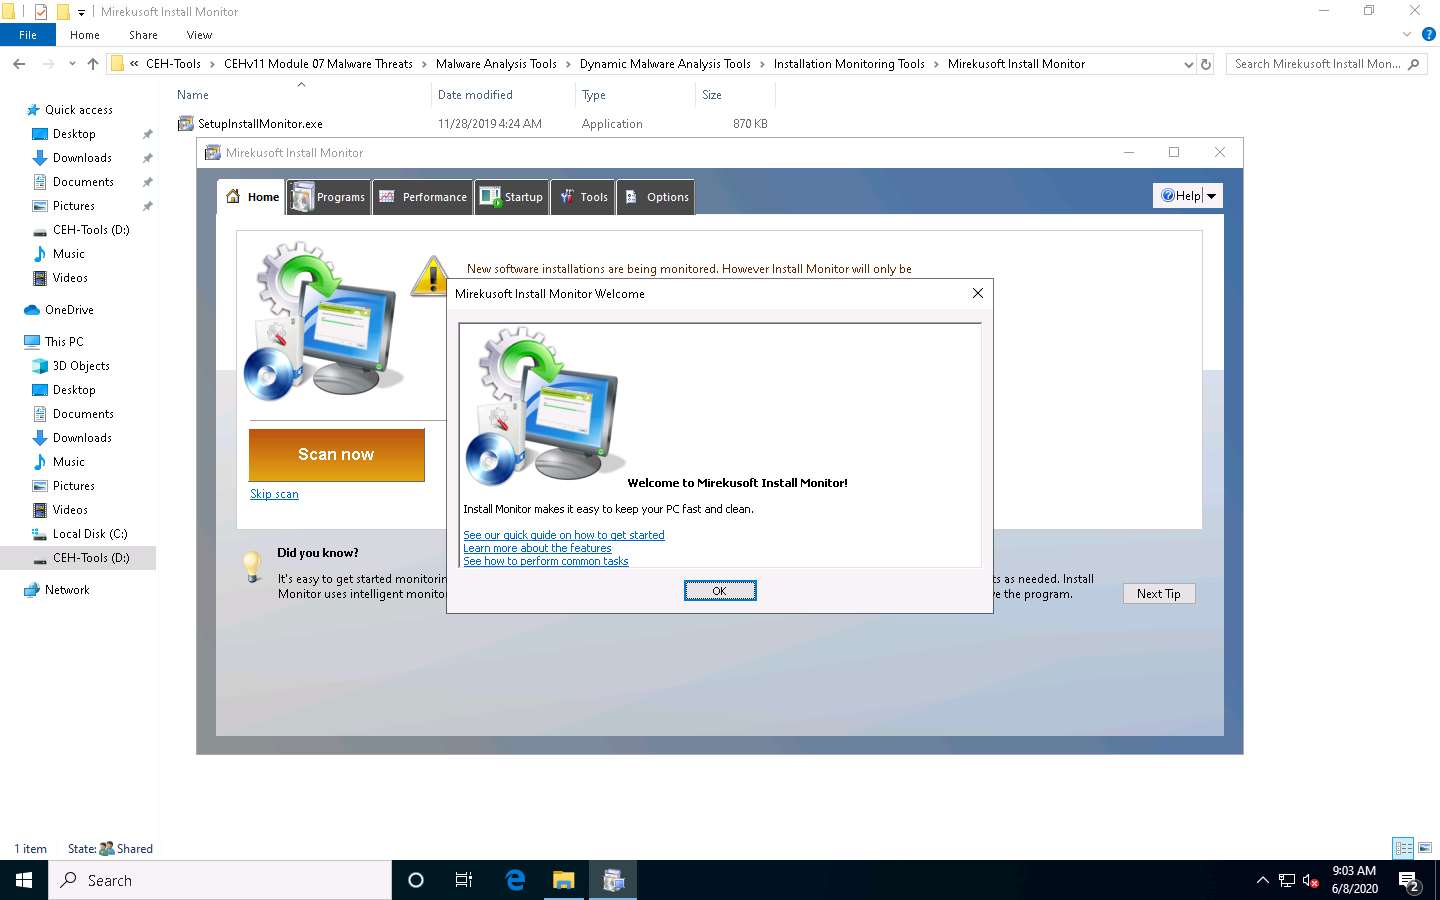
The Mirekusoft Install Monitor main window appears, along with a Welcome pop-up, click OK. Click Skip scan in the Home tab.
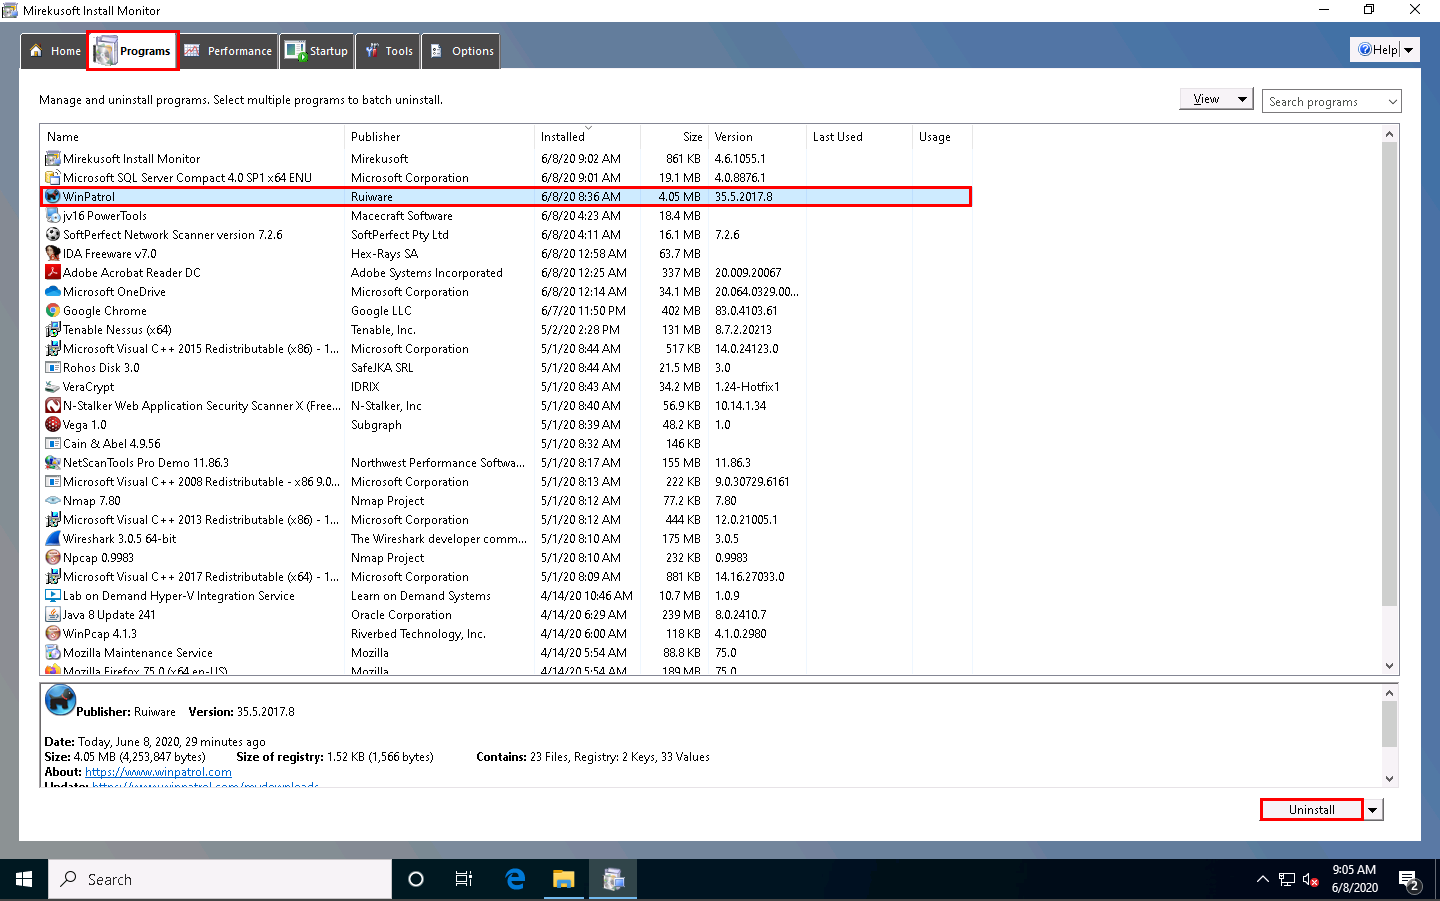
Click the Programs tab to view the programs installed on your machine. You can choose any unwanted or unused application and click Uninstall to remove it from your machine. In this task, we are choosing the WinPatrol application.
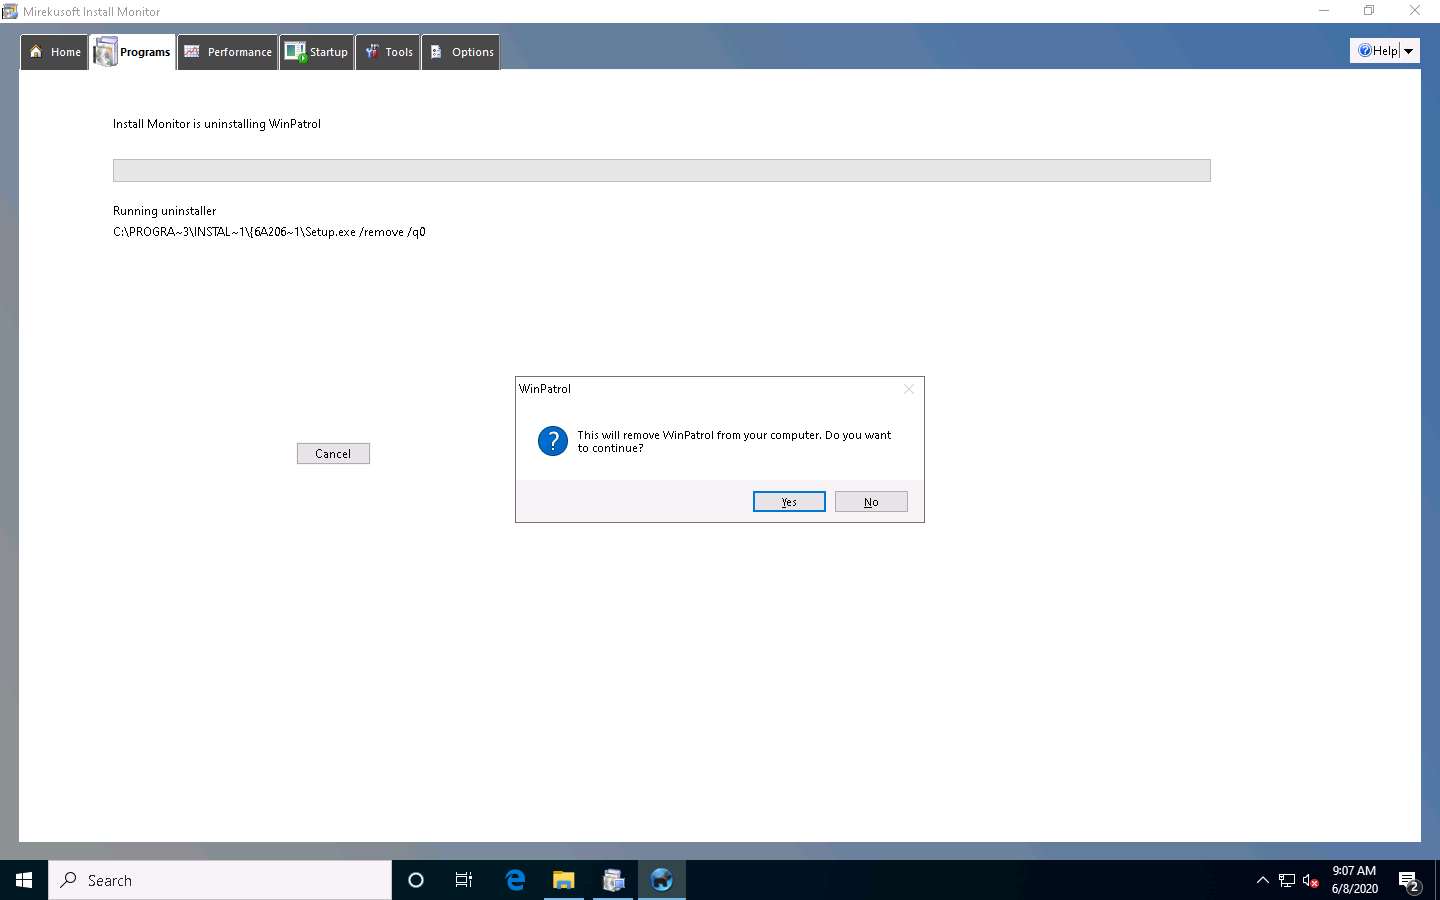
The WinPatrol pop-up appears; click Reject Change.
While uninstalling the application, a selected program pop-up appears, click Yes in all the WinPatrol pop-ups.
The selected application is uninstalled from your computer pop-up appears; click OK.

If a Cleanup for Selected Program window appears (here, WinPatrol), click OK.
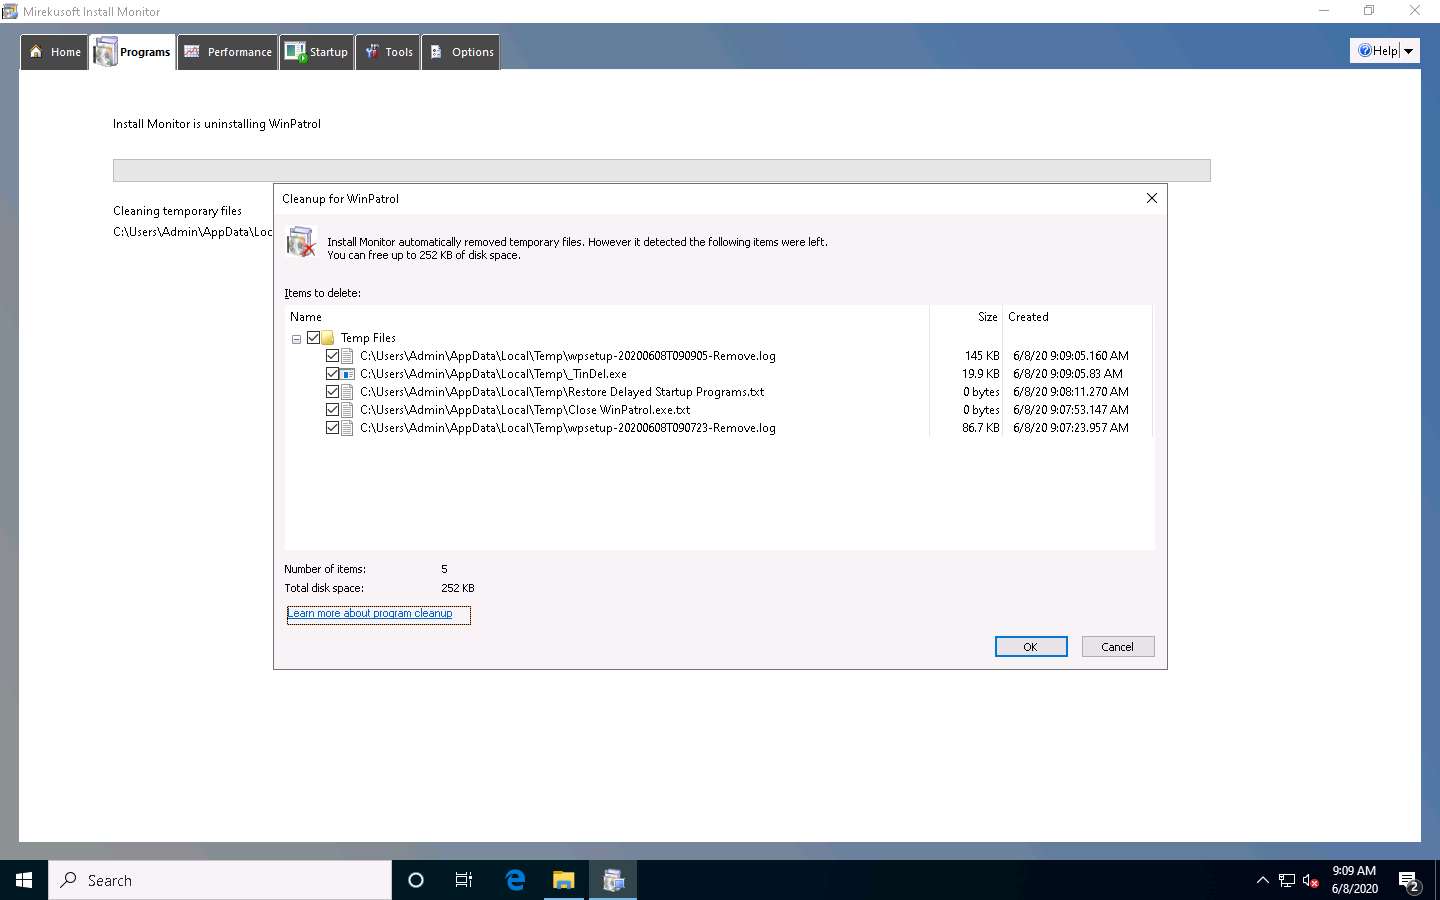
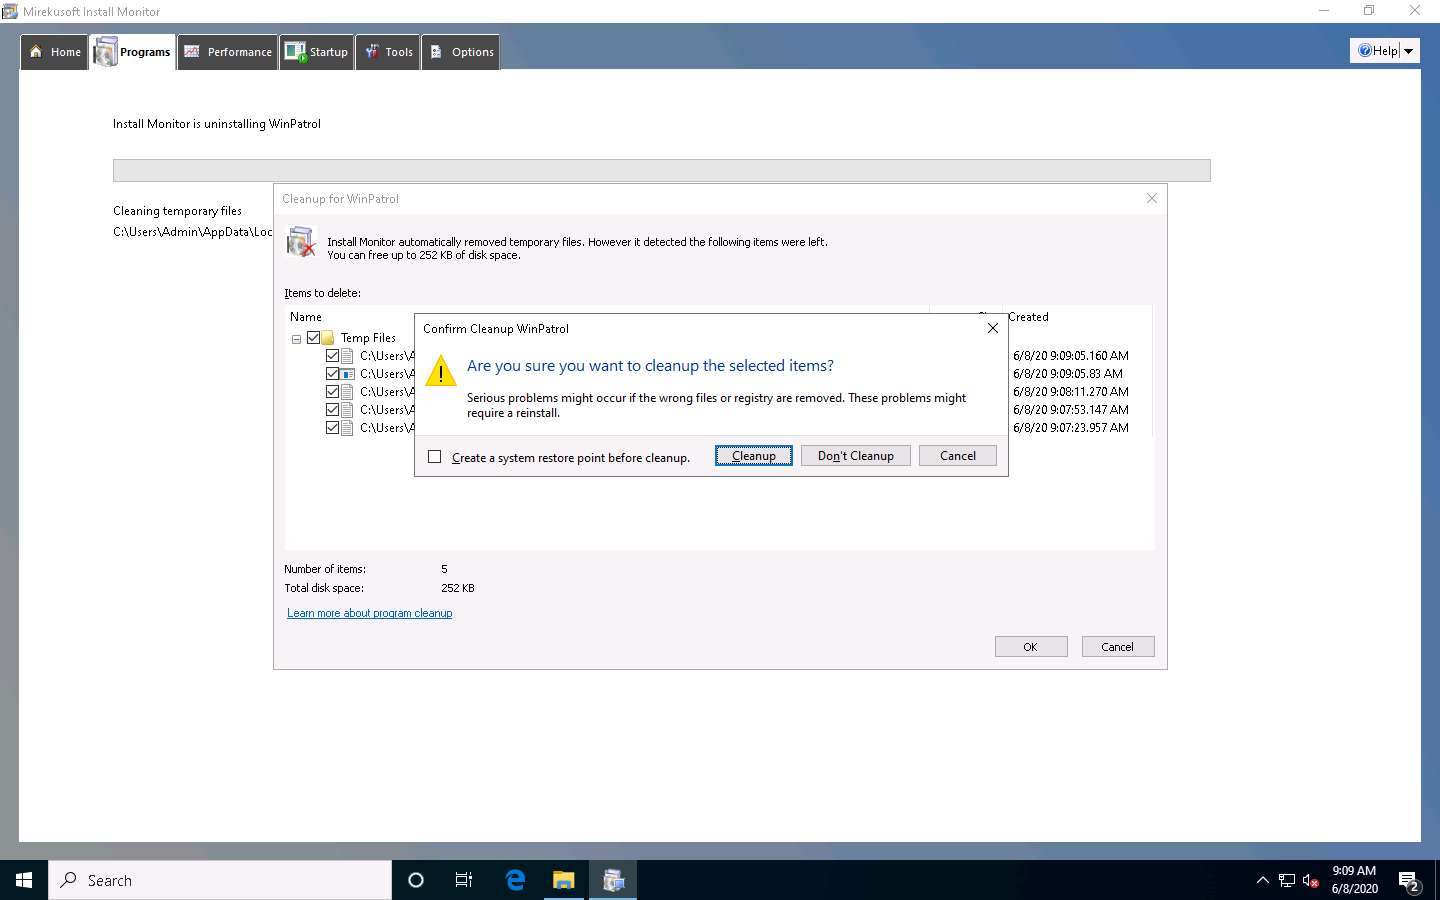
The Confirm Cleanup pop-up appears; click Cleanup. This will delete all the supported files for the related application that you have uninstalled from your computer.
The selected application is uninstalled from your computer. Click the Performance tab to view and terminate currently running programs.
Here, you can select any program from the list and click End Program to terminate the program.
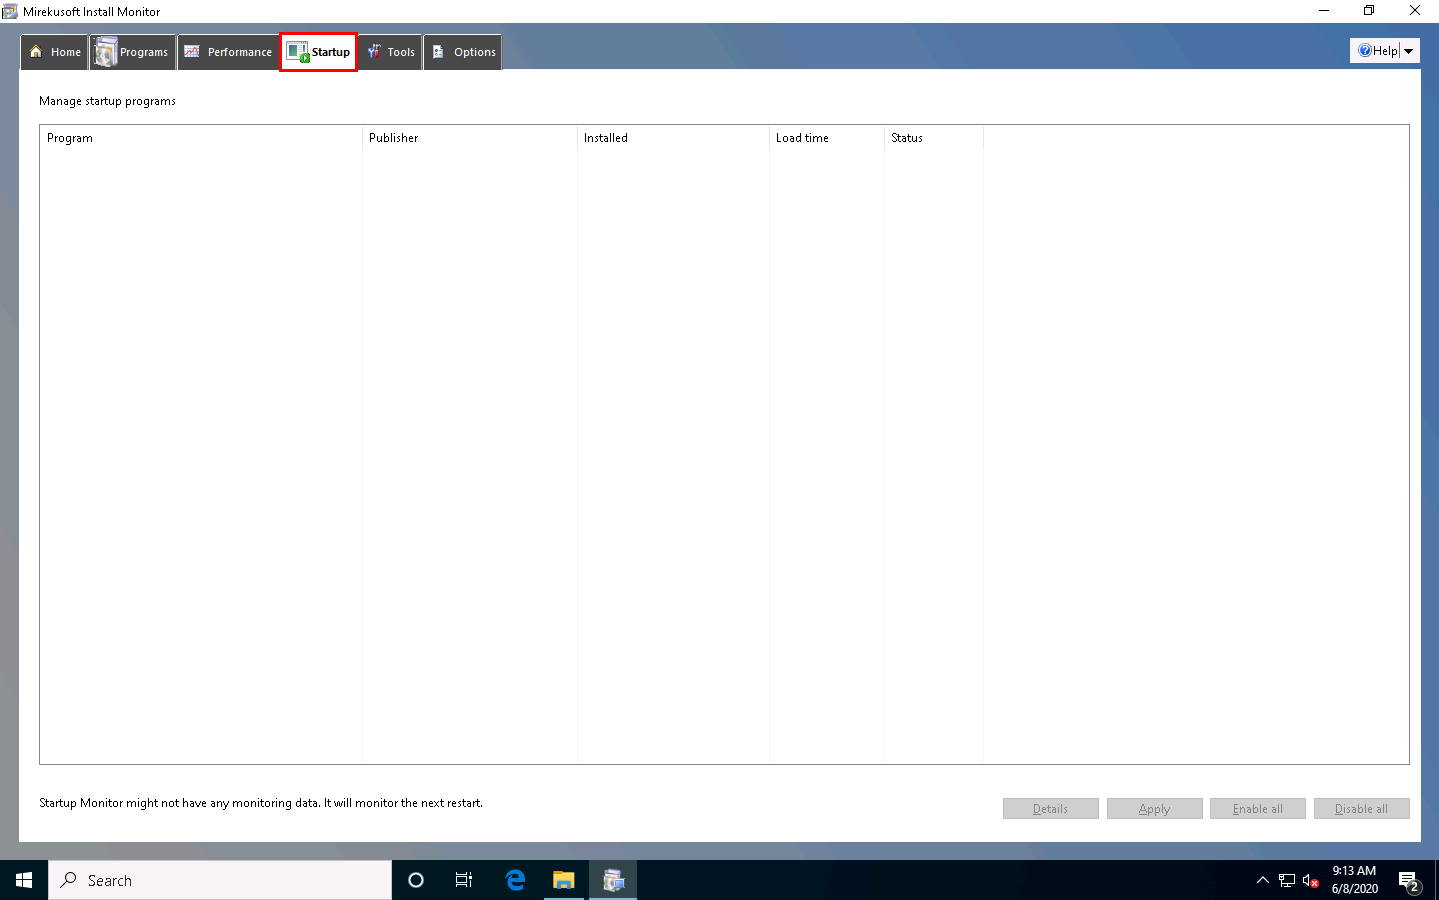
Click the Startup tab to view the programs that run automatically on Windows Startup.
In this lab, Mirekusoft Install Monitor has not detected startup programs. If the program does detect them, choose the application that you want to disable on startup, and click Disable.
You can restart the machine to detect the startup programs.
This is how to monitor a Windows machine using Mirekusoft Install Monitor. Close all applications.
You can also use other installation monitoring tools such as SysAnalyzer (https://www.aldeid.com), Advanced Uninstaller PRO (https://www.advanceduninstaller.com), REVO UNINSTALLER PRO (https://www.revouninstaller.com), or Comodo Programs Manager (https://www.comodo.com) to perform installation monitoring.
Task 7: Perform Files and Folder Monitoring using PA File Sight
Malware can modify system files and folders to save information in them. You should be able to find the files and folders that malware creates and analyze them to collect any relevant stored information. These files and folders may also contain hidden program code or malicious strings that the malware plans to execute on a specific schedule.
An ethical hacker or penetration tester must scan the system for suspicious files and folders using file and folder monitoring tools such as PA File Sight to detect any malware installed and any system file modifications. PA File Sight is a protection and auditing tool. It detects ransomware attacks coming from a network and stops them.
Features:
- Compromised computers are blocked from reaching files on other protected servers on the network
- Detects users copying files and optionally blocks access
- Real-time alerts allow the appropriate staff to investigate immediately
- Audits who is deleting, moving, and reading files
On the Windows 10 machine, navigate to D:\CEH-Tools\CEHv11 Module 07 Malware Threats\Malware Analysis Tools\Dynamic Malware Analysis Tools\Files and Folder Monitoring Tools\PA File Sight and double-click filesightultra.exe.
If a User Account Control window appears, click Yes.
The Select Setup Language pop-up appears; choose your preferred language, and then click OK.
Follow the default installation steps to install PA File Sight.
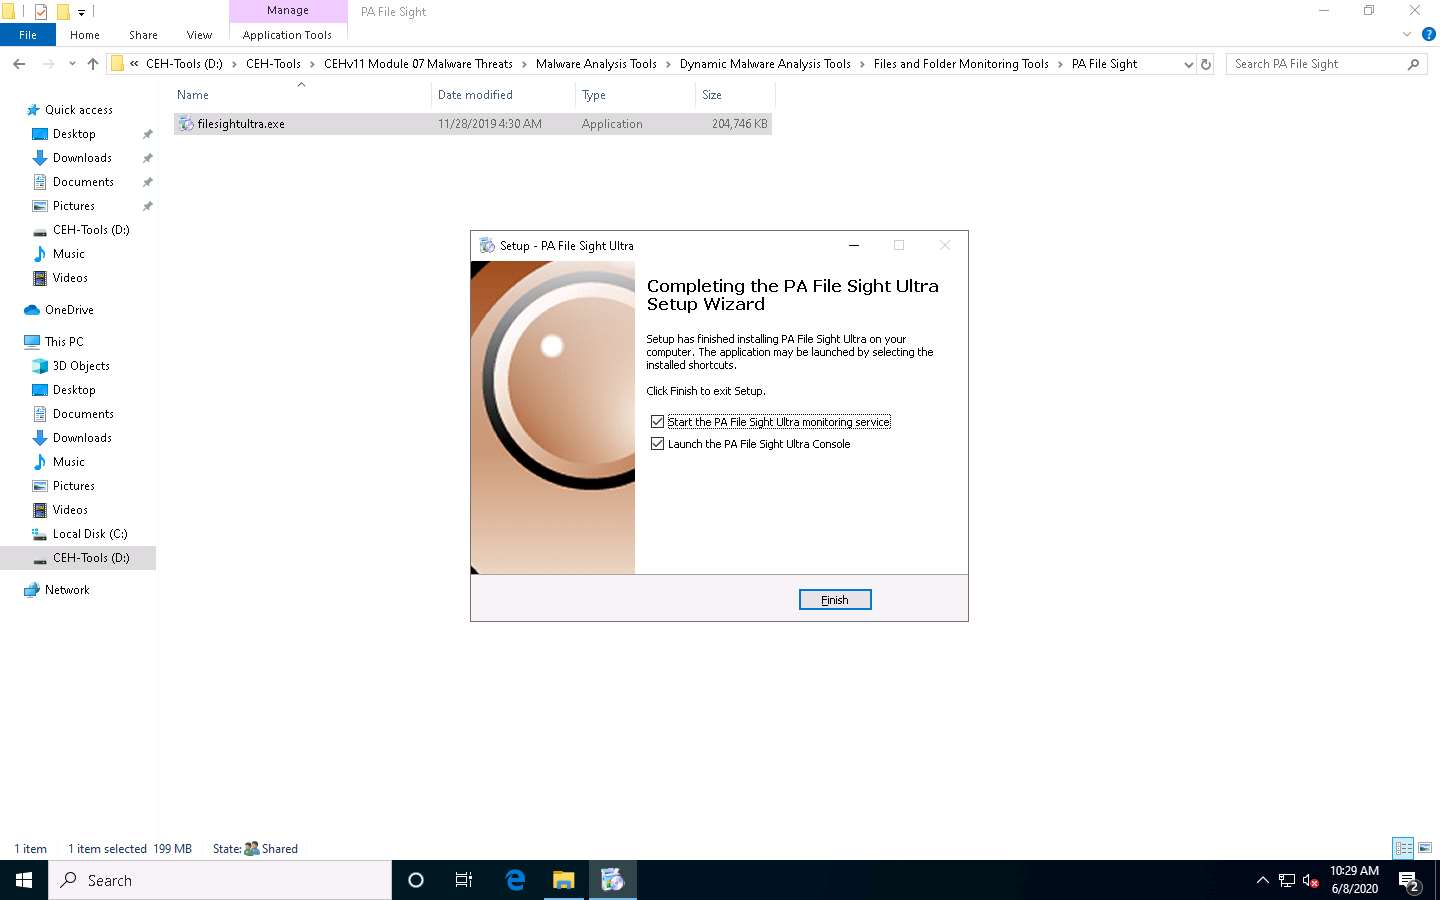
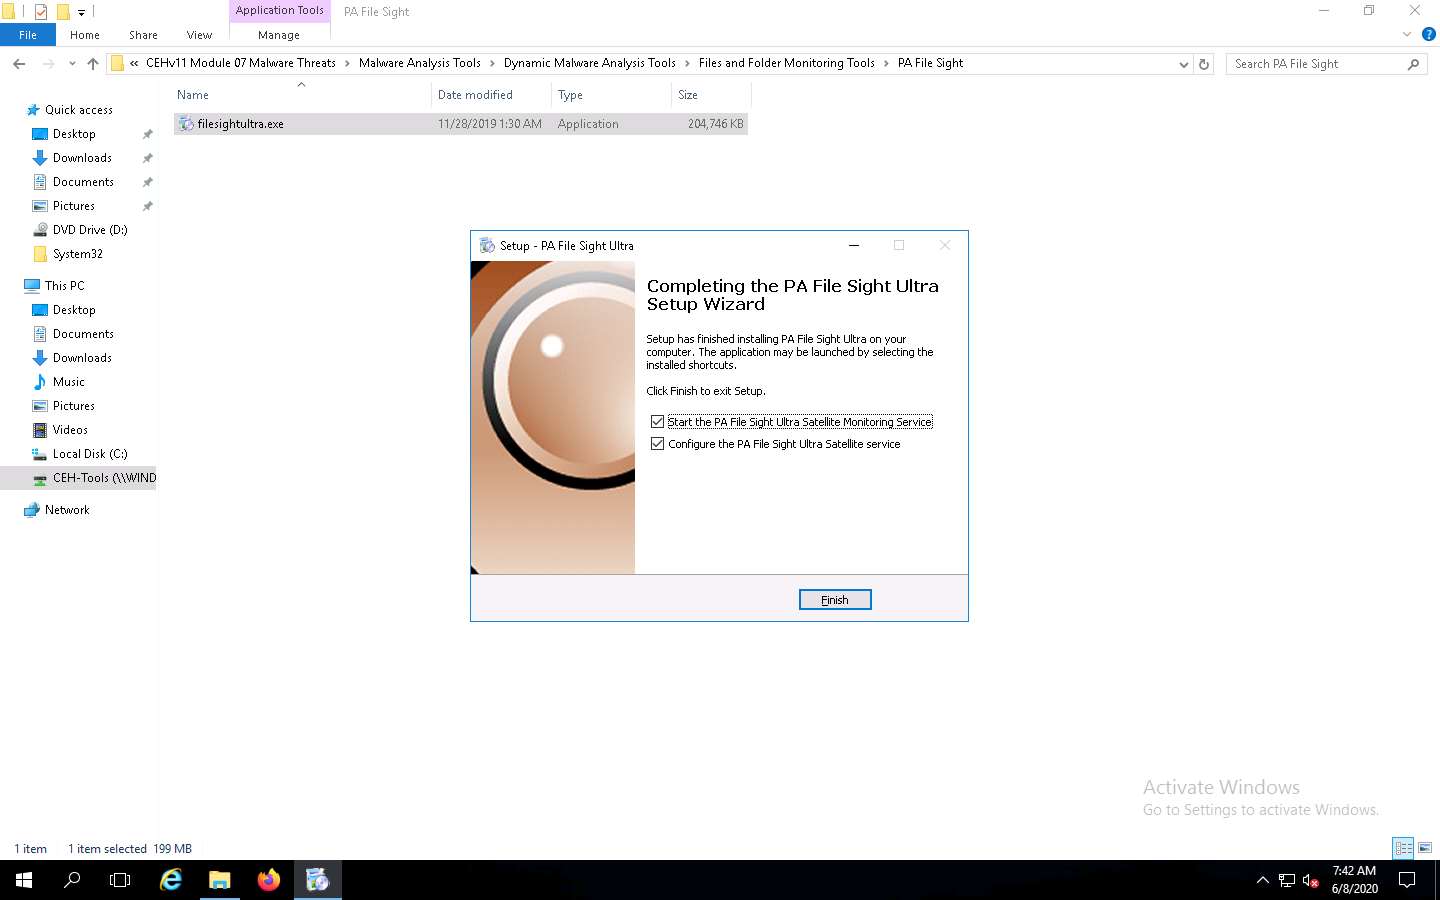
Completing the PA File Sight Ultra Setup Wizard appears; make sure that both the Start the PA File Sight Ultra monitoring service and the Launch the PA File Sight Ultra Console options are checked, and click Finish.
This will run the PA File Sight service and automatically launch the application.
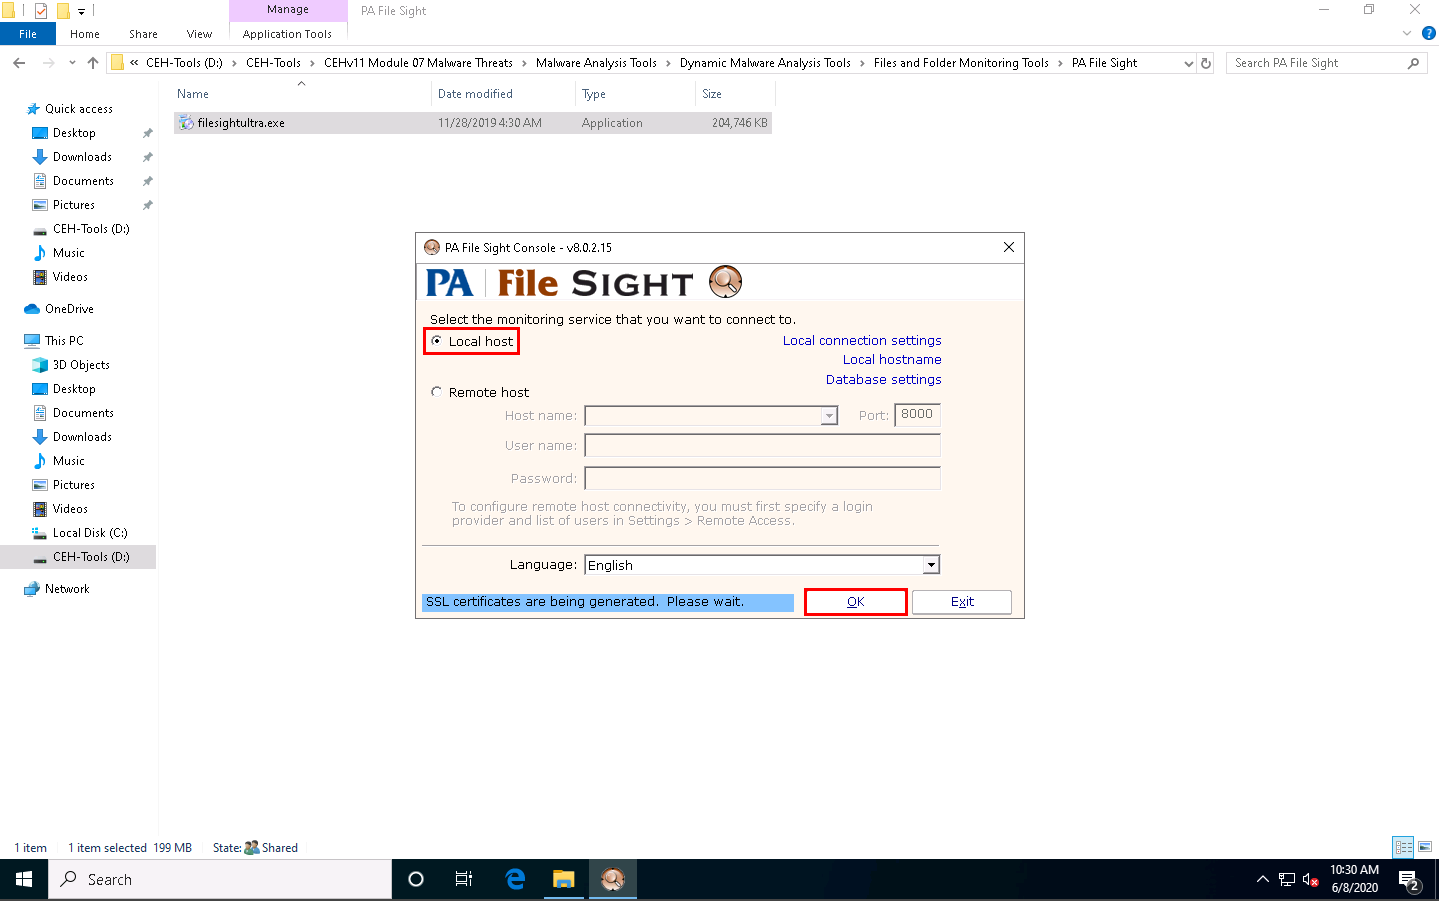
The PA File Sight Console window appears. By default, the Local host radio button is selected; click OK.
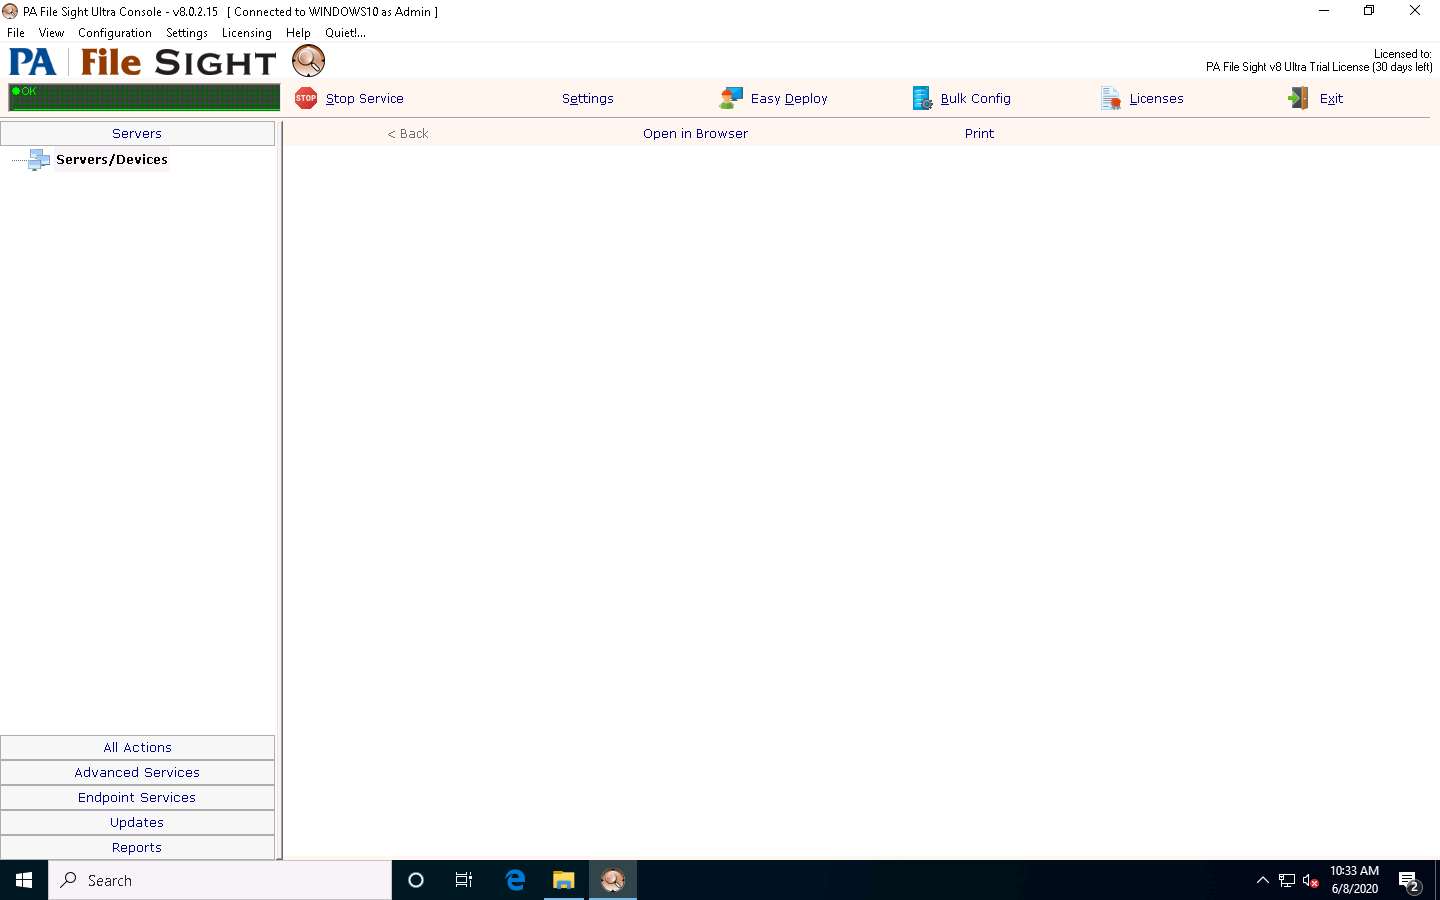
The PA File Sight Ultra Console main window appears.
If a Start Wizard window appears, close it.
Click Windows Server 2016 to switch to the Windows Server 2016 machine Click Ctrl+Alt+Delete to activate the machine, by default, CEH\Administrator account is selected, click Pa$$w0rd to enter the password and press Enter.
Navigate to Z:\CEHv11 Module 07 Malware Threats\Malware Analysis Tools\Dynamic Malware Analysis Tools\Files and Folder Monitoring Tools\PA File Sight and double-click filesightultra.exe.
The Select Setup Language pop-up appears; choose your preferred language and click OK.
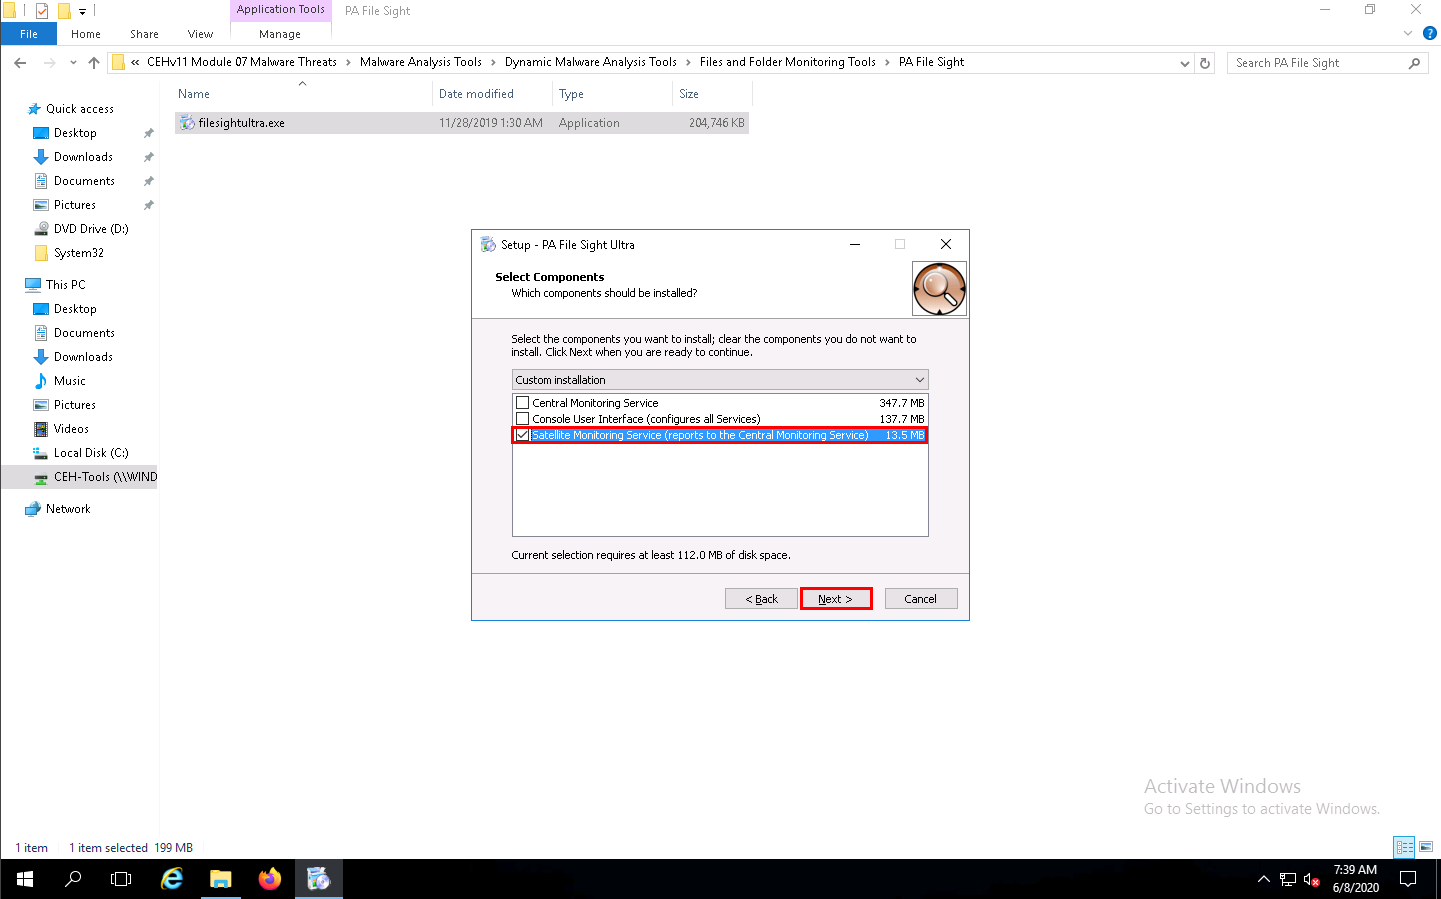
Click the Next button until you see the Select Components wizard.
In the Select Components wizard, uncheck the Central Monitoring Service and Console User Interface (configure all Services) options, and check the Satellite Monitoring Service (reports to Central Monitoring Service) option; then, click Next.
Follow the wizard-driven installation steps to install the application.
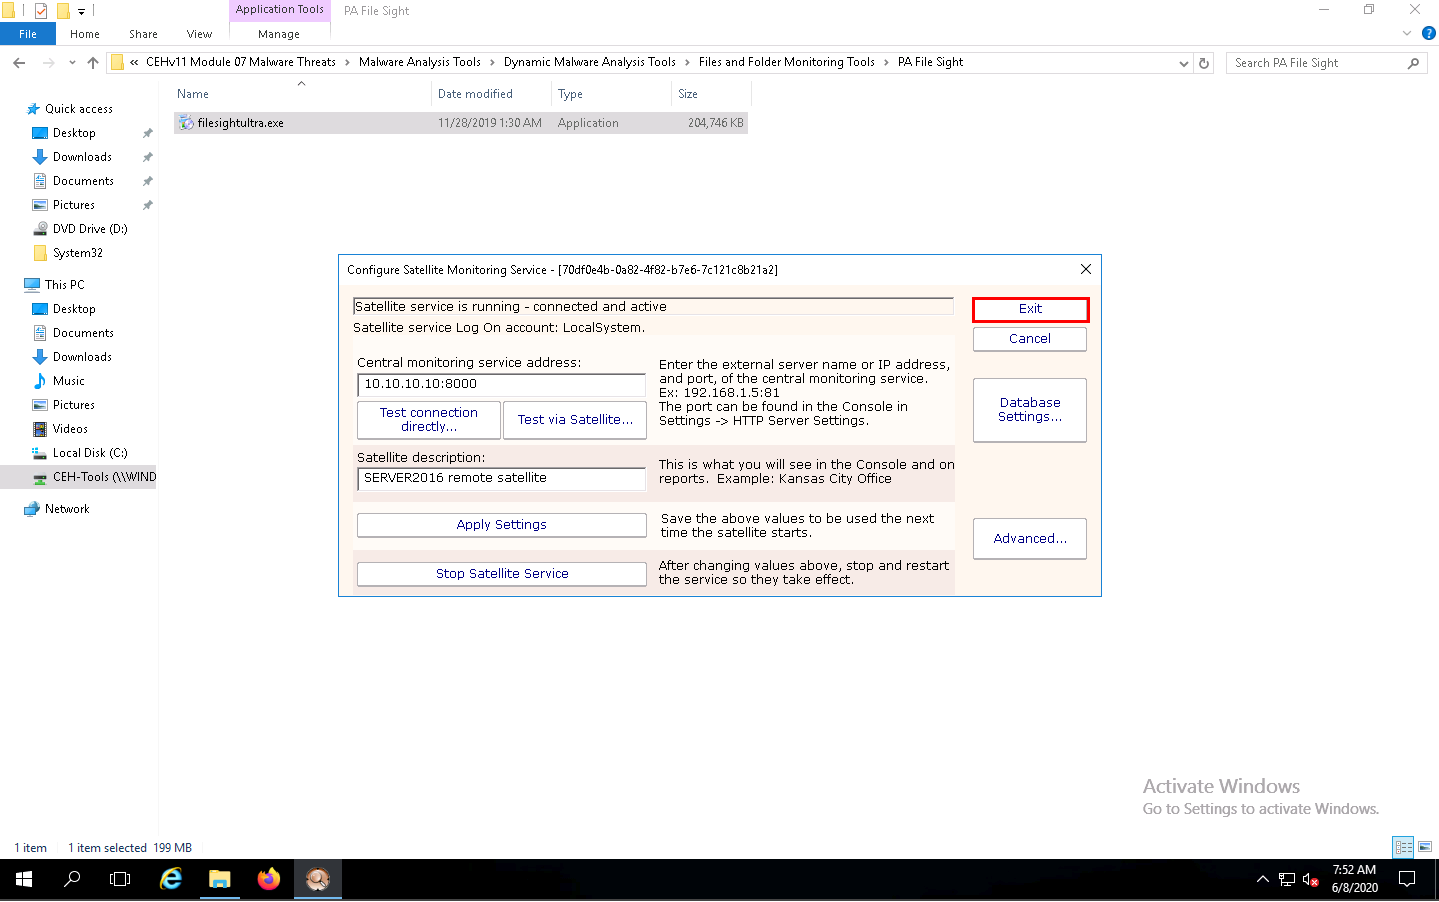
In the final step of the installation, make sure that the Start the PA File Sight Ultra Satellite Monitoring Service and Configure the PA File Sight Ultra Satellite service options are checked; then, click Finish.
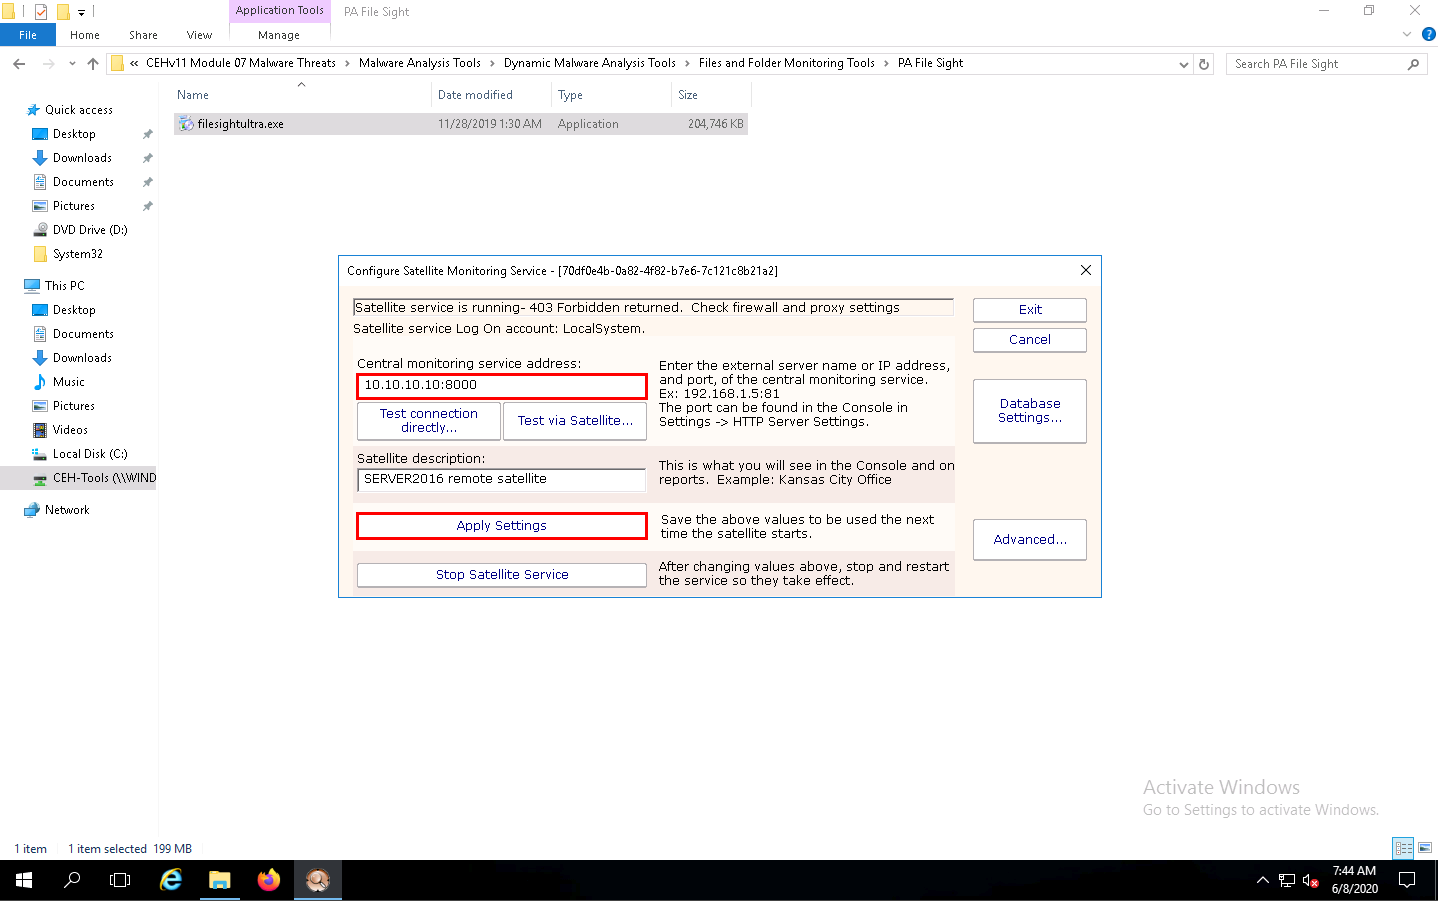
The Configure Satellite Monitoring Service window appears; type the Windows 10 IP address into the Central monitoring service address field along with port 8000. Leave the other settings to default and click Apply Settings.
In this task, the IP address of the Windows 10 machine is 10.10.10.10. the IP address may vary in your lab environment.
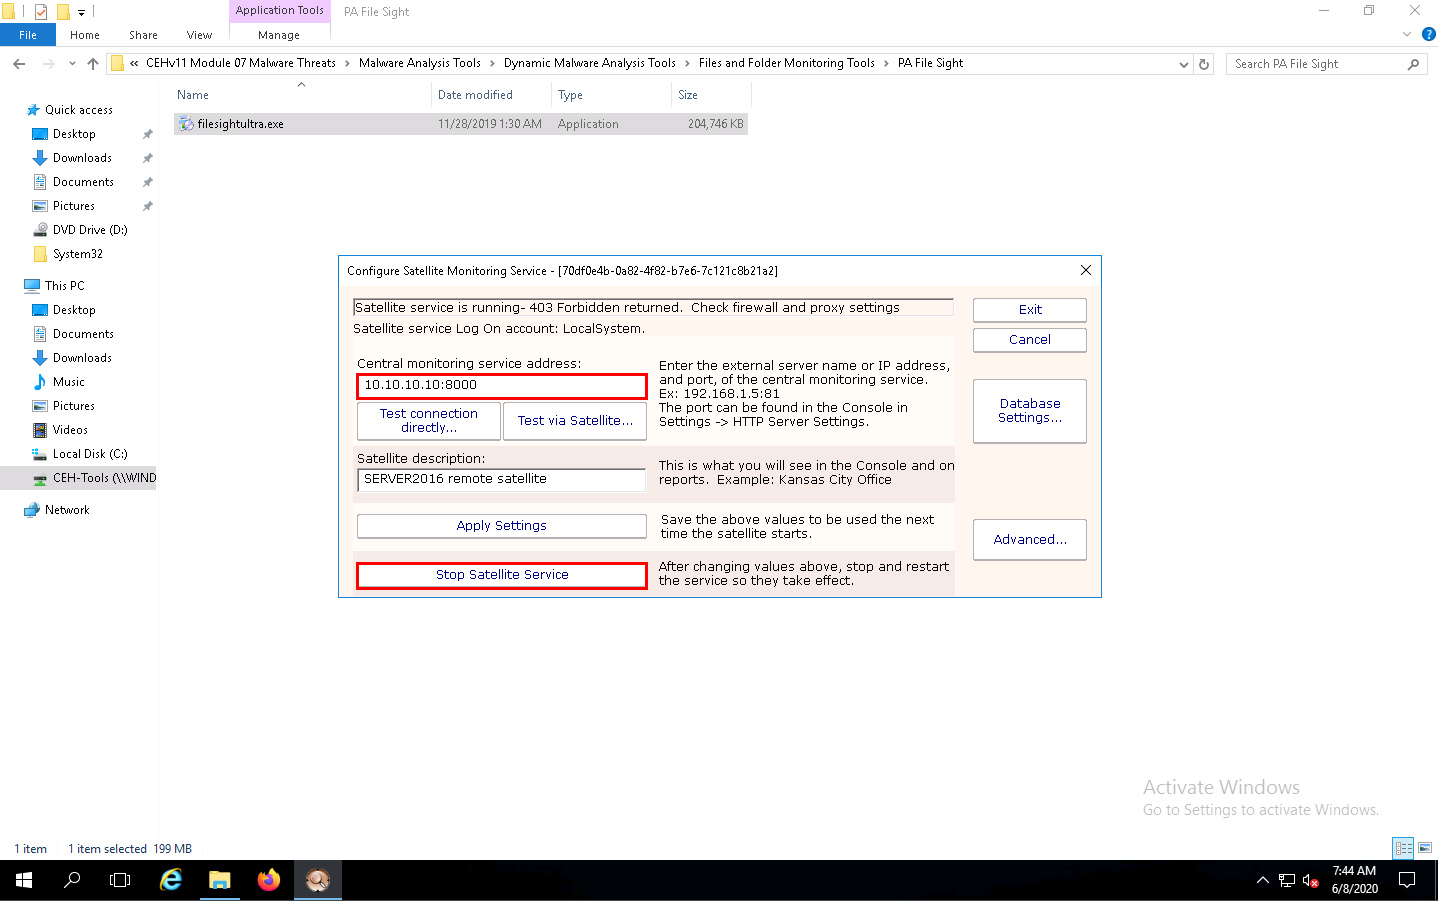
Click Stop Satellite Service to stop the satellite service.
Once the service is stopped, click Start Satellite Service.
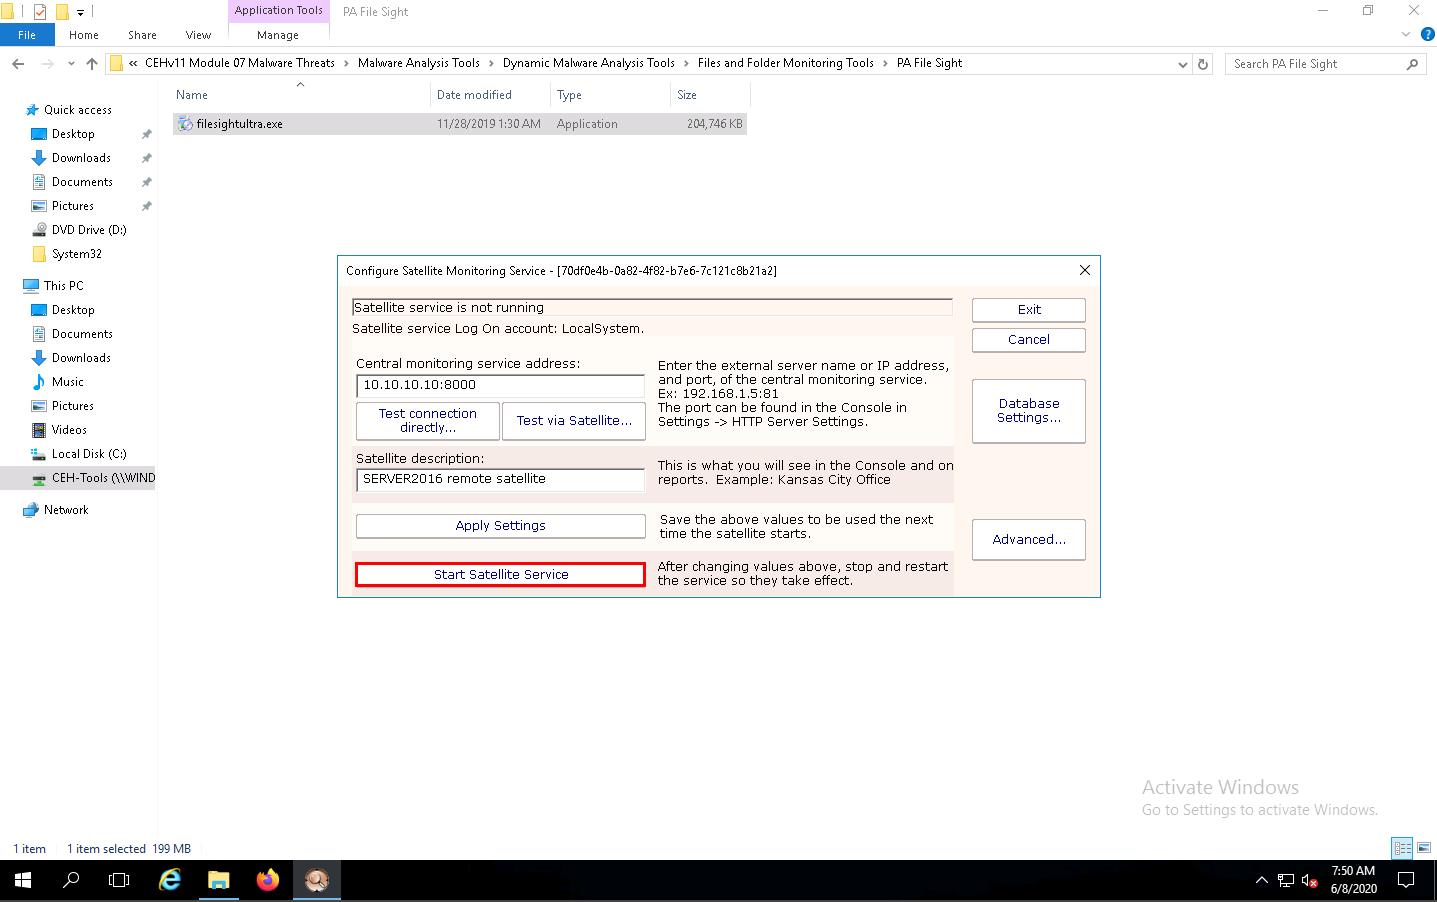
Once the service has started, click Exit to close the application.
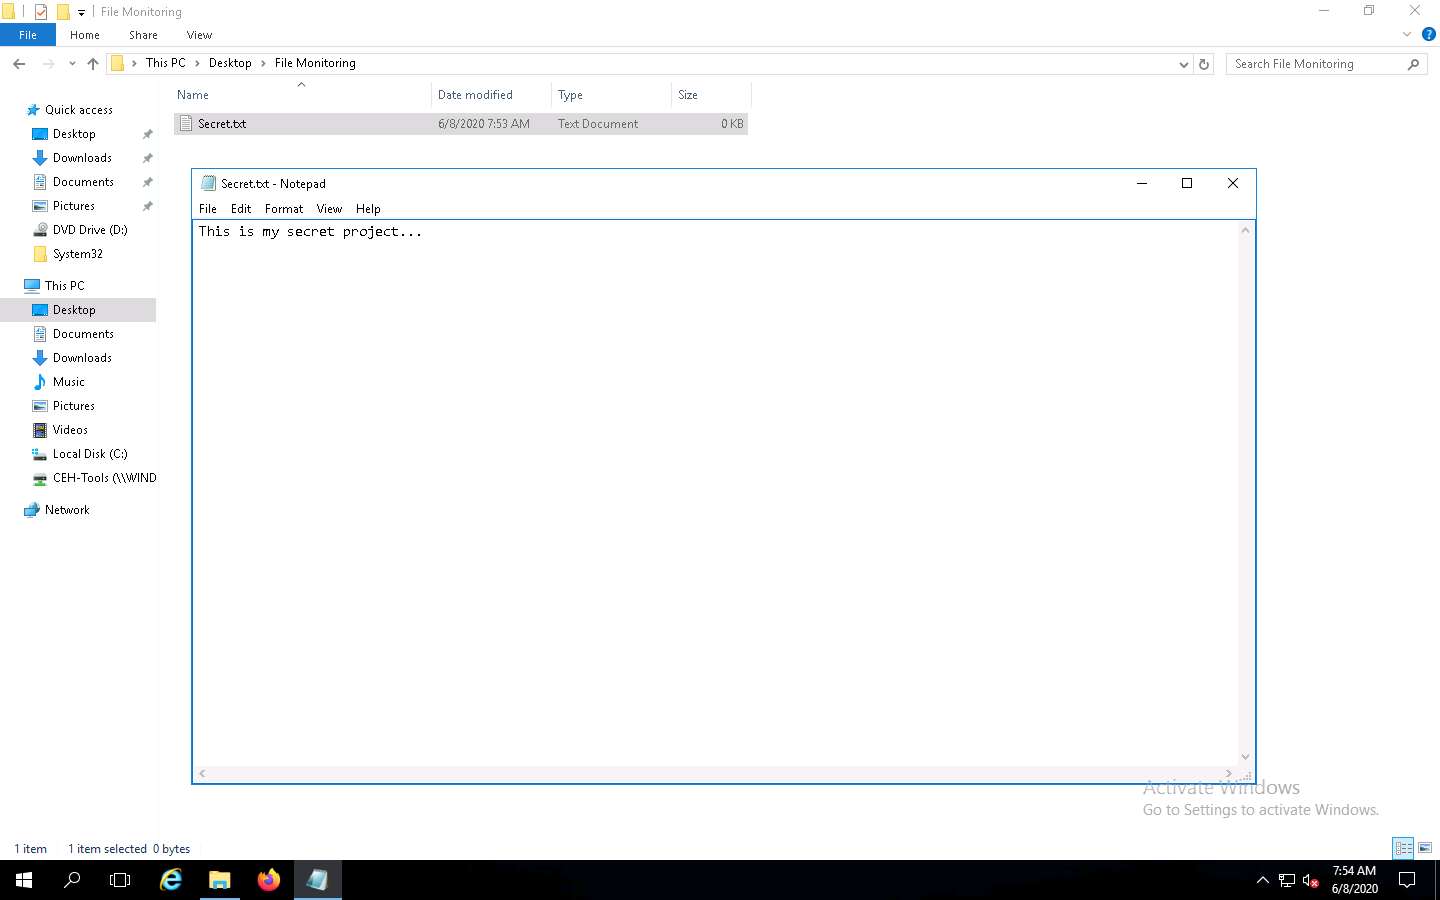
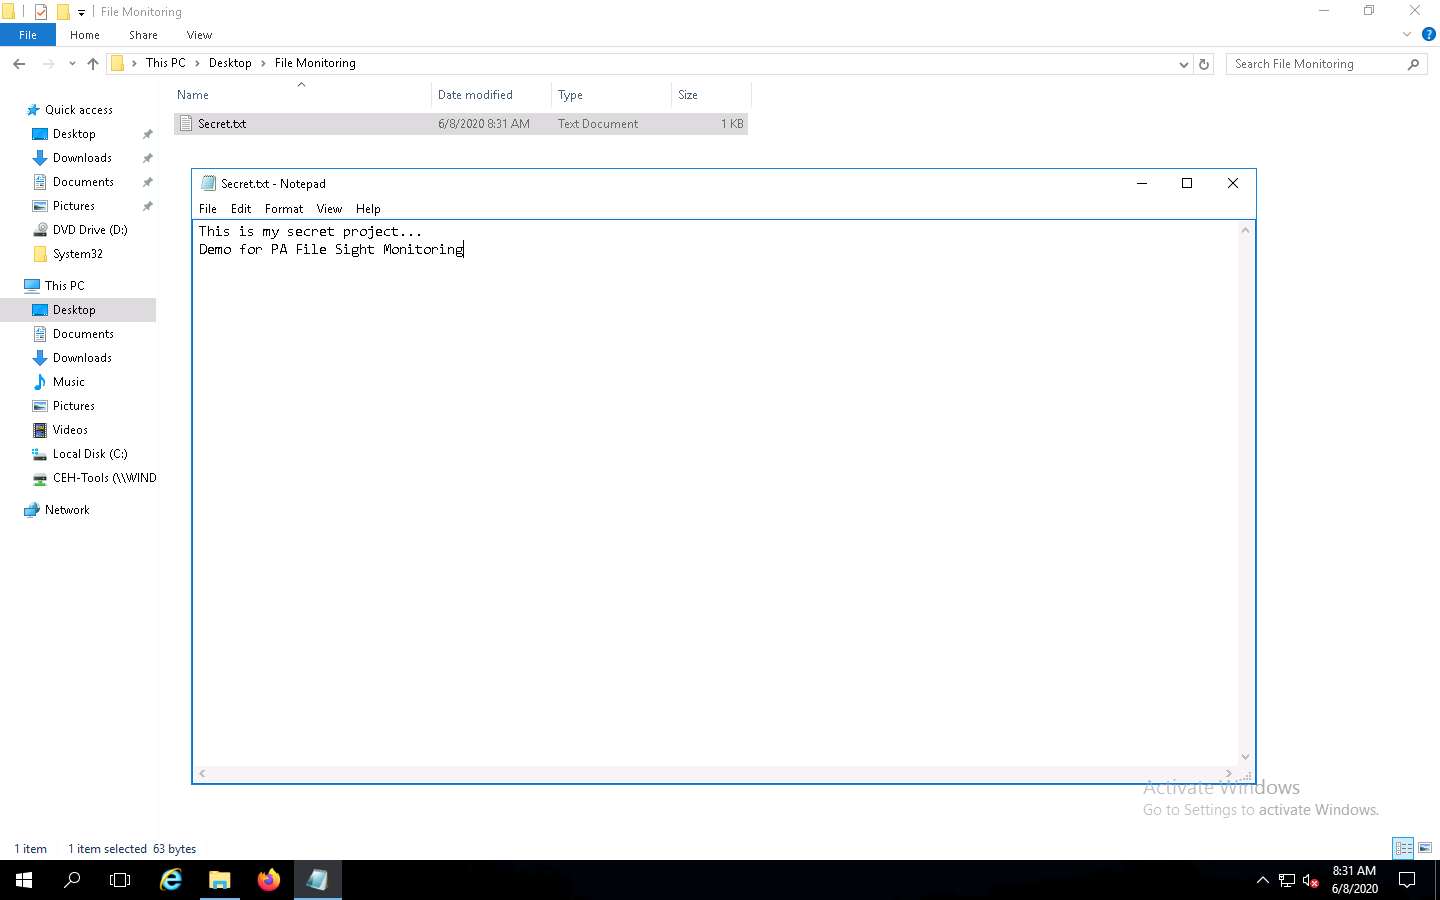
Create a folder named File Monitoring on Desktop and open it. Create a new text document in the folder, name it Secret.txt, type some text content in the file, and save it. Close the notepad window.
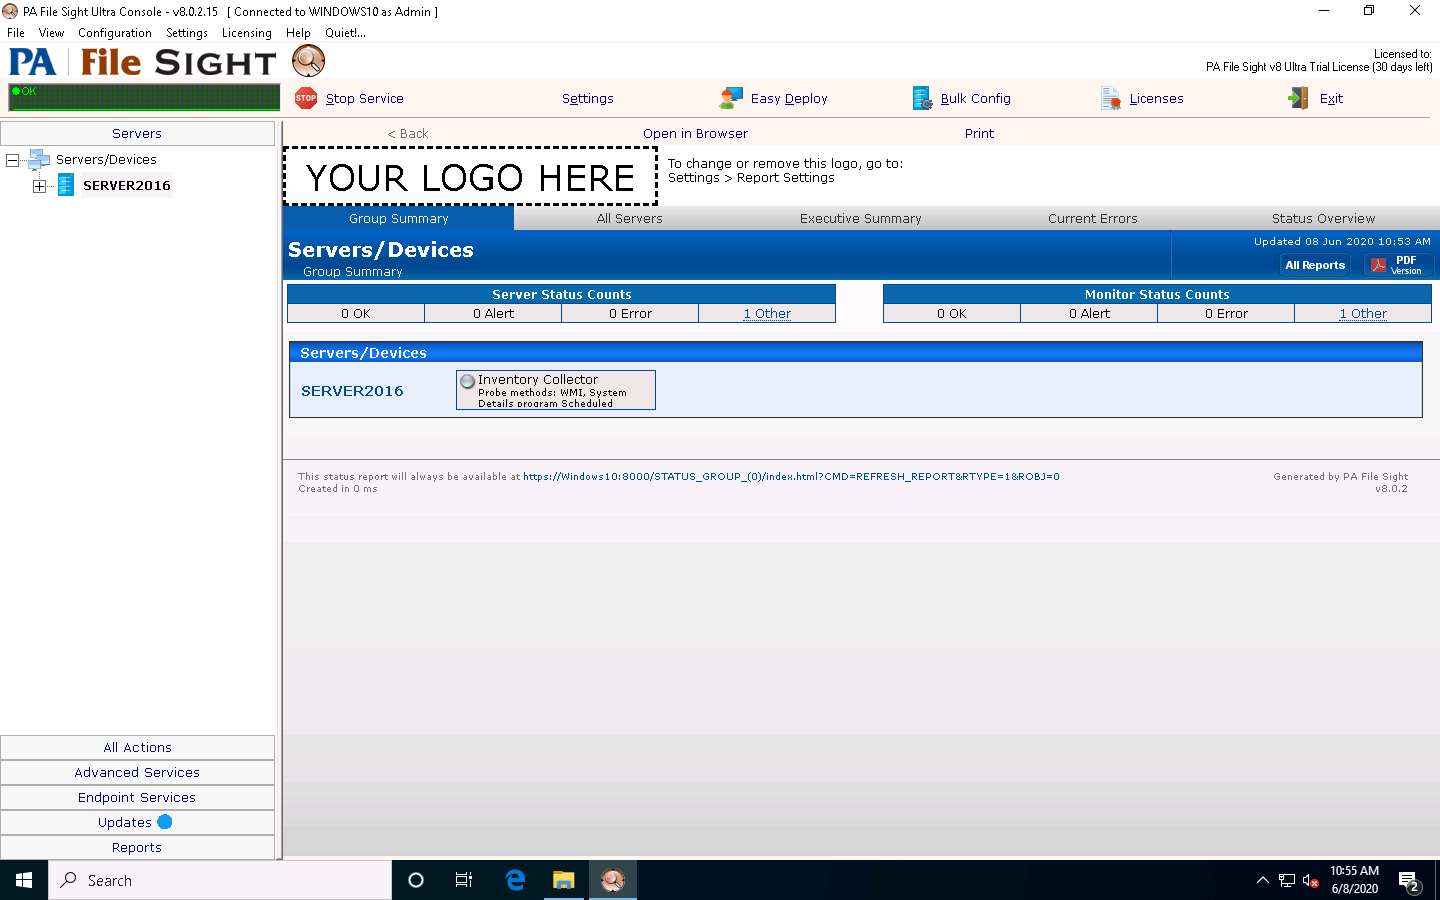
Click Windows 10 to switch back to the Windows 10 machine, and observe that PA File Sight starts monitoring the Windows Server 2016 machine.
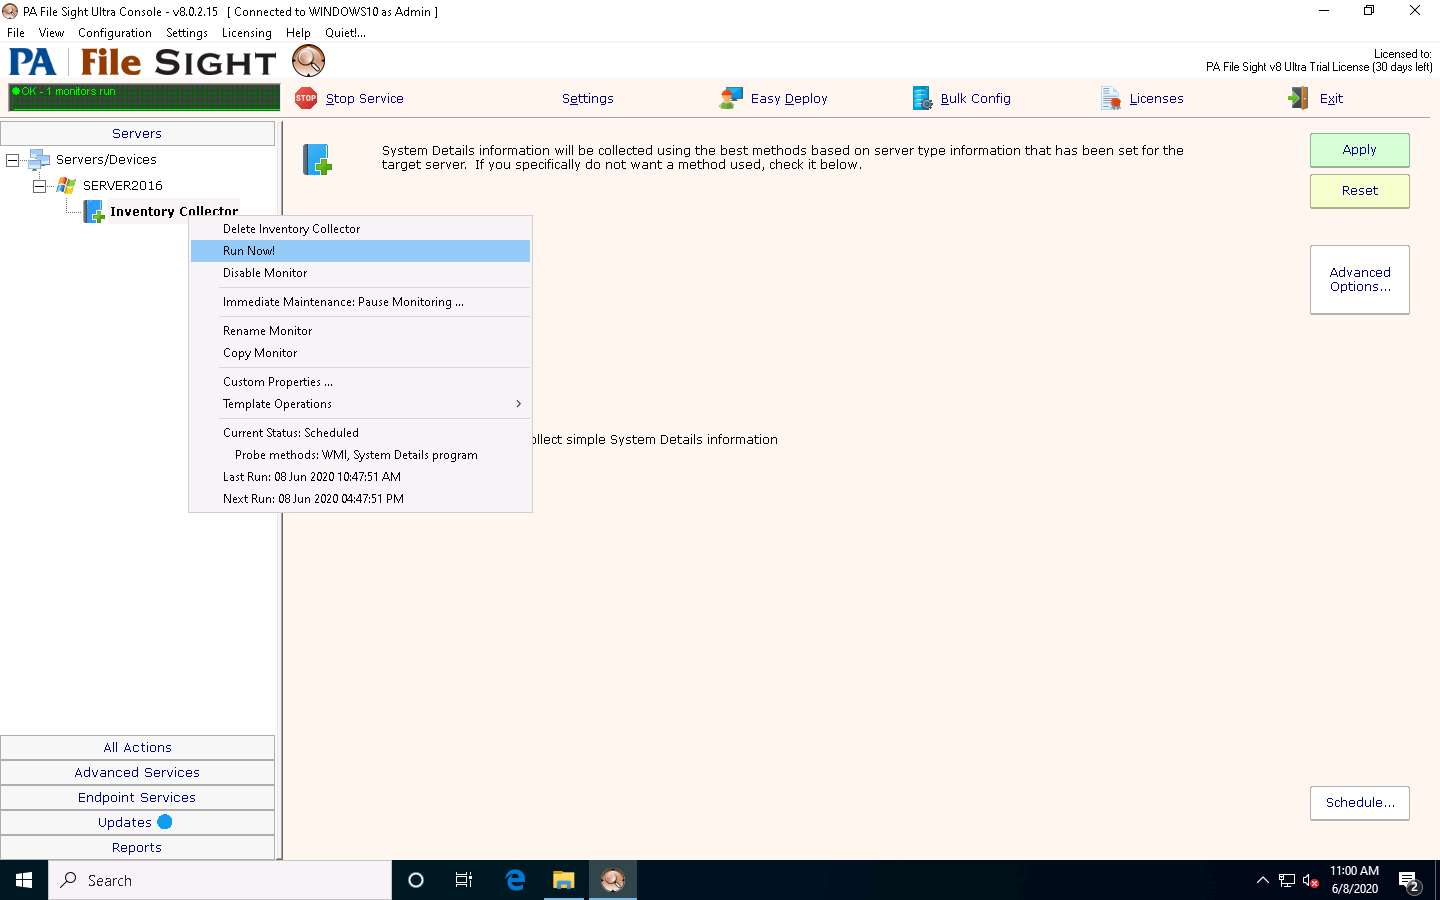
Expand the SERVER2016 node, select Inventory Collector in the left-hand pane, and click the Apply button from the right-hand pane.
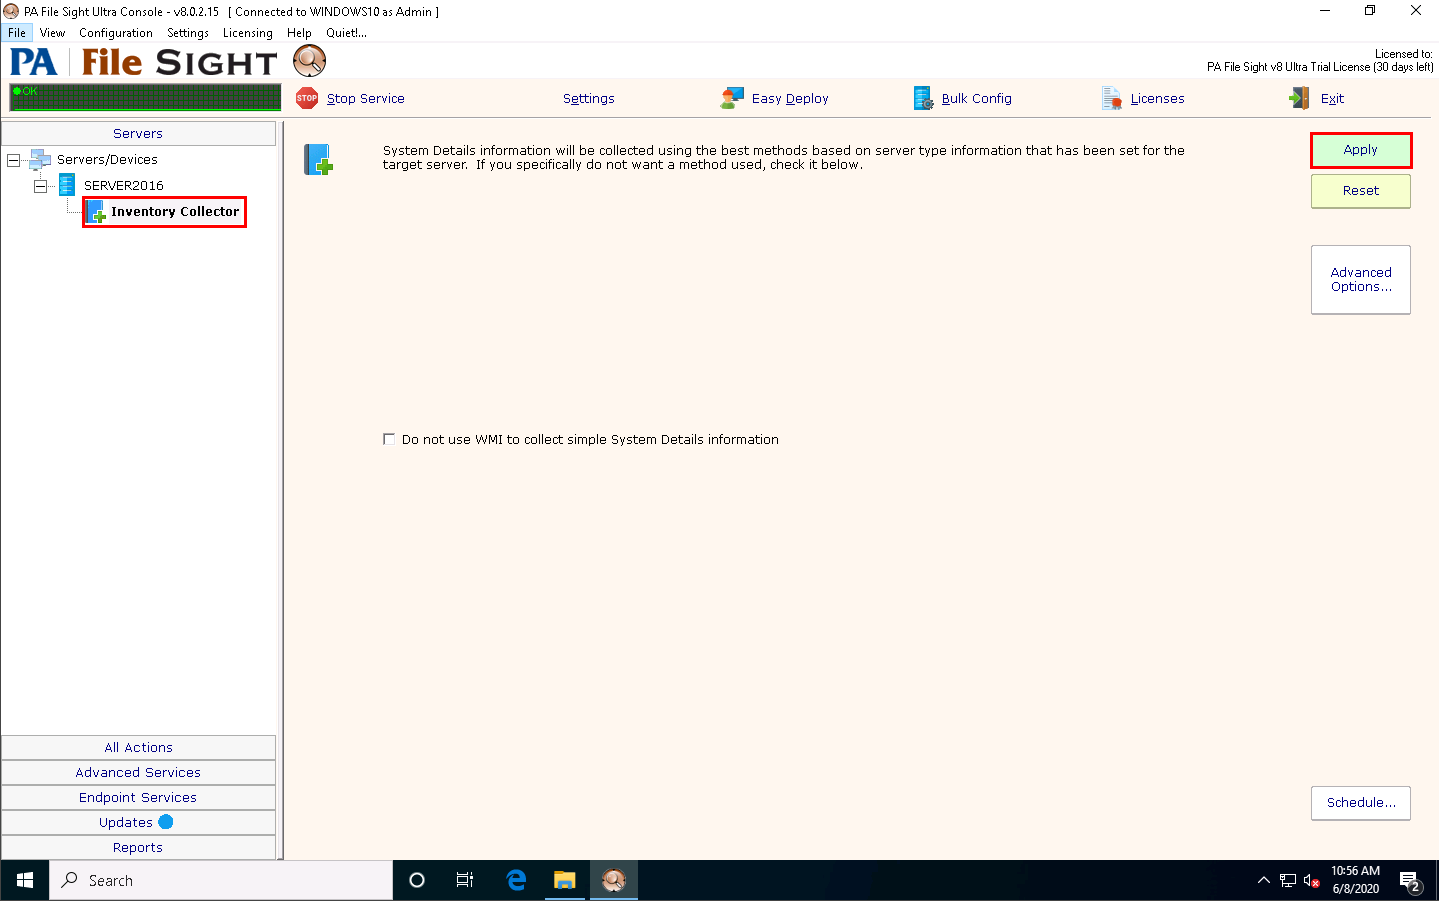
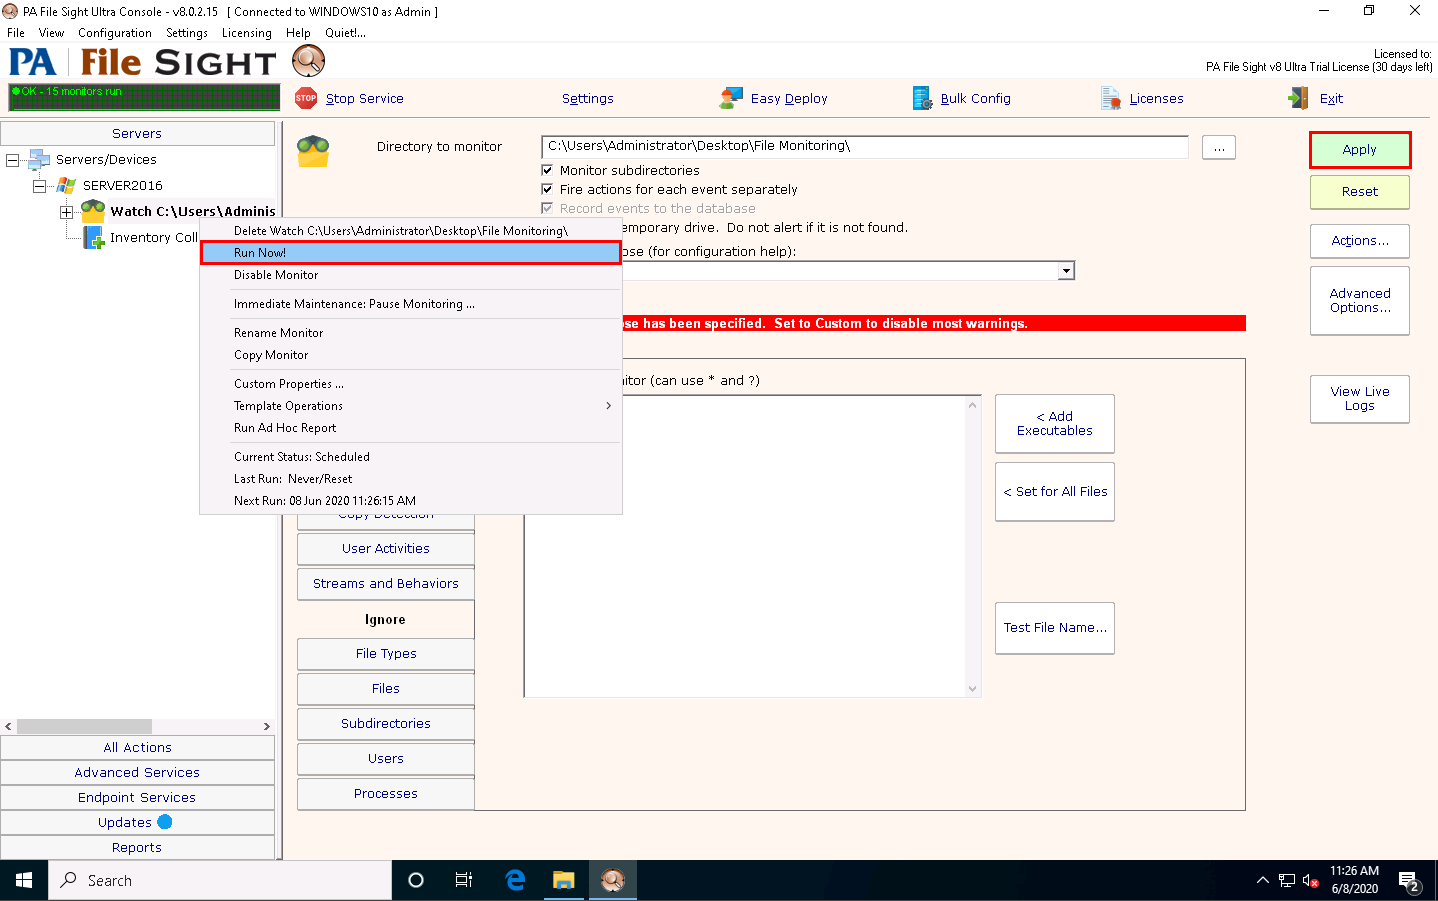
Now, right-click on Inventory Collector and click Run Now! from the context menu.
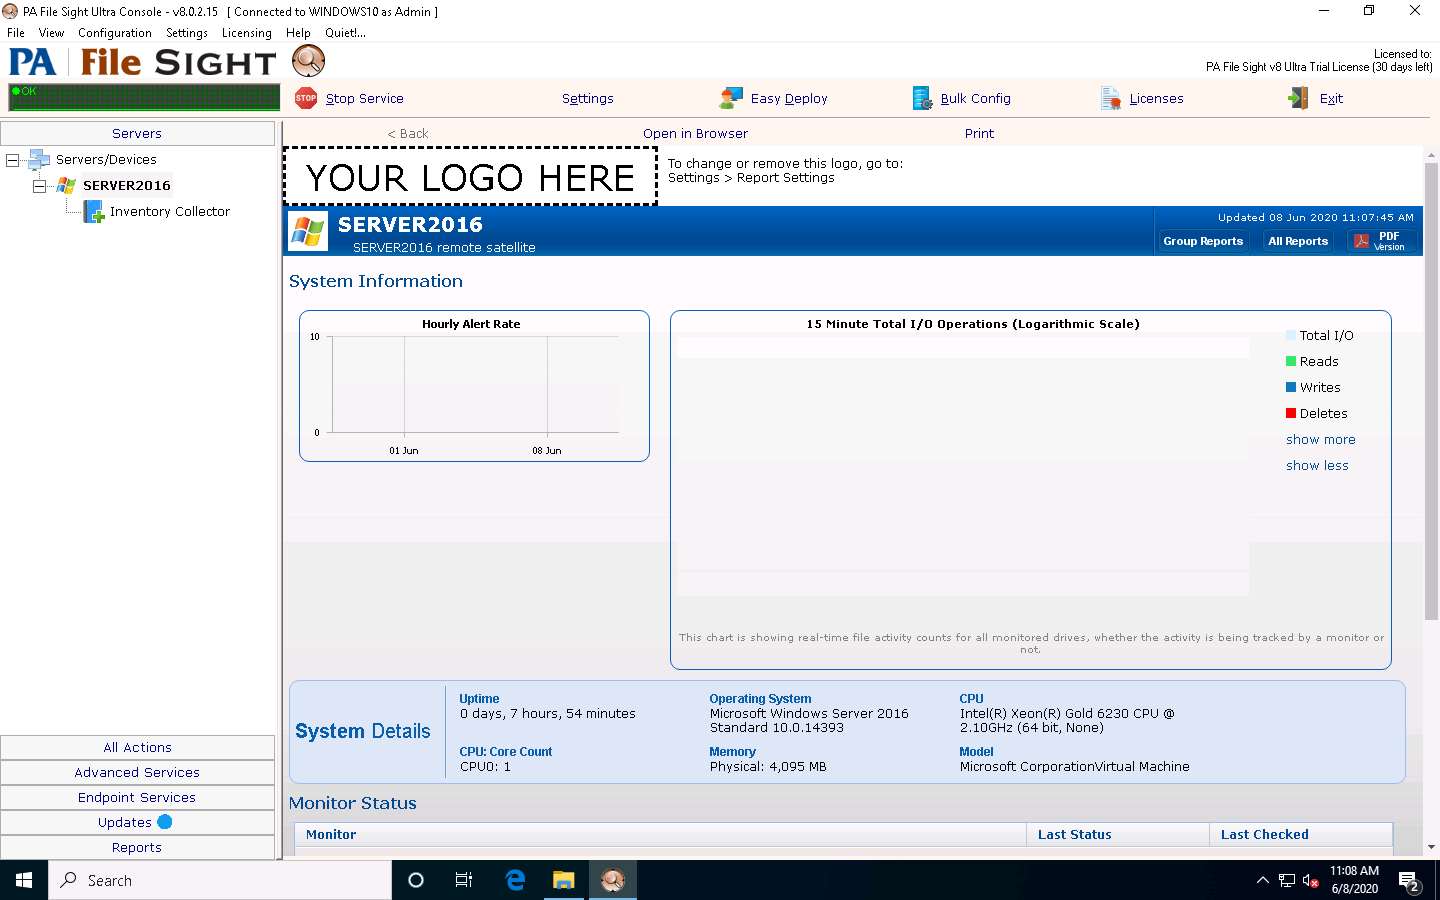
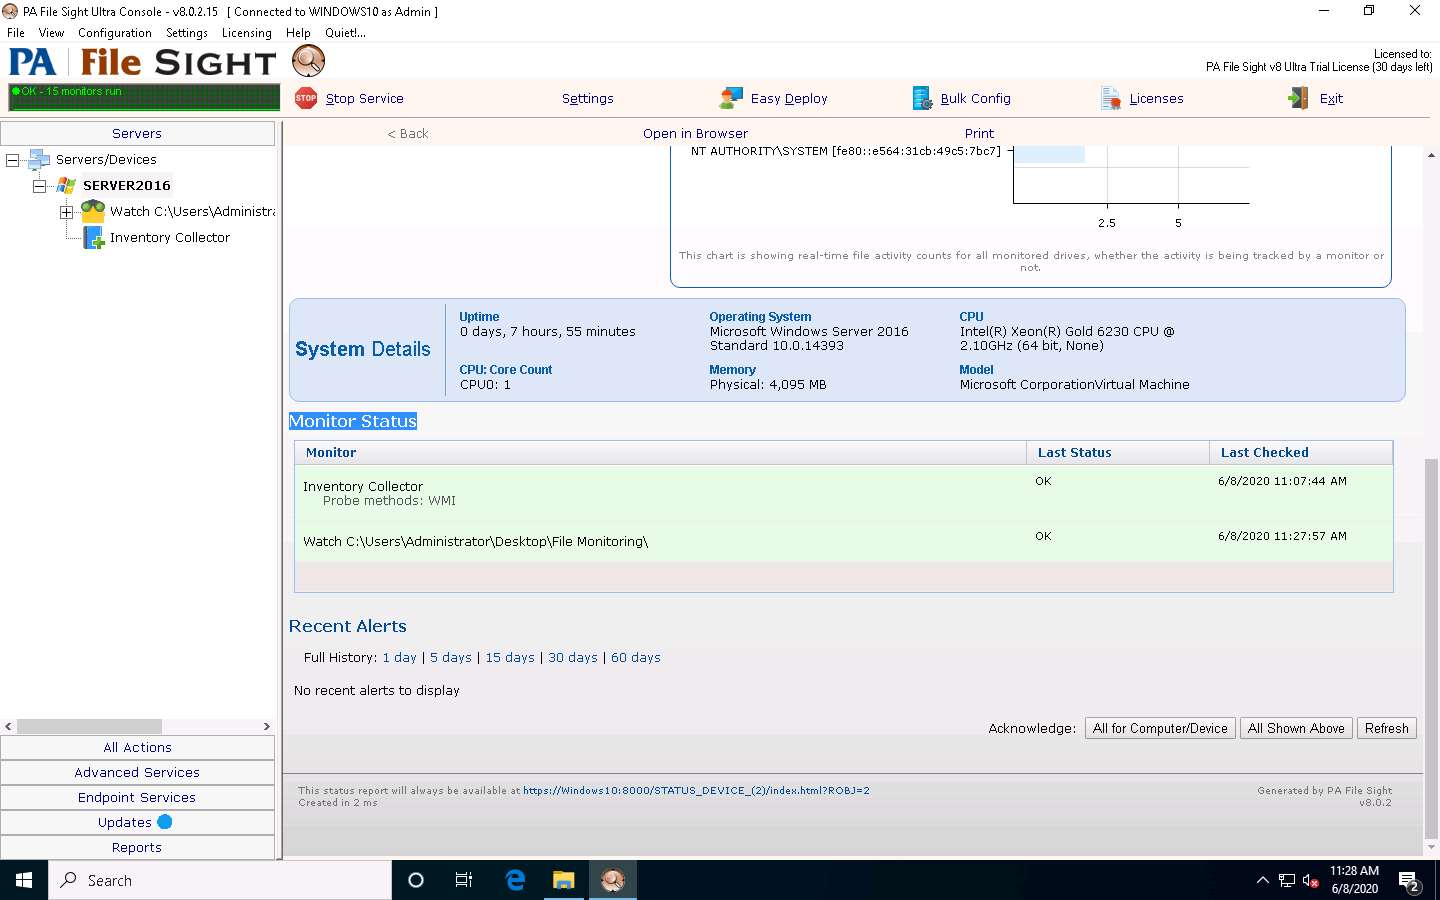
Select SERVER2016 in the left pane and scroll down, and you can see the complete system information for the Windows Server 2016 machine on the dashboard.
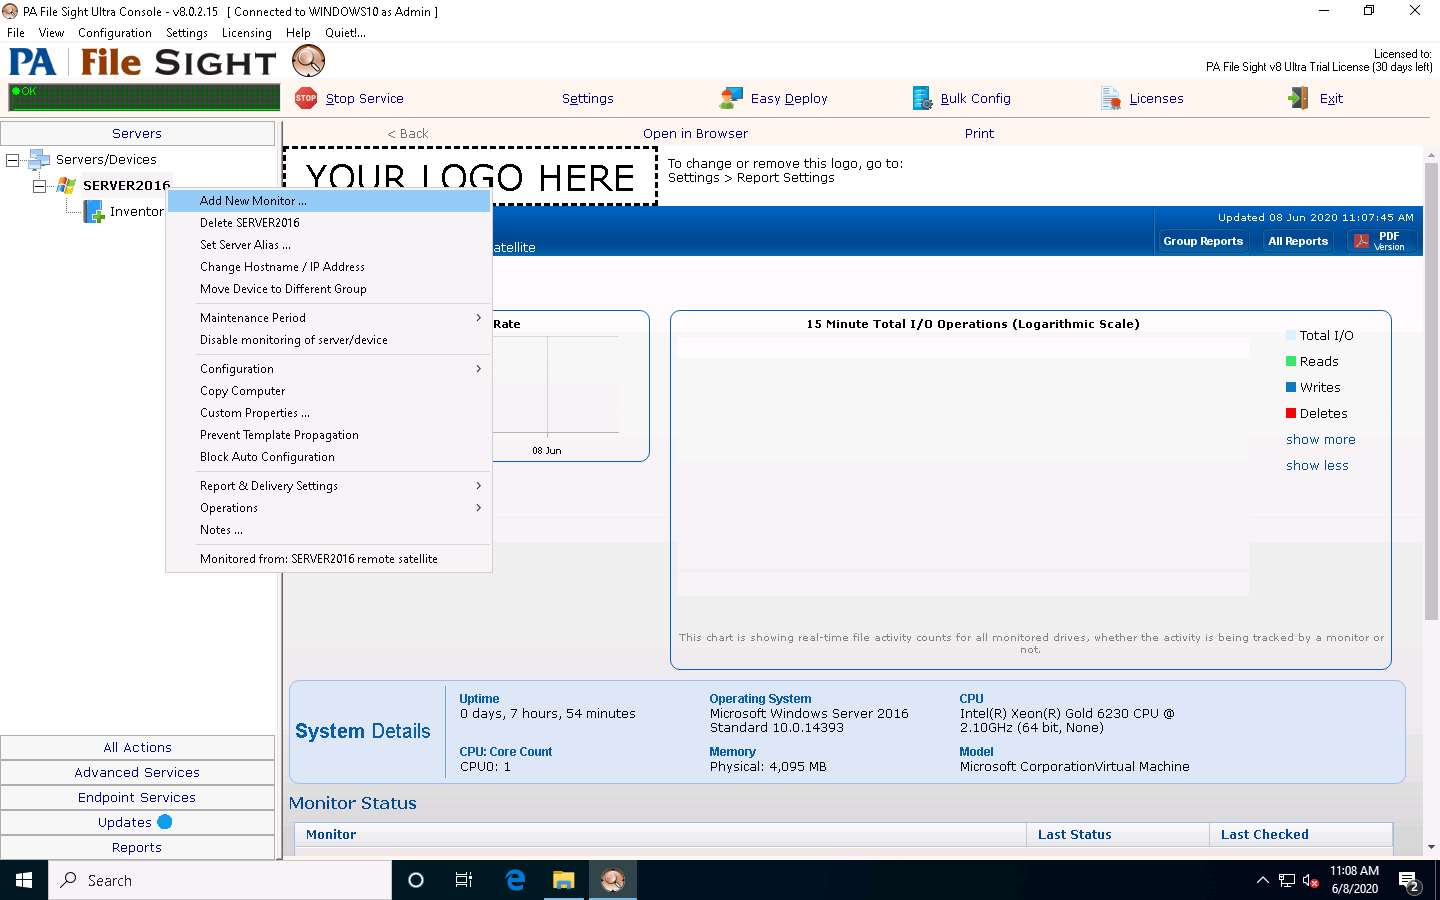
Right-click on SERVER2016 and click the Add New Monitor option from the context menu.
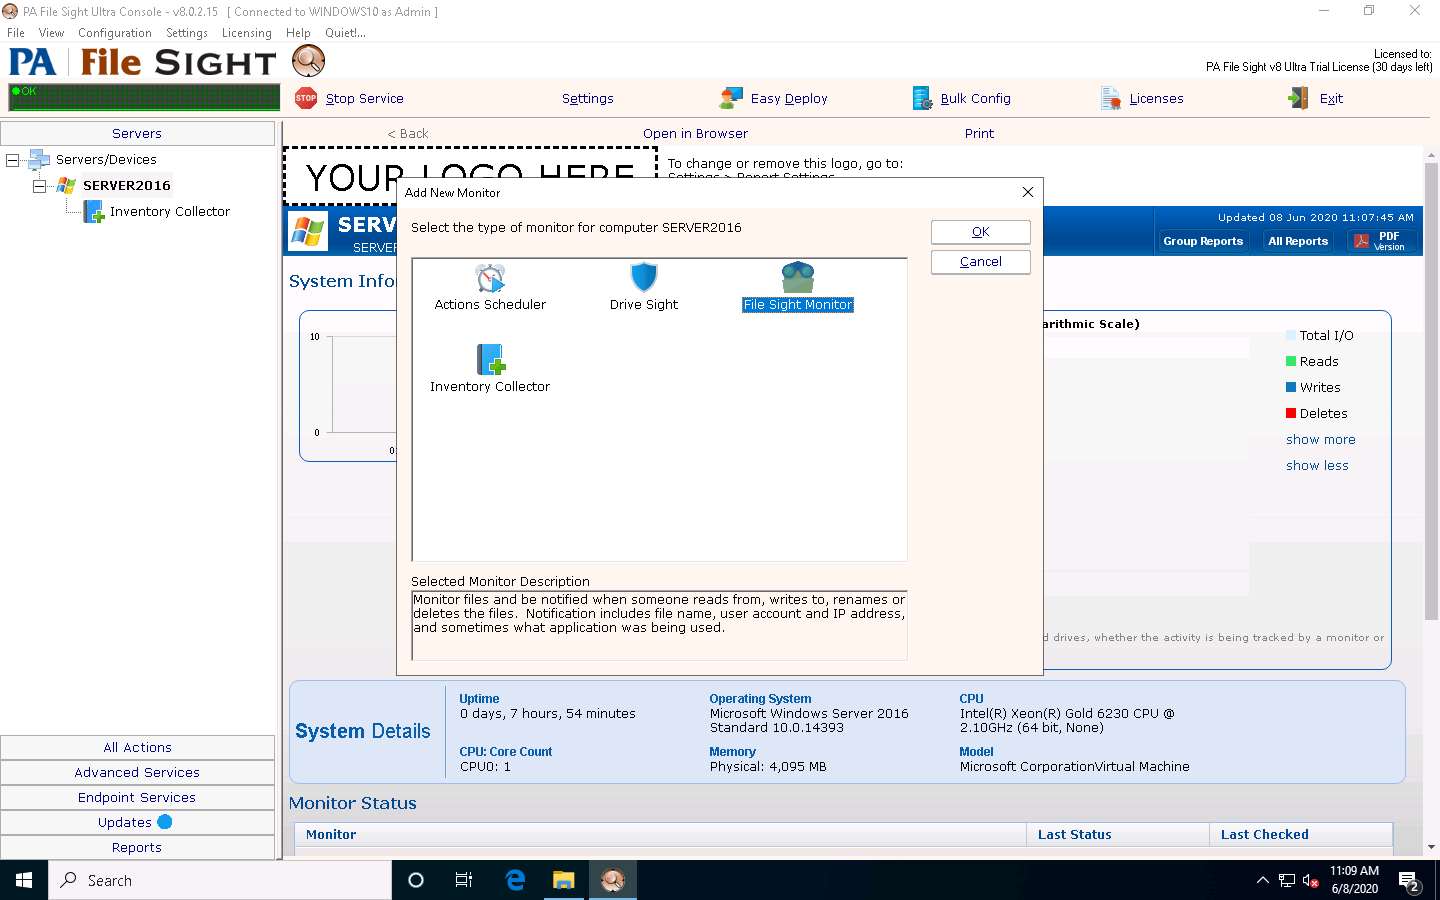
The Add New Monitor window appears, select the File Sight Monitor icon, and then click OK.
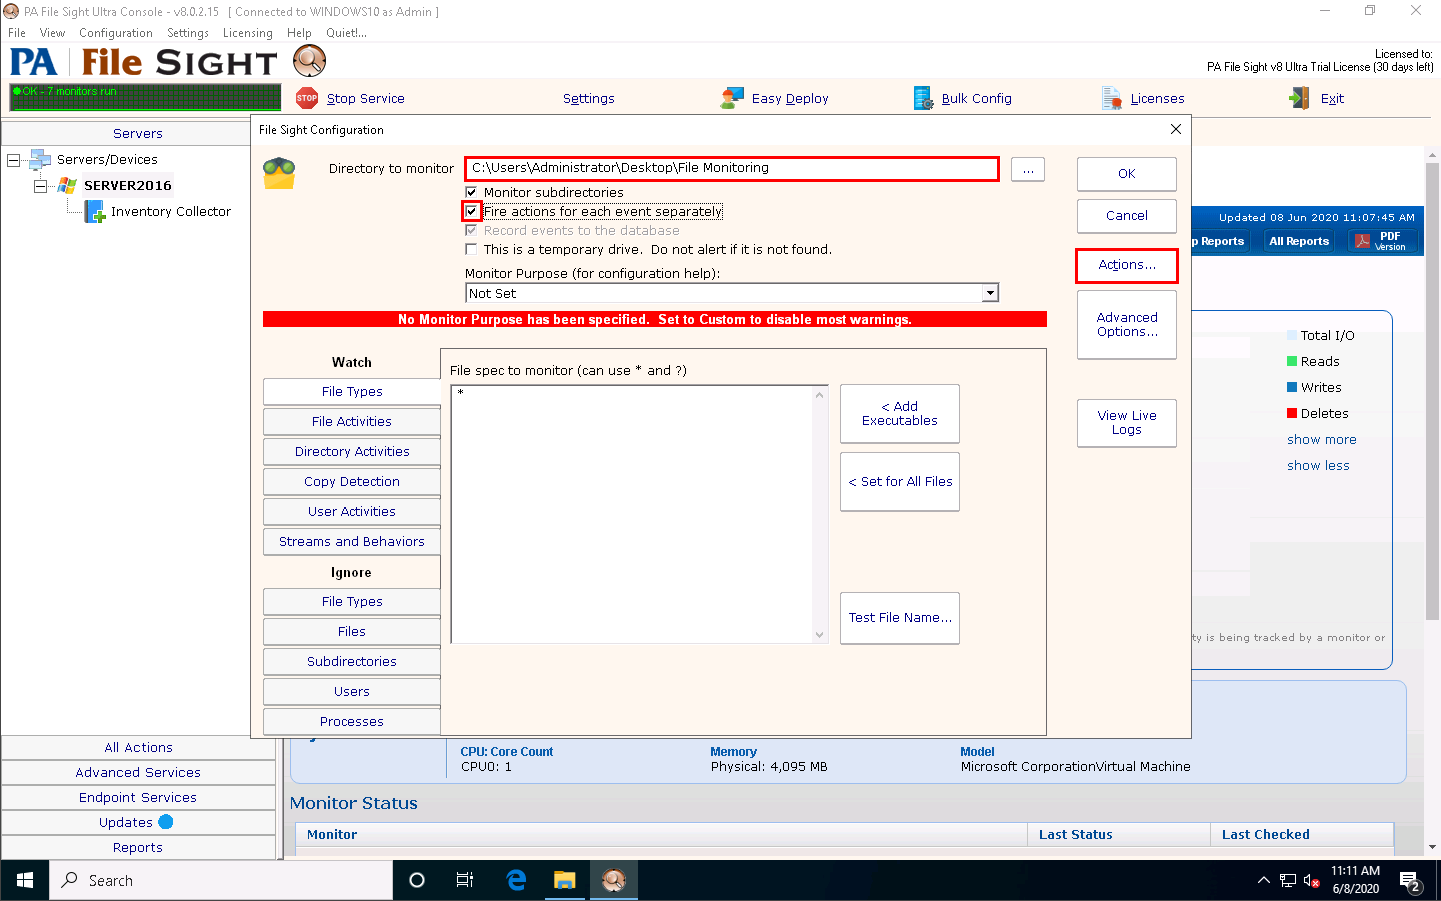
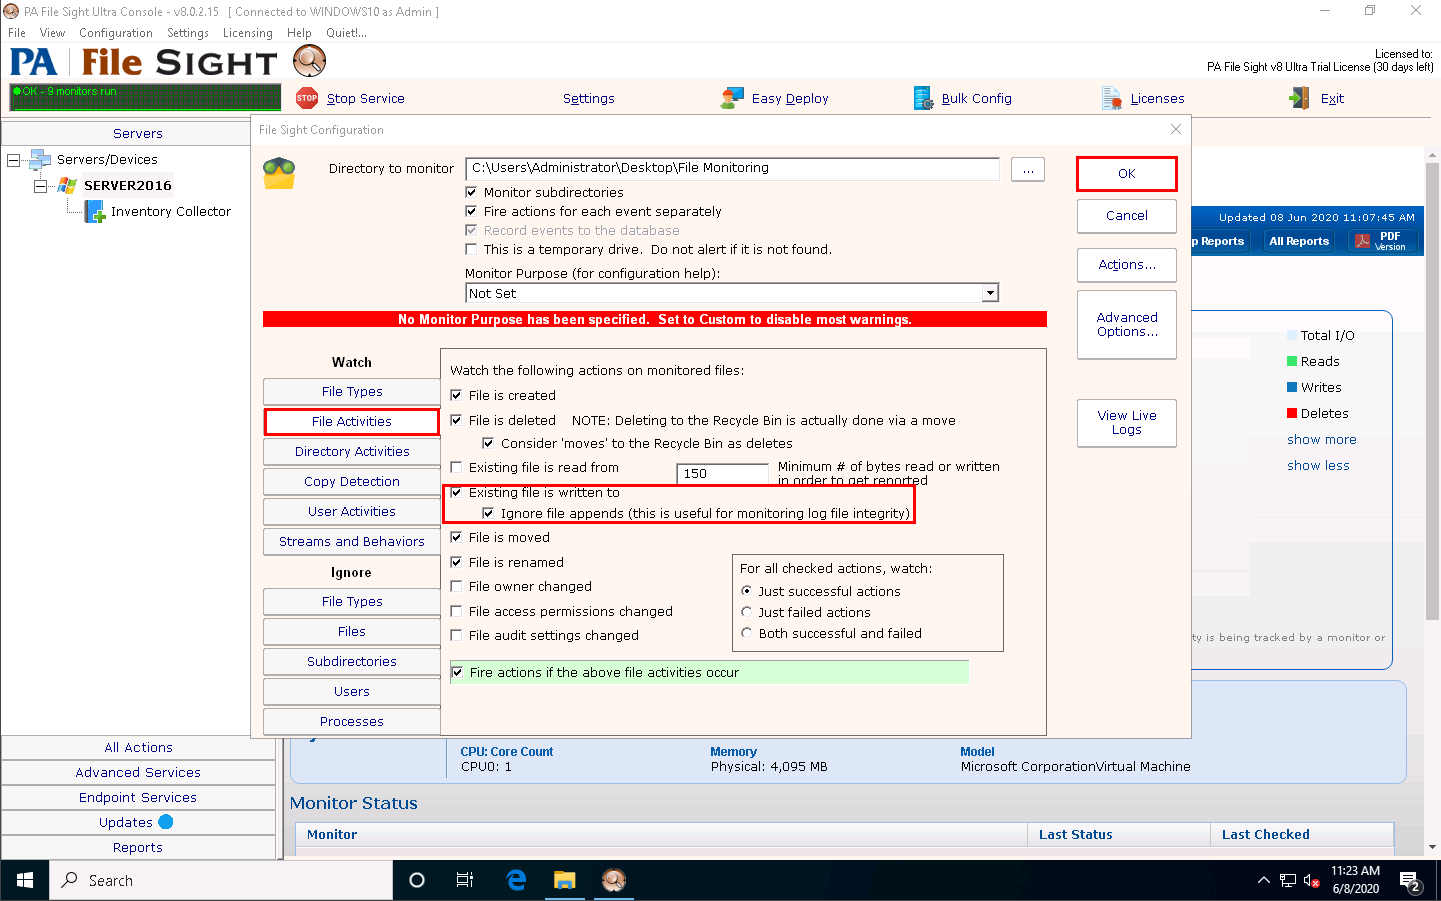
The File Sight Configuration window appears; click the Browse button to provide a path for directory monitoring for the SERVER2016 machine (here, C:\users\Administrator\Desktop\File monitoring) and tick the Fire actions for each event separately checkbox.
Choose Audit file activity from the Monitor Purpose (for configuration help) drop-down list, and then click Actions.
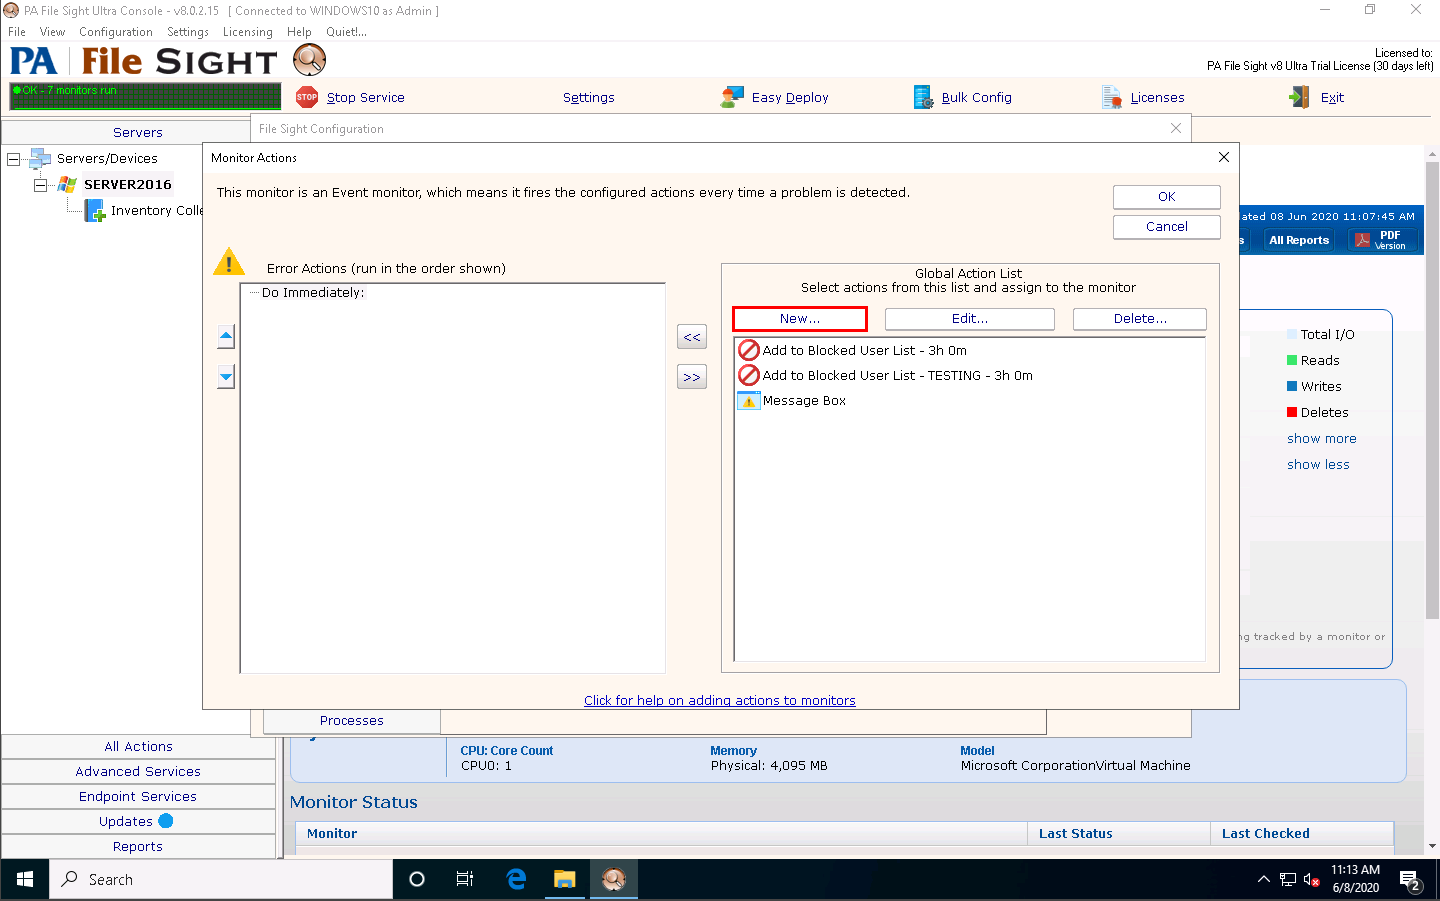
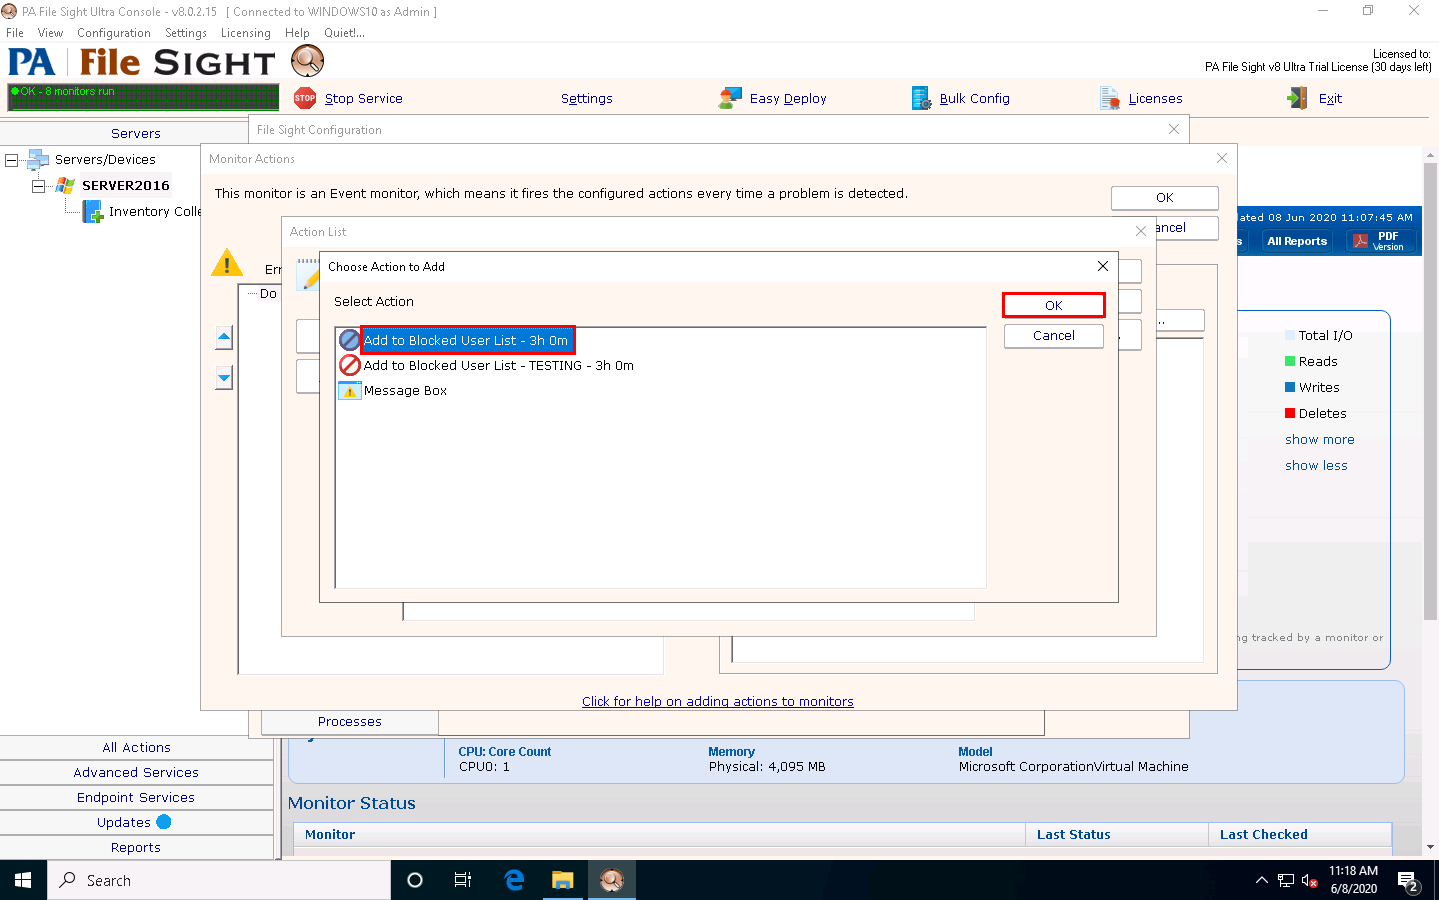
The Monitor Actions window appears; click New under Global Action List.
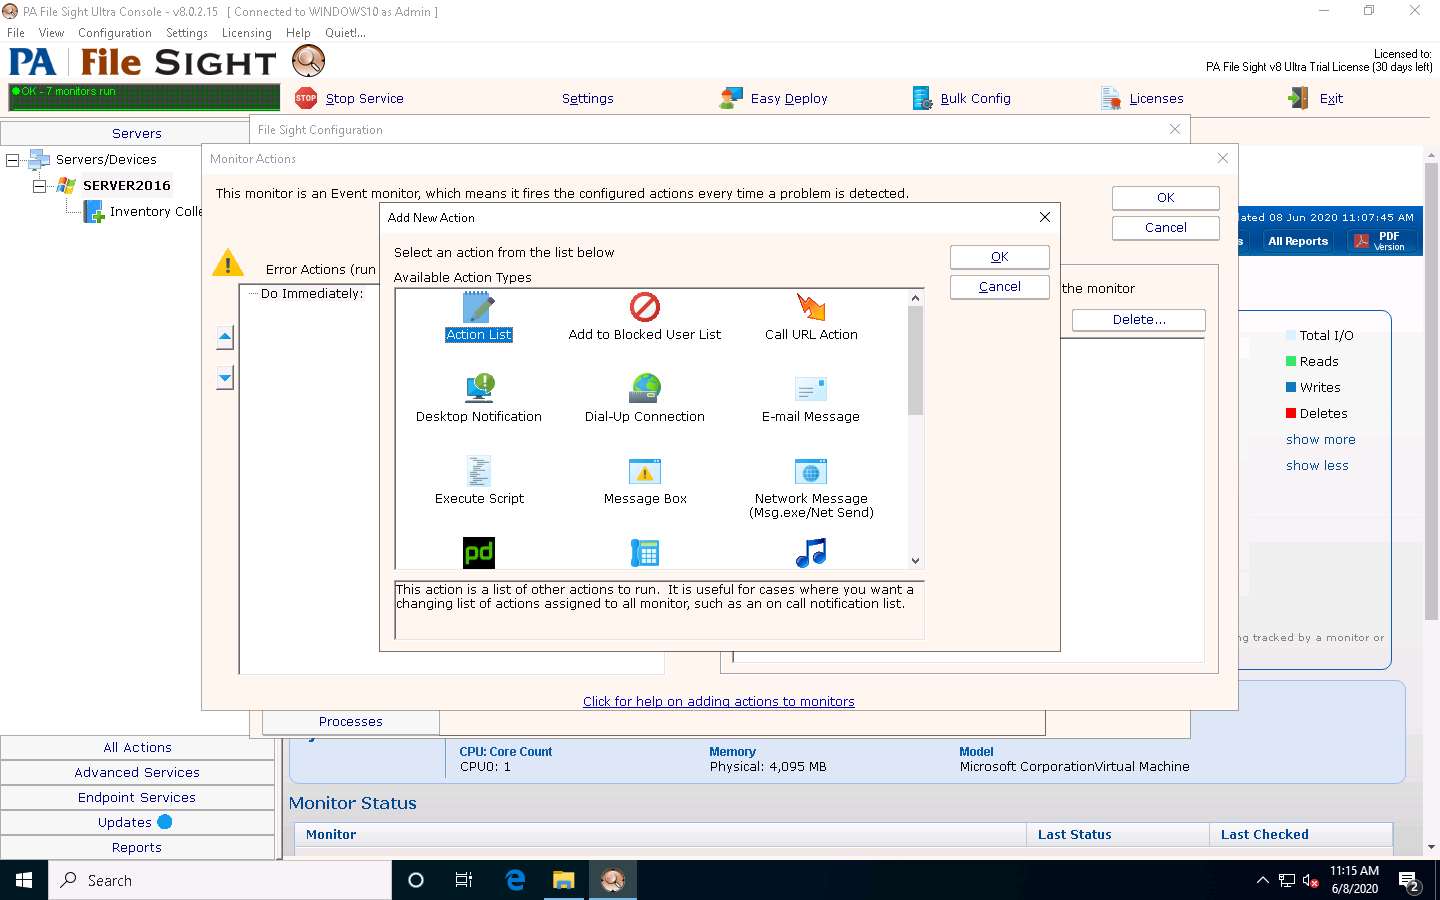
The Add New Action window appears. Select the Action List icon and click OK.
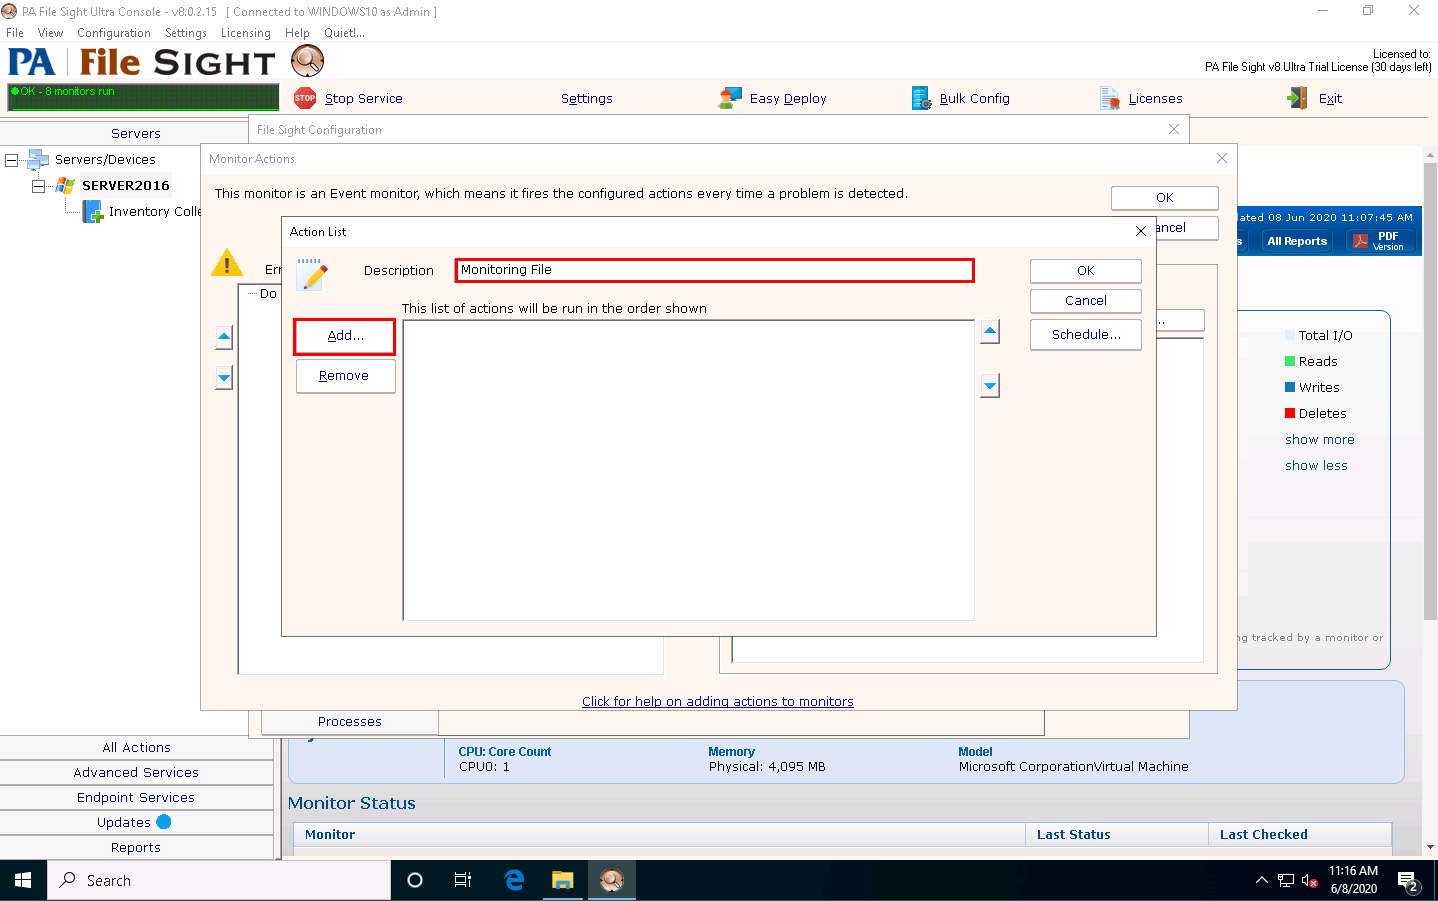
The Action List window appears. Type a description in the Description field and click Add to choose actions.
The Choose Action to Add window appears; choose any action from the list and click OK.
Click OK in the Action List window.
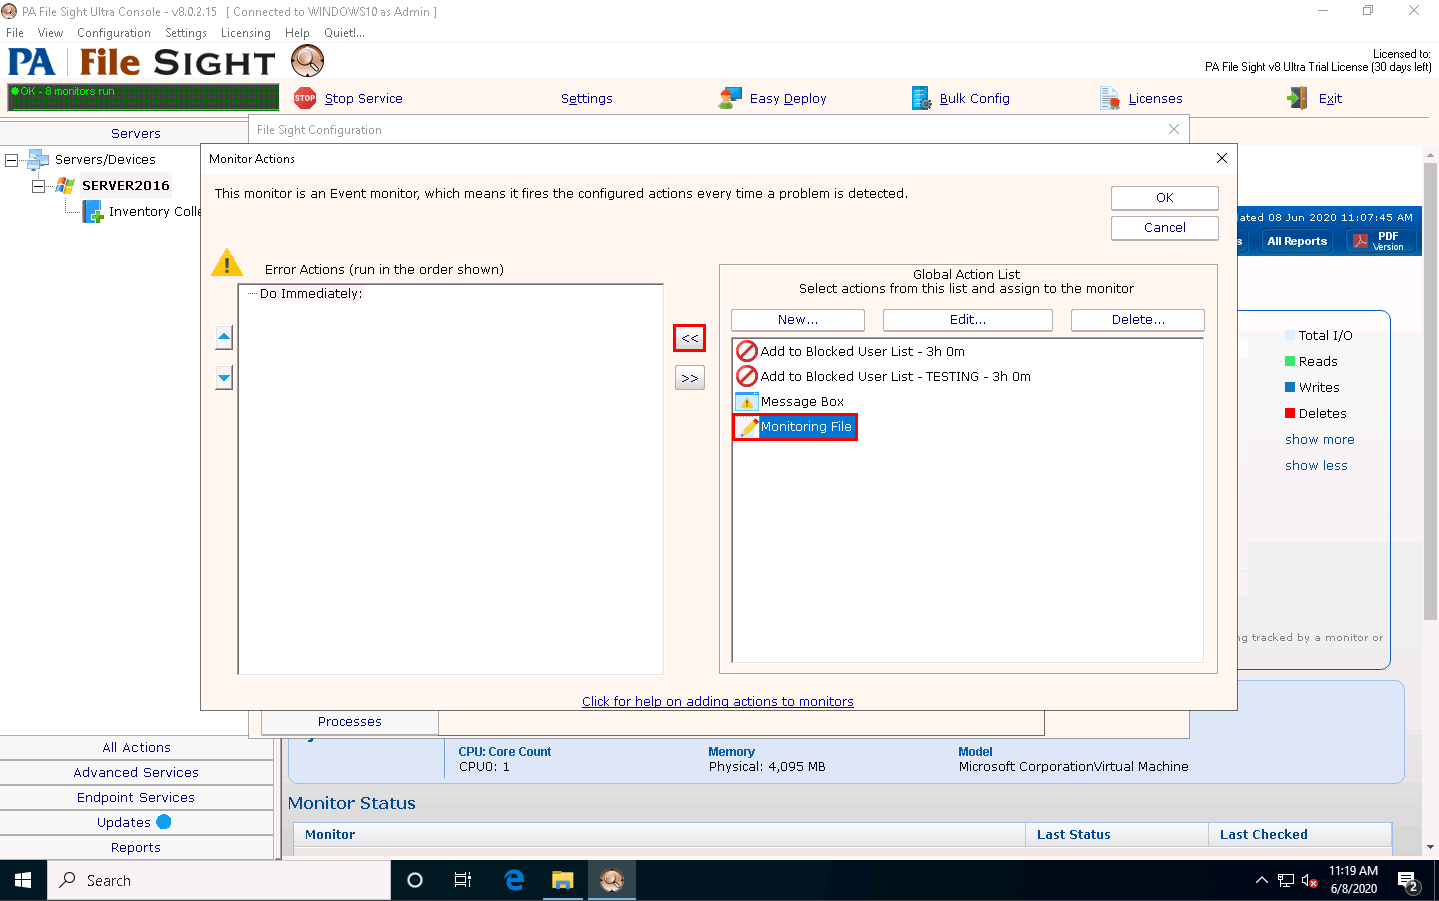
The Monitor Actions window appears; choose the newly created action (here, Monitoring File); and then click the << icon to add the action.
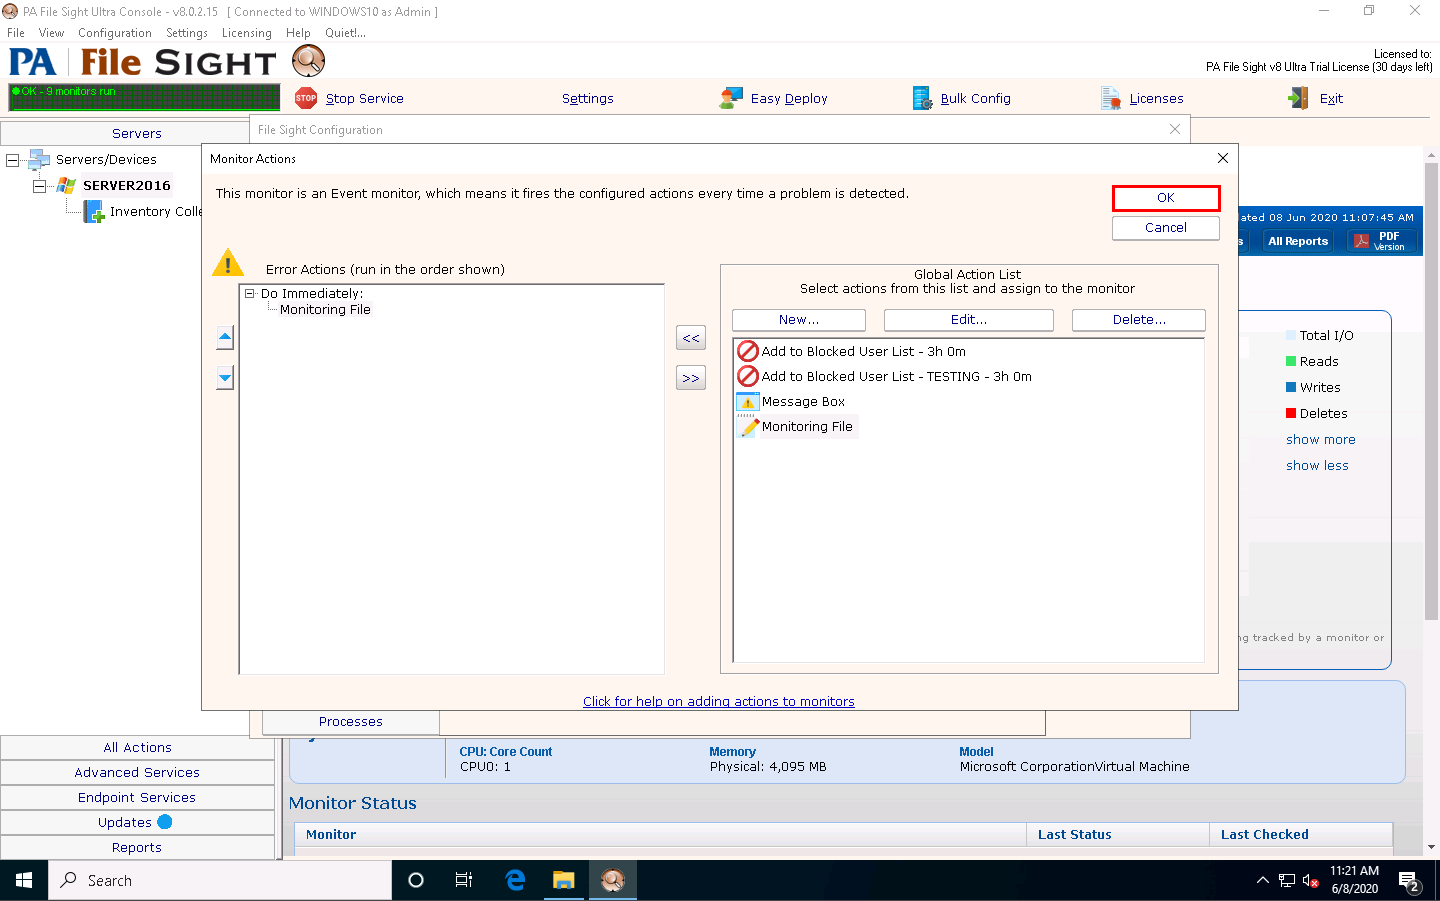
Once the action is added to the Monitor Actions window, click OK.
In the File Sight Configuration window, click the File Activities tab and check the Existing file is written to and Ignore file appends (this is useful for monitoring log file integrity) options. Leave the other settings to default and click OK.
Under the SERVER2016 node, File Sight Directory Monitoring will be added, as shown in the screenshot. Click Apply, and then right-click on the File Monitoring node and click Run Now! from the context menu.
Click the SERVER2016 node to view the dashboard. Scroll down in the dashboard; observe that the File Monitoring directory is being monitored.
Click Windows Server 2016 to switch to the Windows Server 2016 machine Click Ctrl+Alt+Delete to activate the machine, by default, CEH\Administrator account is selected, click Pa$$w0rd to enter the password and press Enter. Open Secret.txt in the File Directory on Desktop, modify some of the text in the file, and then Save and close the file.
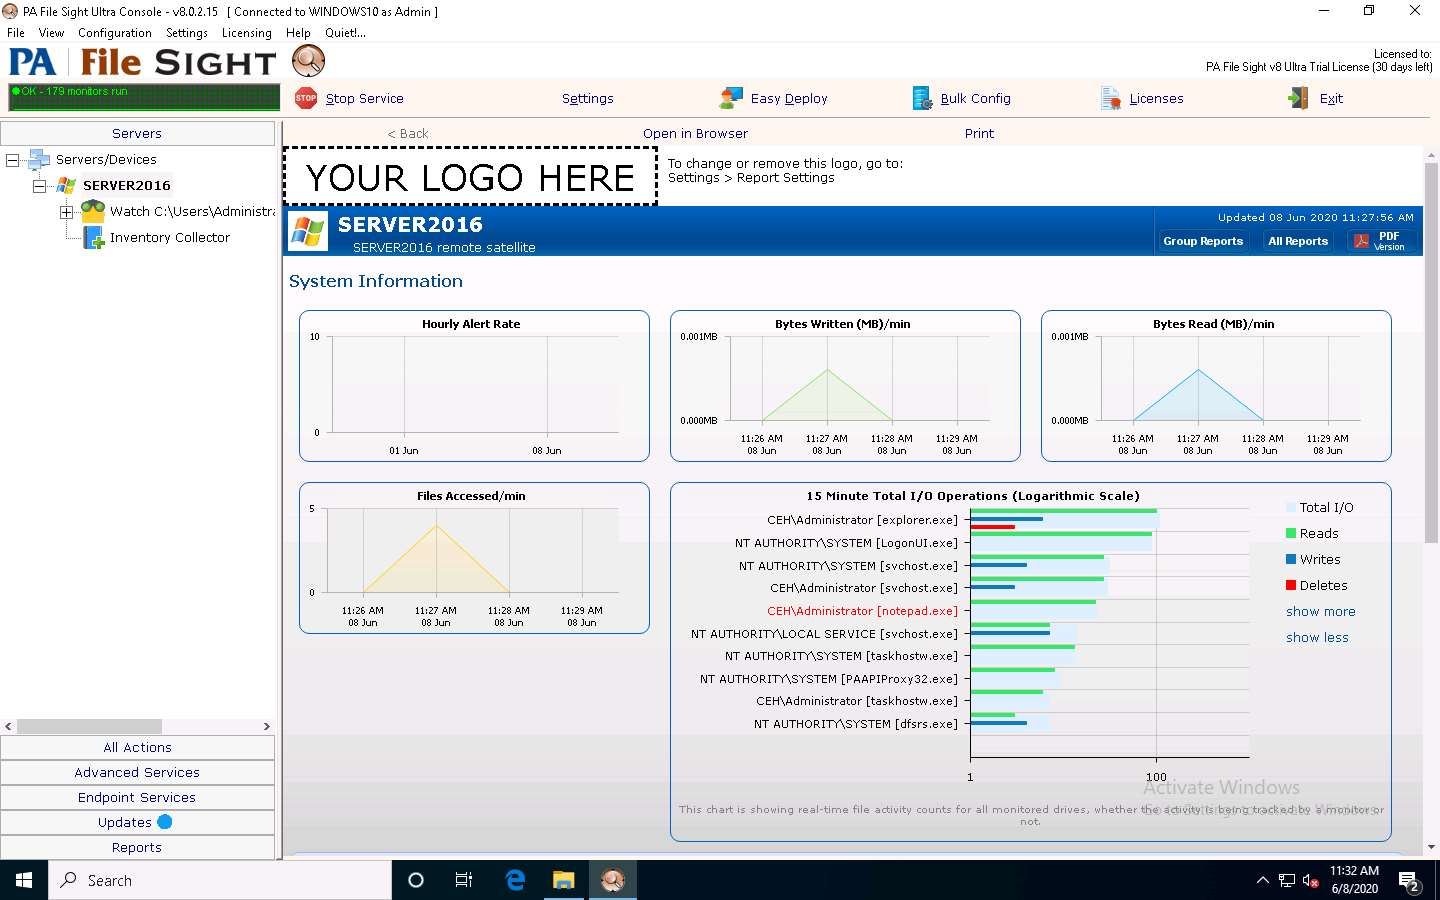
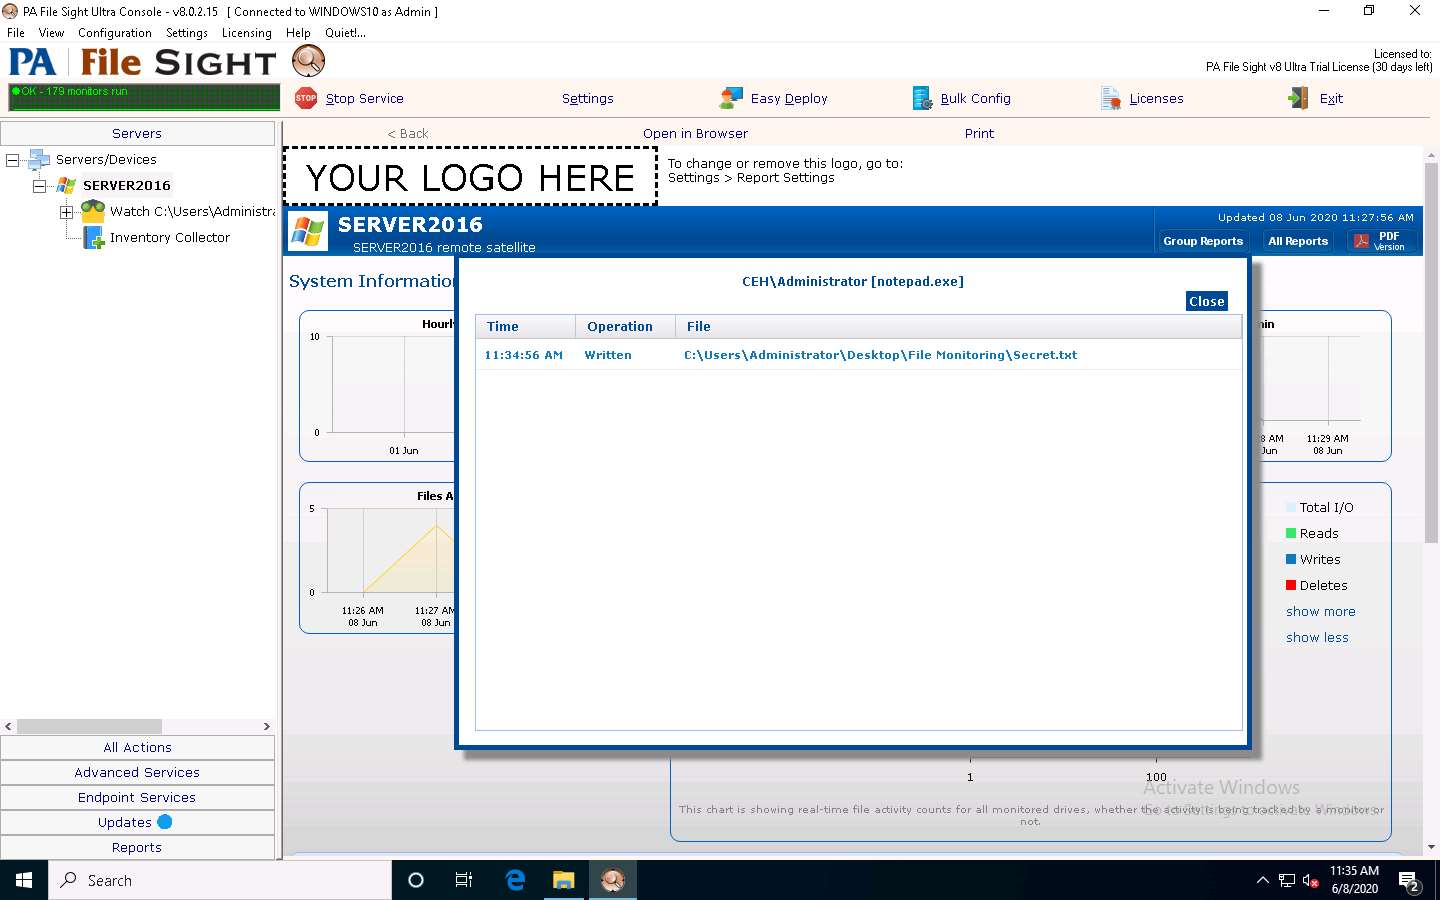
Click Windows 10 to switch back to the Windows 10 machine and observe that PA File Sight has recorded some activity in the notepad file, as shown in the screenshot.
The software even shows the File Accessed/min in the graphical method, as shown in the screenshot.
Click on the notepad.exe link to view the activities done by the user.
The CEH\Administrator notepad.exe window appears. If it shows a blank window, then click Windows Server 2016 to switch to the Windows Server 2016 machine, type some content into the Secret.txt file, save the file, and then immediately click Windows 10 to switch back to the Windows 10 machine to view the activity.
If you have added some text in the Secret.txt file, you can view that in the activity window.
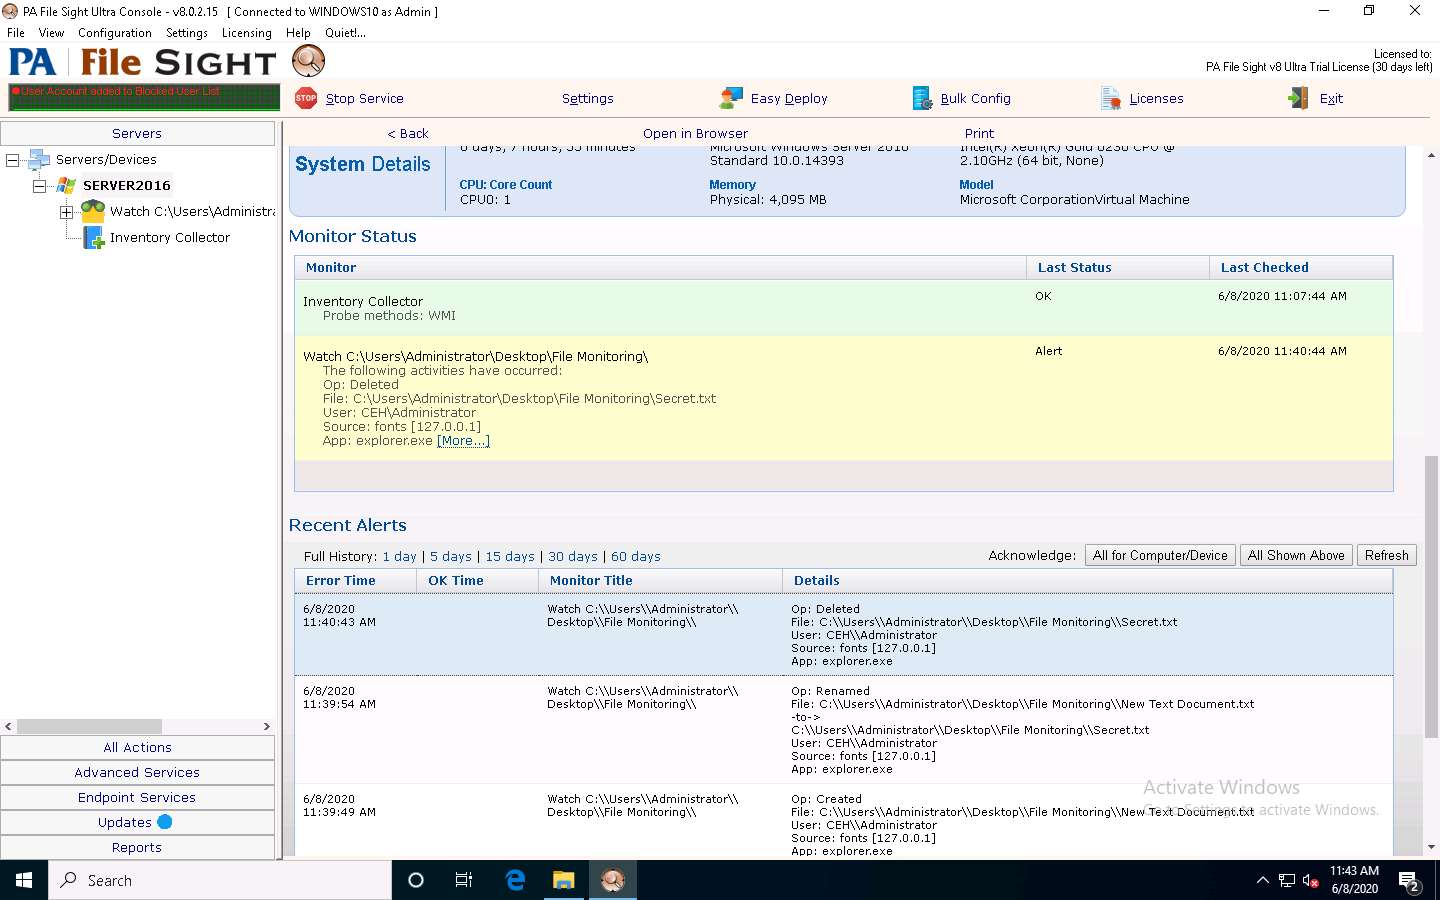
Click Windows Server 2016 to switch back to the Windows Server 2016 machine and delete the Secret.txt file, then click Windows 10 to switch back to the Windows 10 machine and scroll down to view the Recent Alerts section; you will find that the file has been deleted.
You can see all the actions performed on that file.
If you do not see the alerts, then click Refresh button to update alerts.
This is how to monitor the file integrity using PA File Sight.
Close all open windows.
You can also use other file and folder integrity checking tools such as Tripwire File Integrity and Change Manager (https://www.tripwire.com), Netwrix Auditor (https://www.netwrix.com), Verisys (https://www.ionx.co.uk), or CSP File Integrity Checker (https://www.cspsecurity.com) to perform file and folder monitoring.
Task 8: Perform Device Driver Monitoring using DriverView and Driver Booster
When the user downloads infected drivers from untrusted sources, the system installs malware along with the device drivers; malware uses these drivers as a shield to avoid detection. One can scan for suspicious device drivers using tools such as DriverView and Driver Booster that verify if they are genuine and downloaded from the publisher’s original site.
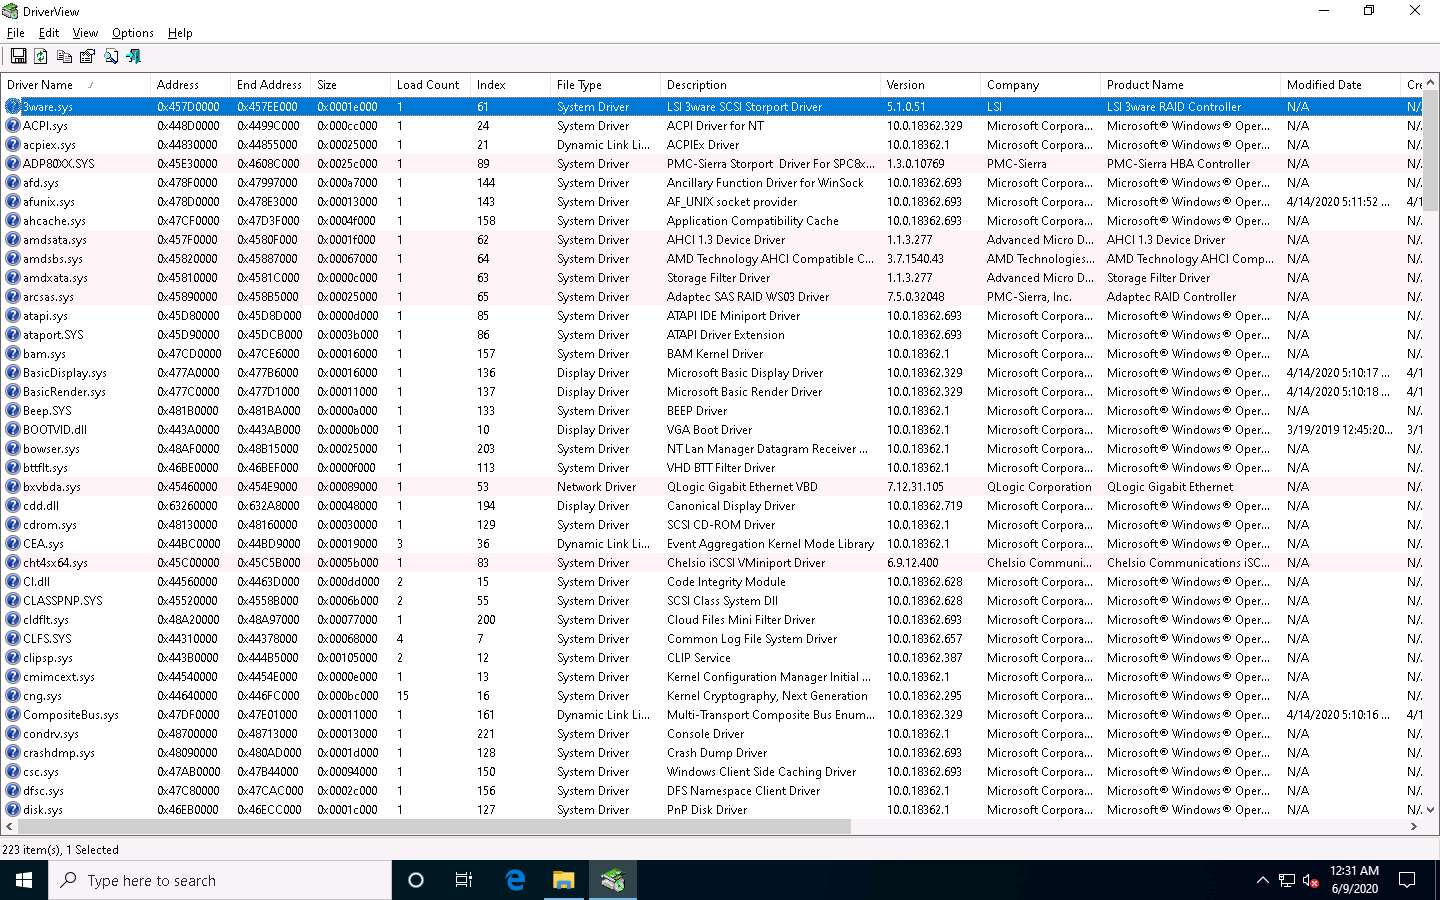
DriverView The DriverView utility displays a list of all device drivers currently loaded on the system. For each driver in the list, additional information is displayed such as the load address of the driver, description, version, product name, and developer.
Driver Booster Without proper drivers, computers start to misbehave. Sometimes updating the drivers using conventional methods can be a daunting task. Outdated drivers are more vulnerable to hacking and can lead to a breach in the system. Driver Booster provides a better way of updating the drivers with its all-in-one command center with automatic backup and updates, which helps the smooth functioning of the system.
An ethical hacker and penetration tester must scan the system for suspicious device drivers and make sure that the systems runs smoothly by ensuring that all outdated drivers are updated and that the system processes optimized to keep the performance of the system at its peak.
On the Windows 10 machine, navigate to D:\CEH-Tools\CEHv11 Module 07 Malware Threats\Malware Analysis Tools\Dynamic Malware Analysis Tools\Device Drivers Monitoring Tools\DriverView and double-click DriverView.exe to launch the application.
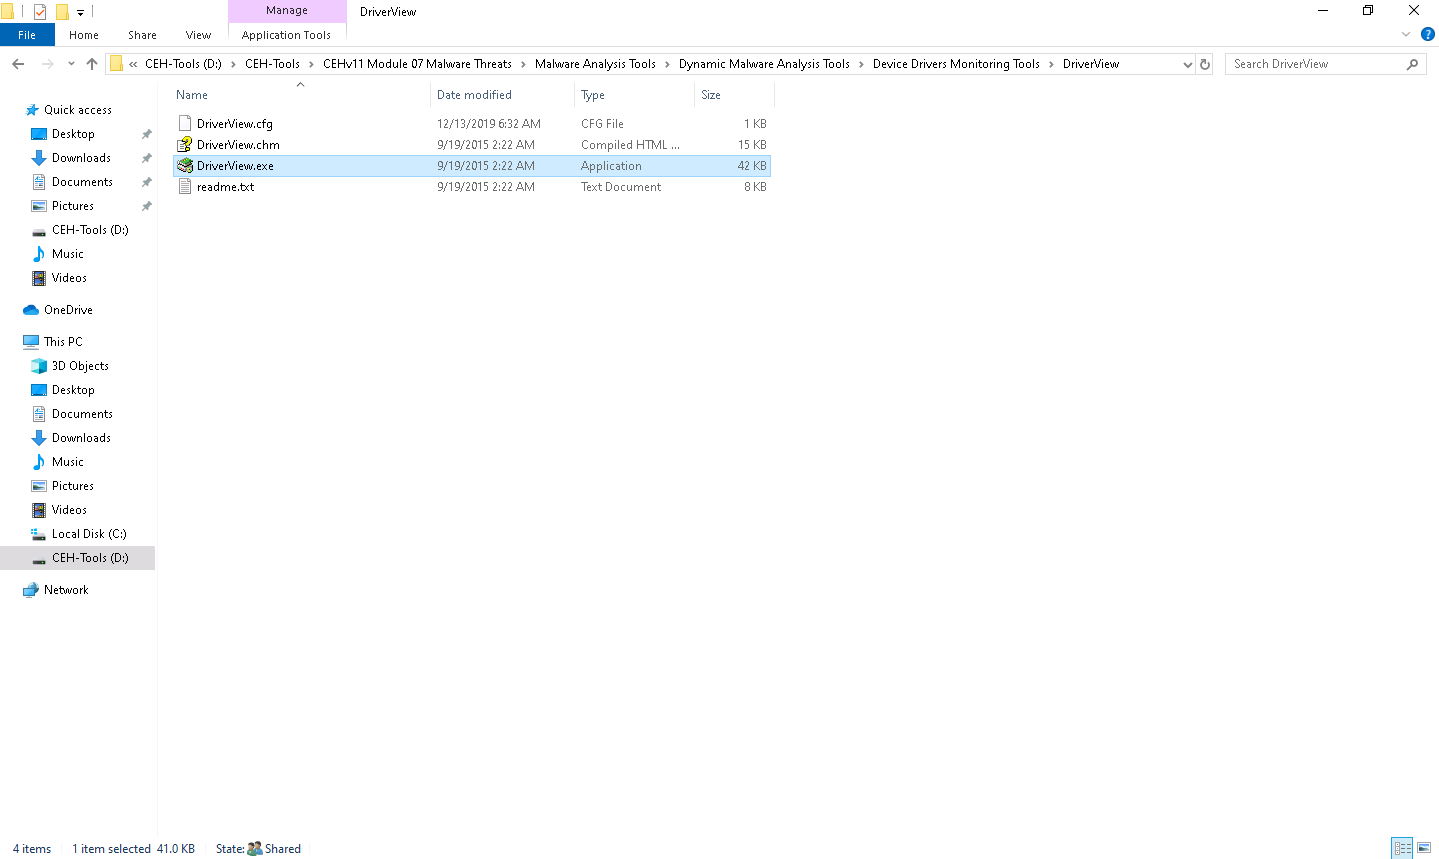
The DriverView main window appears with a list of the installed drivers on your system, as shown in the screenshot.
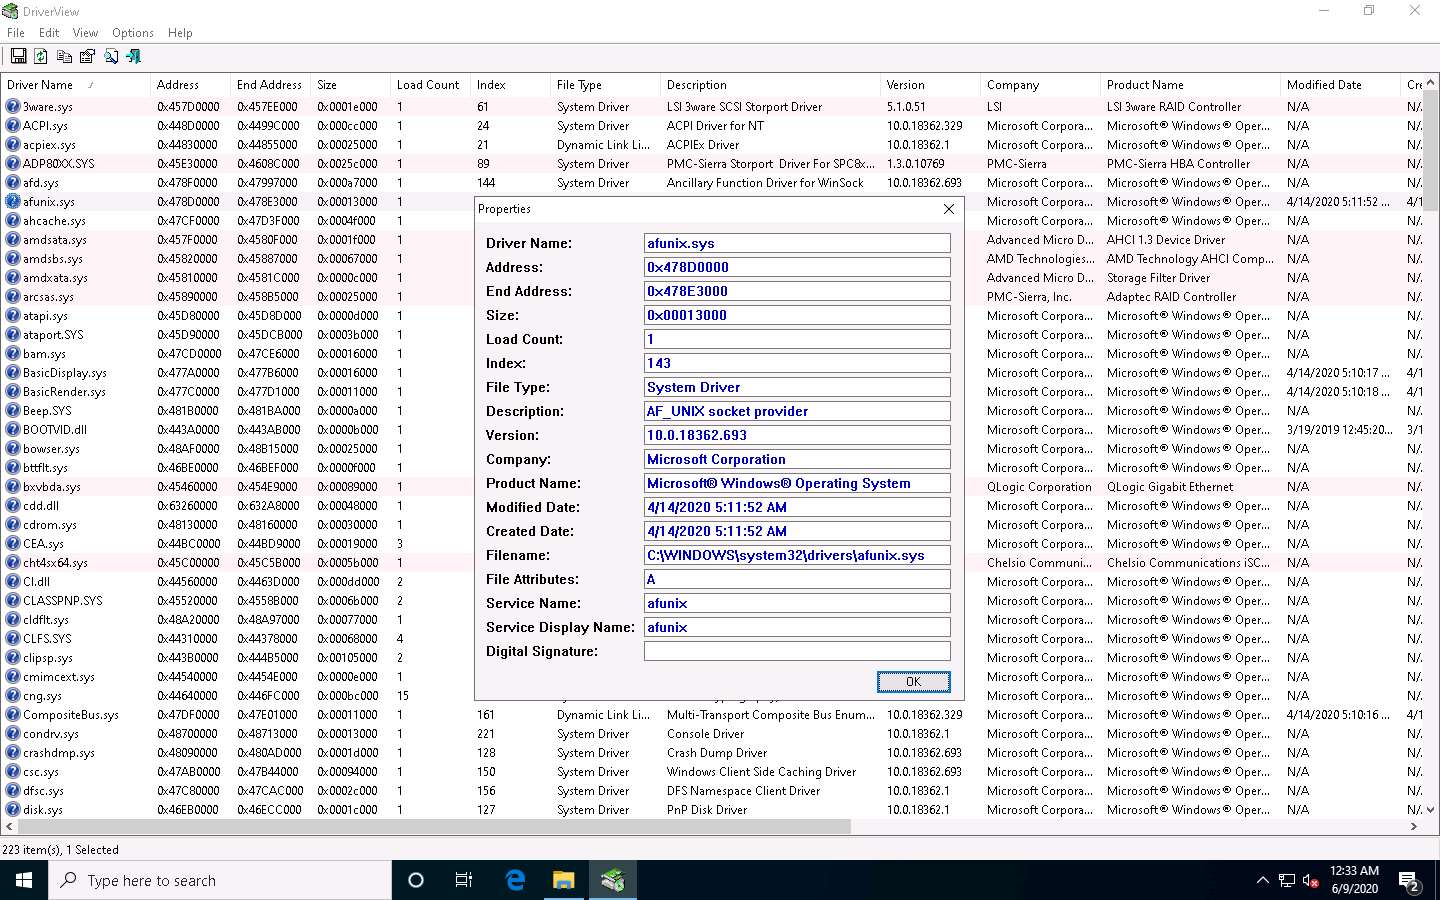
Right-click on any driver from the list and click Properties to view the complete details of the driver.
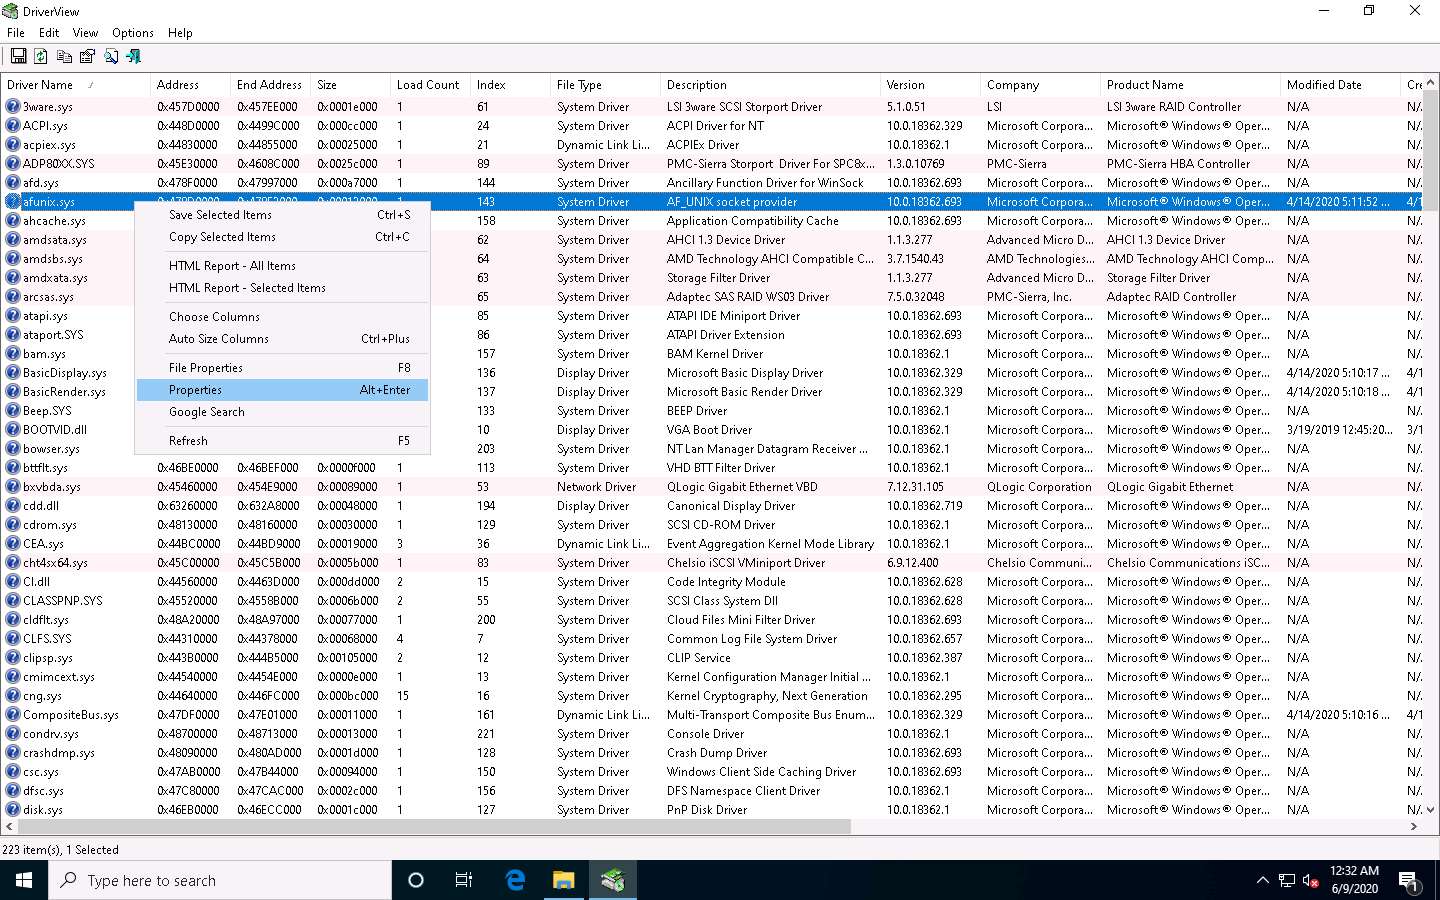
The Properties window appears with the complete details of the installed driver, as shown in the screenshot. Once the analysis is done, click OK.
This is how to monitor the drivers installed on a machine. Close the DriverView window.
Now, we will see how to update system drivers and optimize the PC performance using Driver Booster.
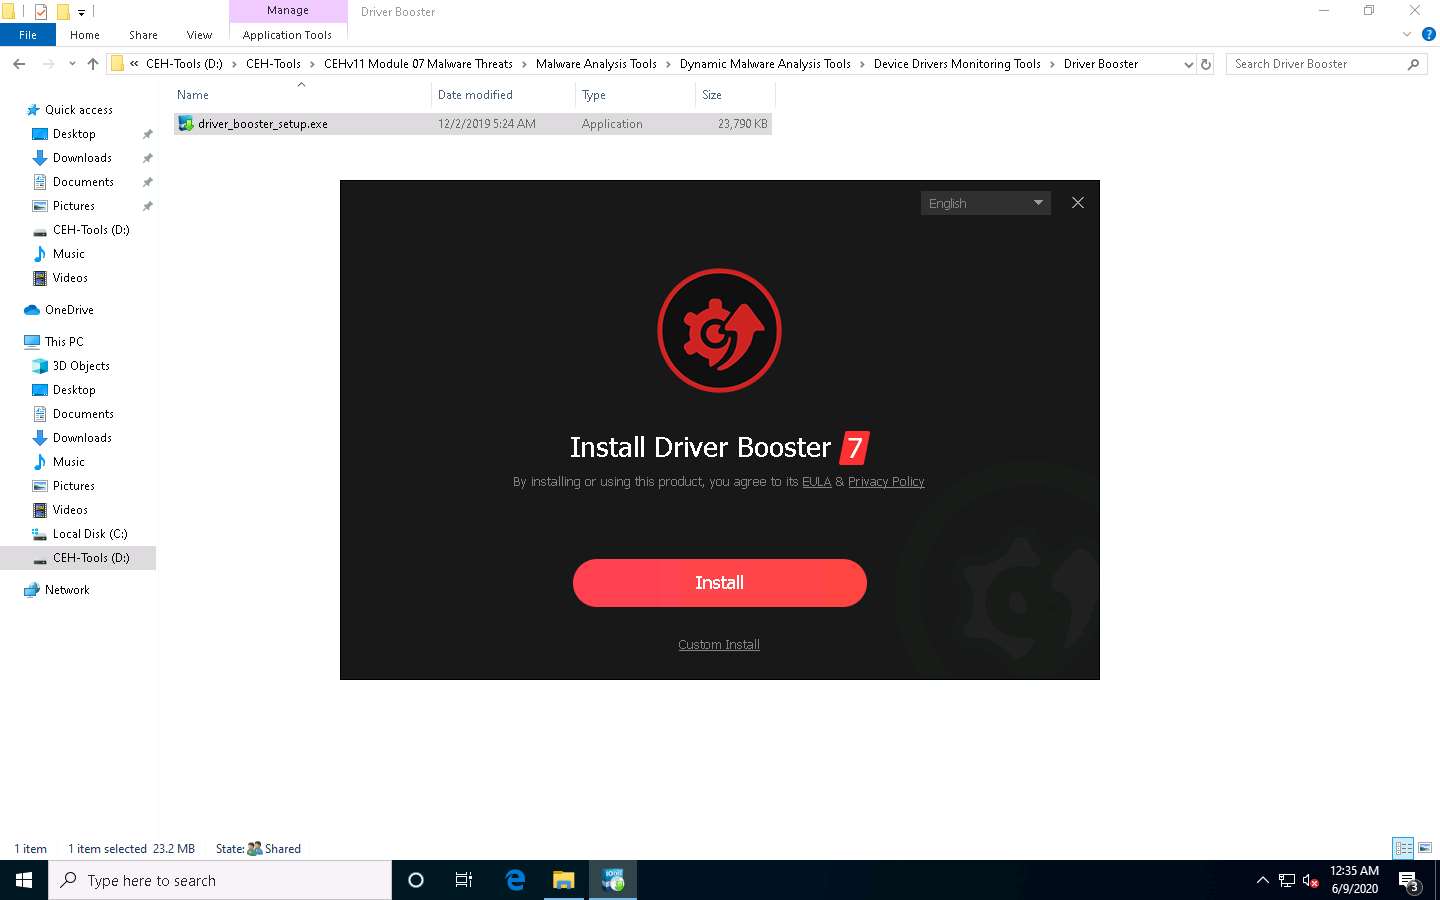
On Windows 10, navigate to D:\CEH-Tools\CEHv11 Module 07 Malware Threats\Malware Analysis Tools\Dynamic Malware Analysis Tools\Device Drivers Monitoring Tools\Driver Booster. Double-click driver_booster_setup.exe to launch the setup.
If a User Account Control window appears, click Yes.
The Install Driver Booster window appears; click Install to start the installation process.
If IObit Malware Fighter wizard appears, select No, thanks and click Next.
The program starts to install on your system.
If an Opera wizard appears, select the No, thanks radio button and click Next.
The Subscribe to IObit Newsletter window appears; click No, thanks.
The Installation completed window appears after a successful installation; click Scan Now.
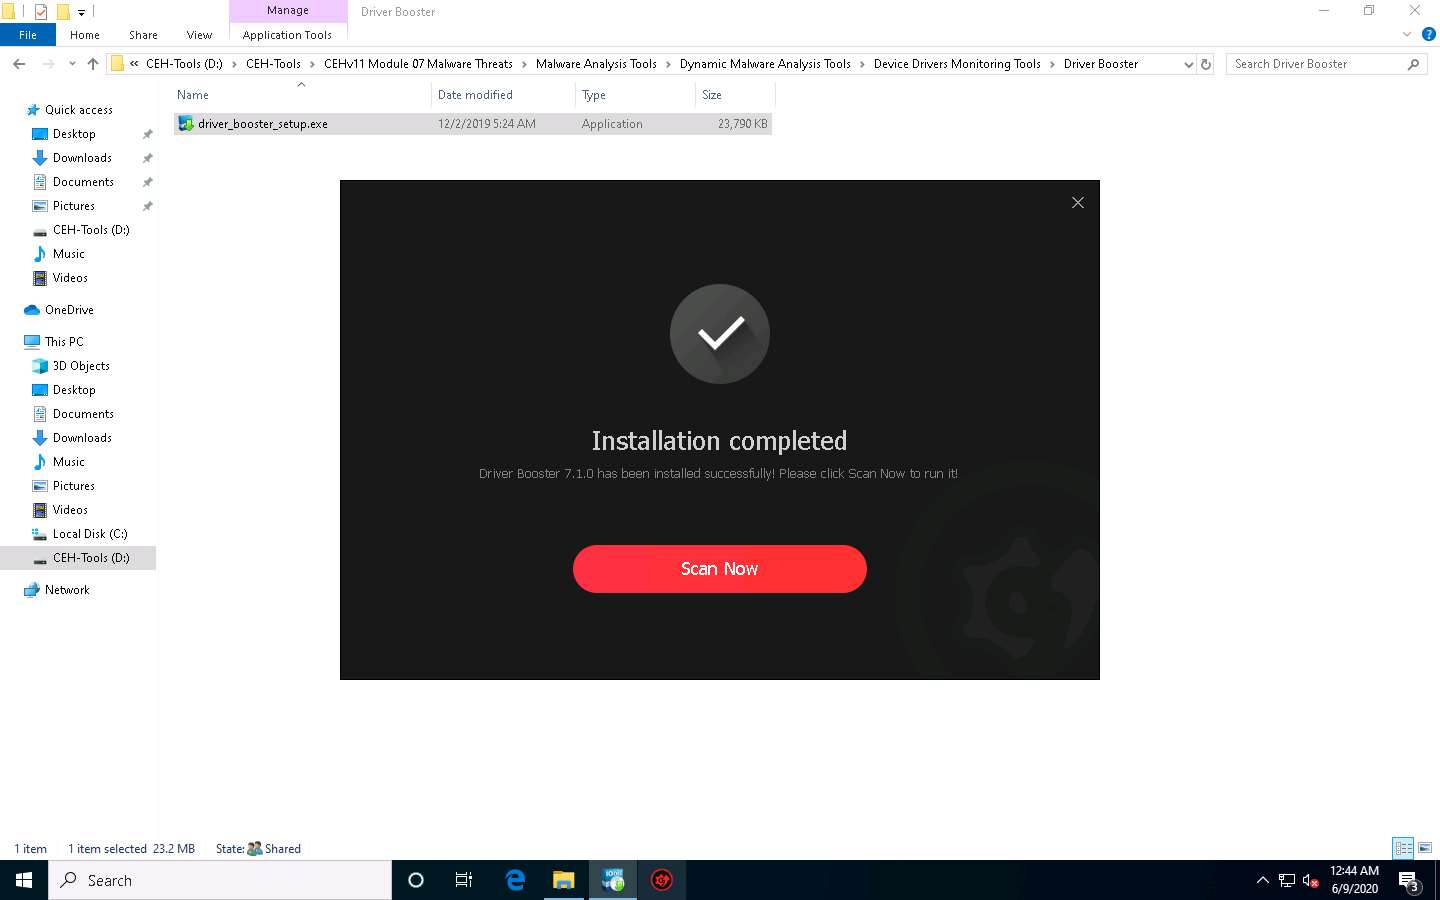
Driver Booster starts scanning the system for outdated or missing drivers, as shown in the screenshot.
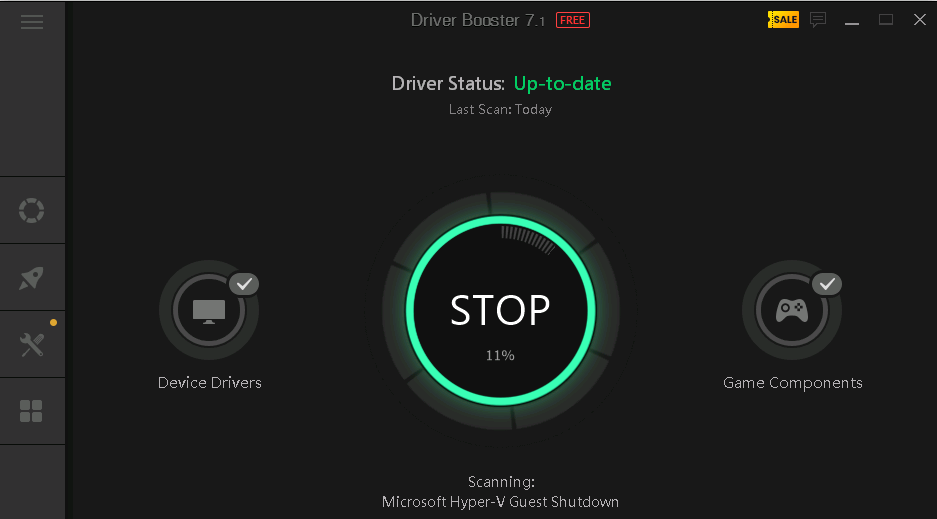
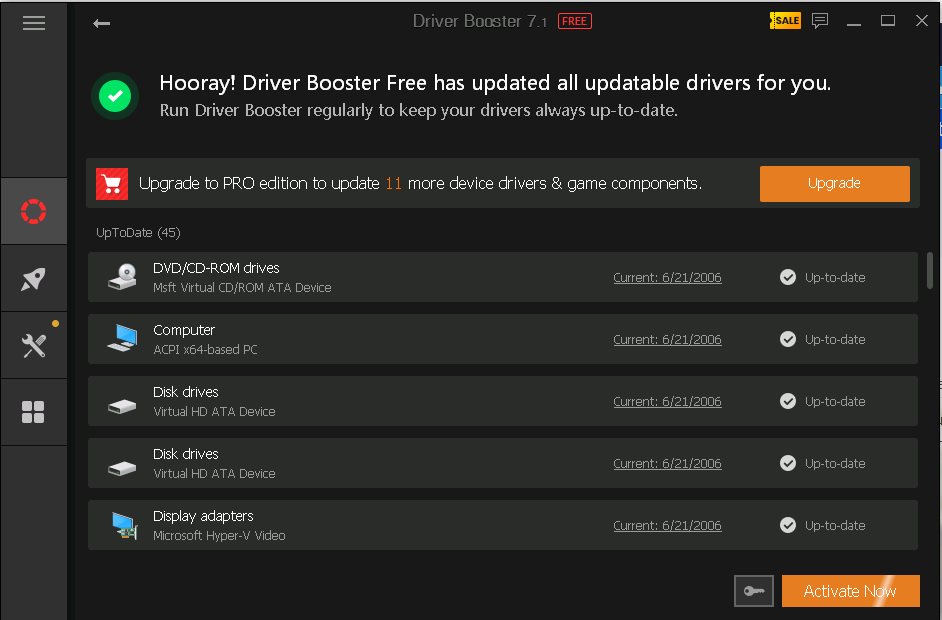
Close the pop-up window. Driver Booster scans all available drivers on the machine, and if any outdated driver is installed, the software alerts you. Install the updated driver version.
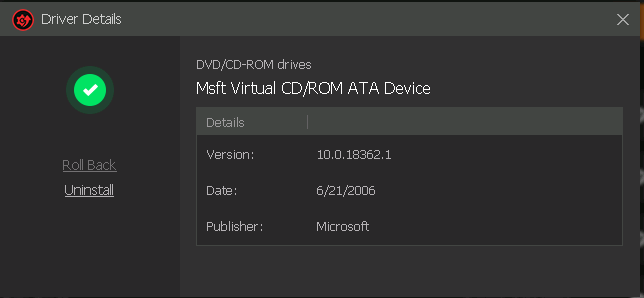
To get information about an installed driver, click the link, as shown in the screenshot.
The Driver Details window appears, showing the driver information. Here you can Roll Back a faulty driver or Uninstall it completely. Read all the details and close the window.
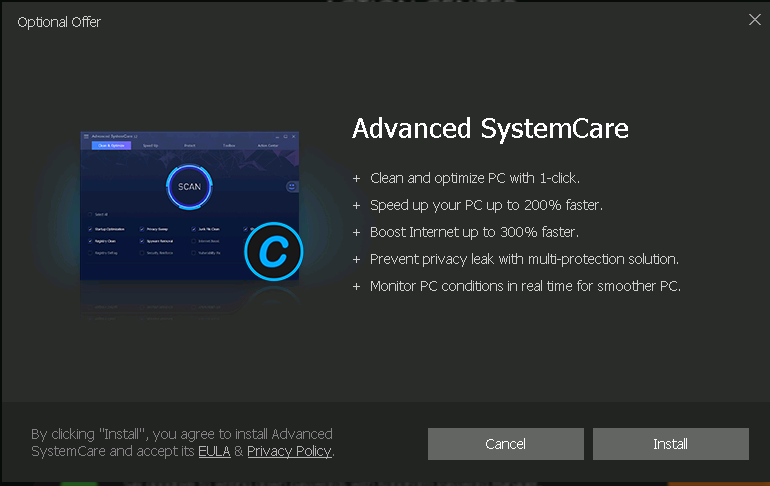
Click the Action Center icon from the left pane, and then click the Install now button for Advanced SystemCare.
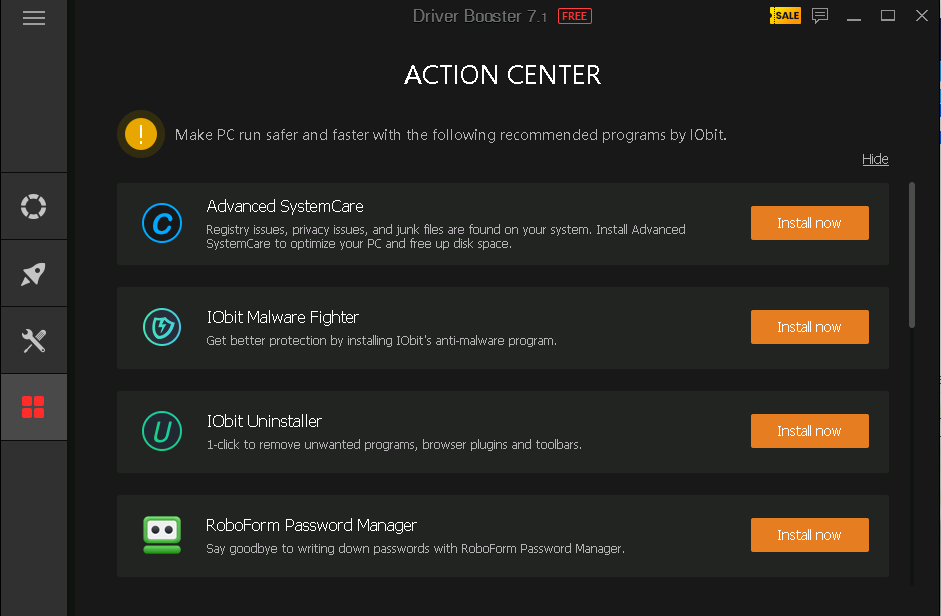
The Optional Offer window appears; click Install.
Advanced SystemCare is installed. Check the Select All checkbox, and then click Scan, as shown in the screenshot.
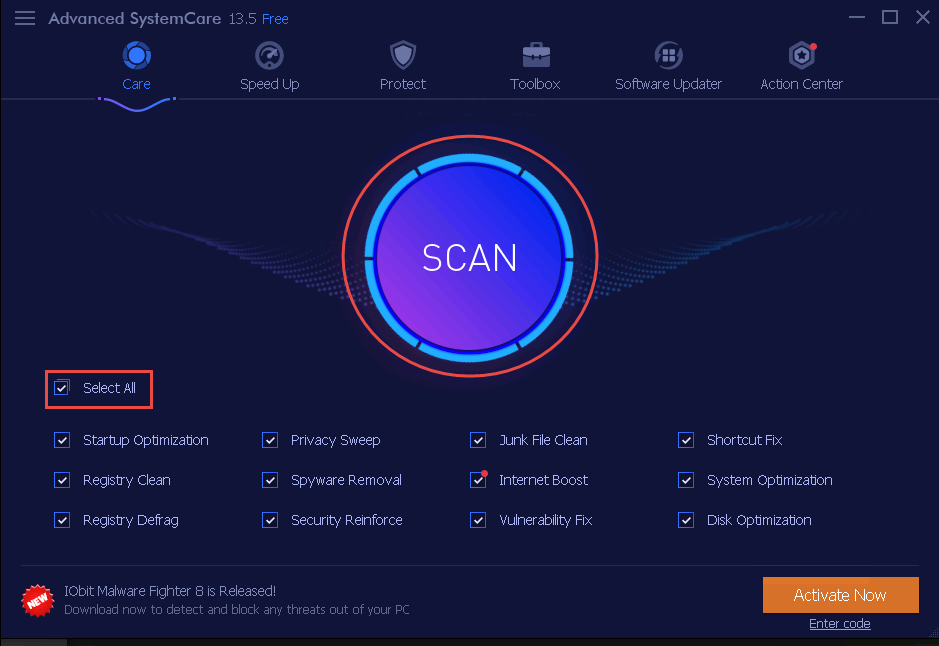
The application starts scanning the computer, as shown in the screenshot.
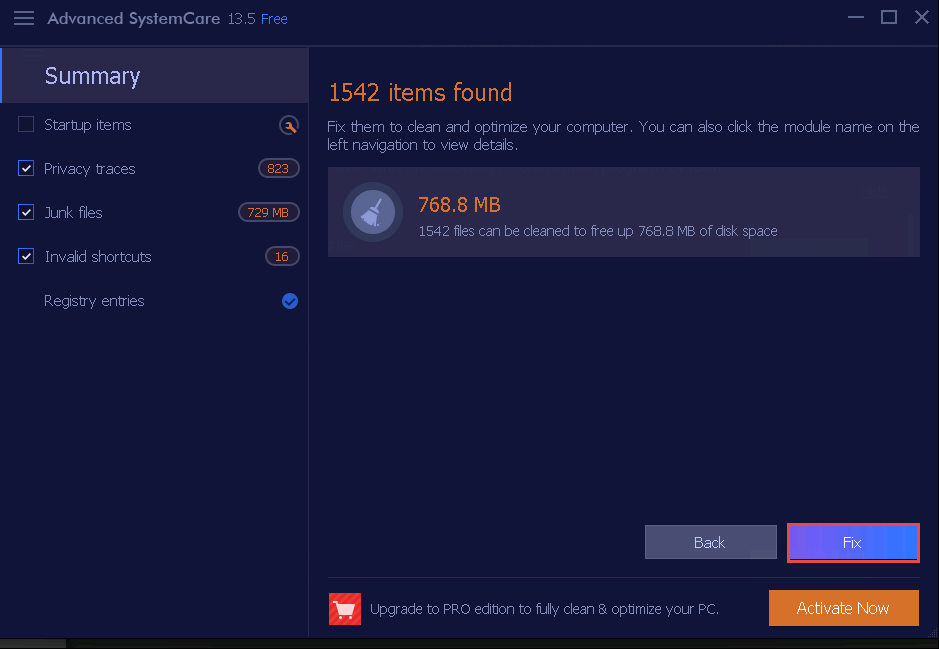
As it takes 10 to 15 minutes to complete, we have Stopped the scan.
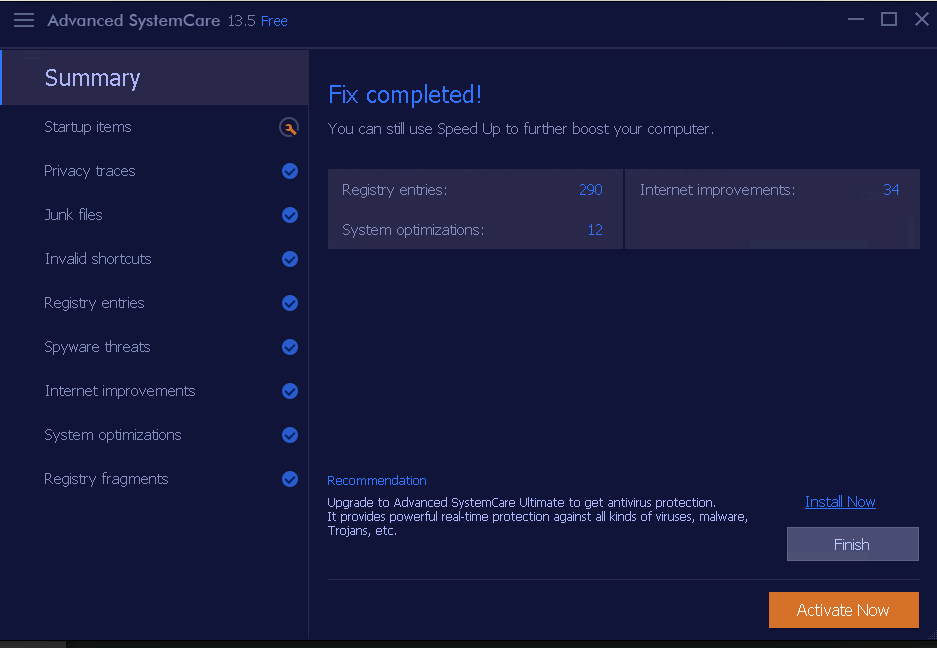
Once the scan finishes, a Summary is shown, as shown in the screenshot. Click the Fix button in the bottom-right corner to resolve the discovered PC issues.
The application starts to fix the PC issues found, as shown in the screenshot.
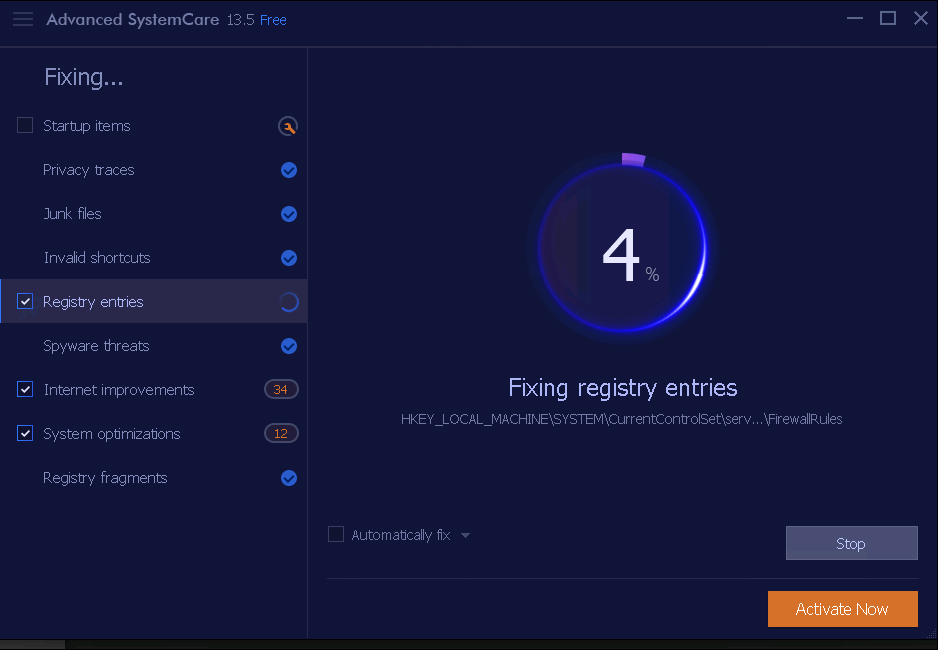
After the process is complete, the Fix completed! window appears, showing Your current PC health status, as shown in the screenshot. Analyze the results and close the application.
Close all open windows.
You can also use other device driver monitoring tools such as Driver Reviver (https://www.reviversoft.com), Driver Easy (https://www.drivereasy.com), Driver Fusion (https://treexy.com), or Driver Genius (http://www.driver-soft.com) to perform device driver monitoring.
Task 9: Perform DNS Monitoring using DNSQuerySniffer
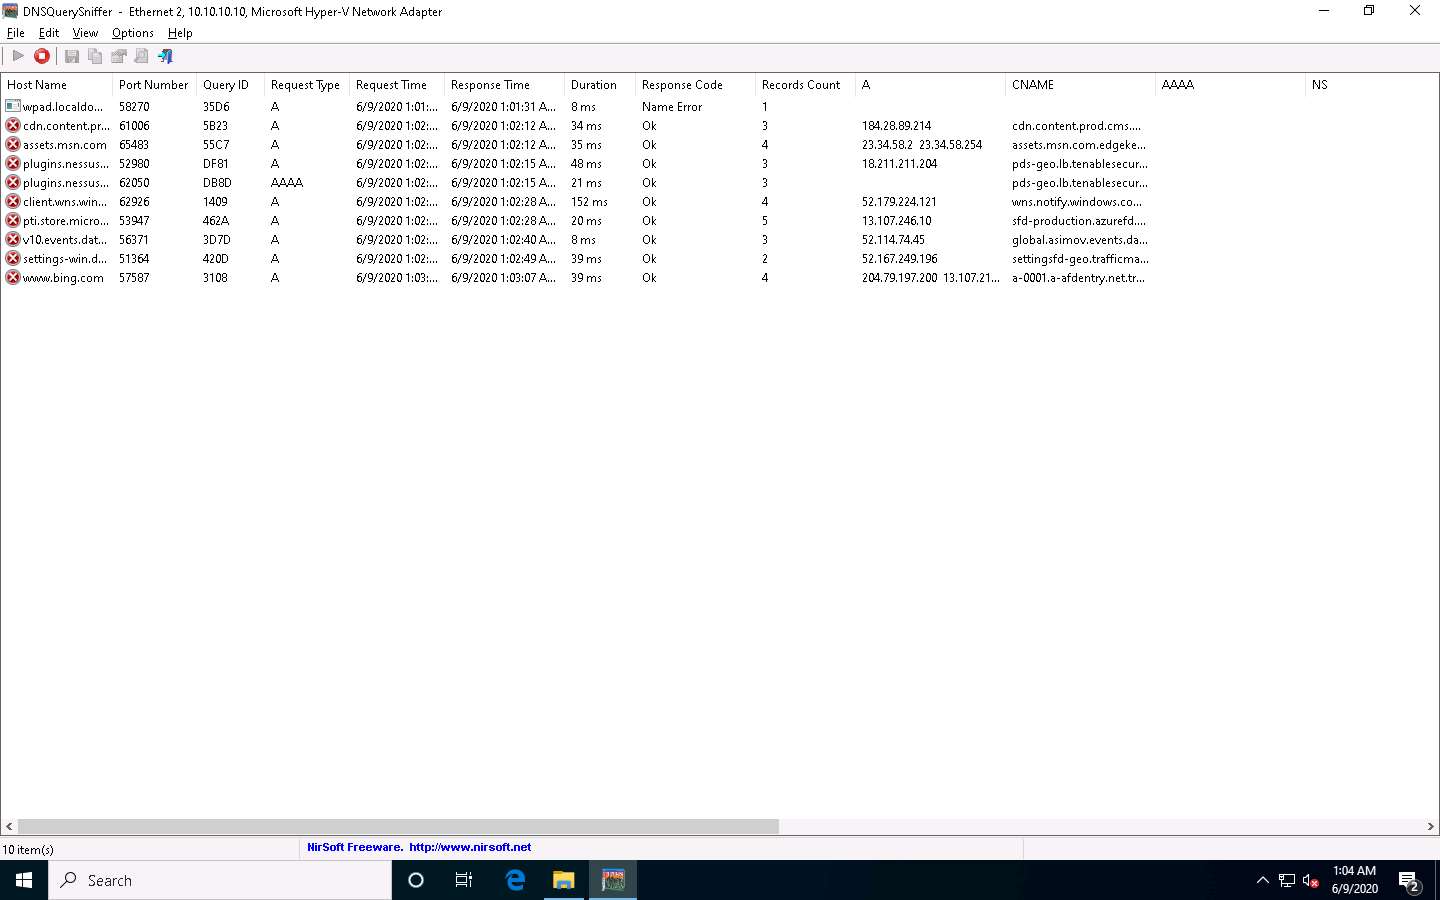
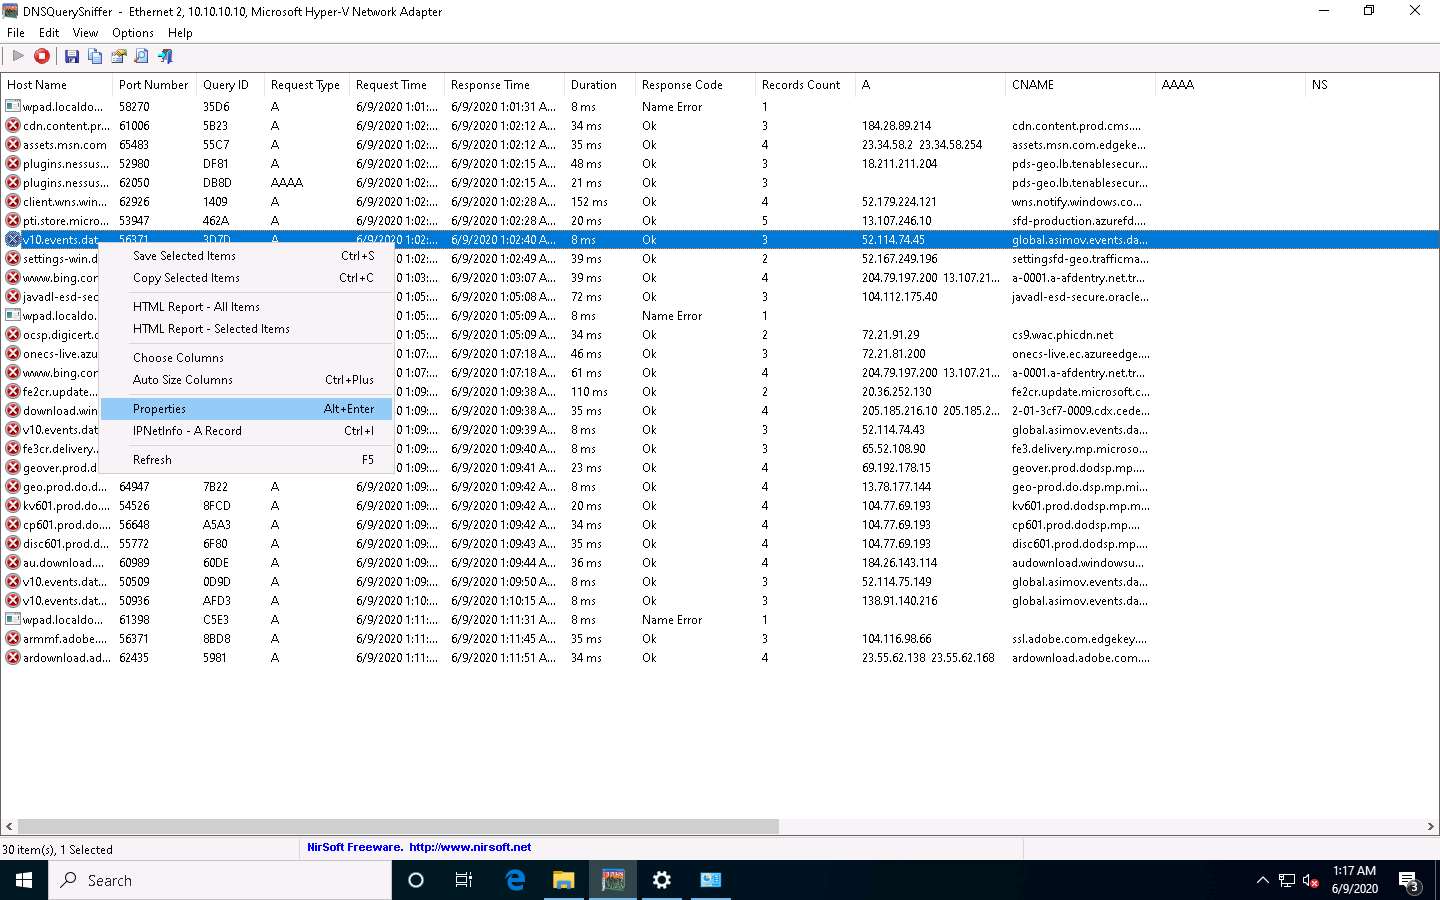
DNSQuerySniffer is a network sniffer utility that shows the DNS queries sent on your system. For every DNS query, the following information is displayed: Host Name, Port Number, Query ID, Request Type (A, AAAA, NS, MX, and other types), Request Time, Response Time, Duration, Response Code, Number of records, and the content of the returned DNS records. You can easily export the DNS query information to a CSV, tab-delimited, XML, or HTML file, or copy the DNS queries to the clipboard and then paste them into Excel or another spreadsheet application.
On the Windows 10 machine, navigate to D\CEH-Tools\CEHv11 Module 07 Malware Threats\Malware Analysis Tools\Dynamic Malware Analysis Tools\DNS Monitoring Tools\DNSQuerySniffer, and then double-click DNSQuerySniffer.exe.
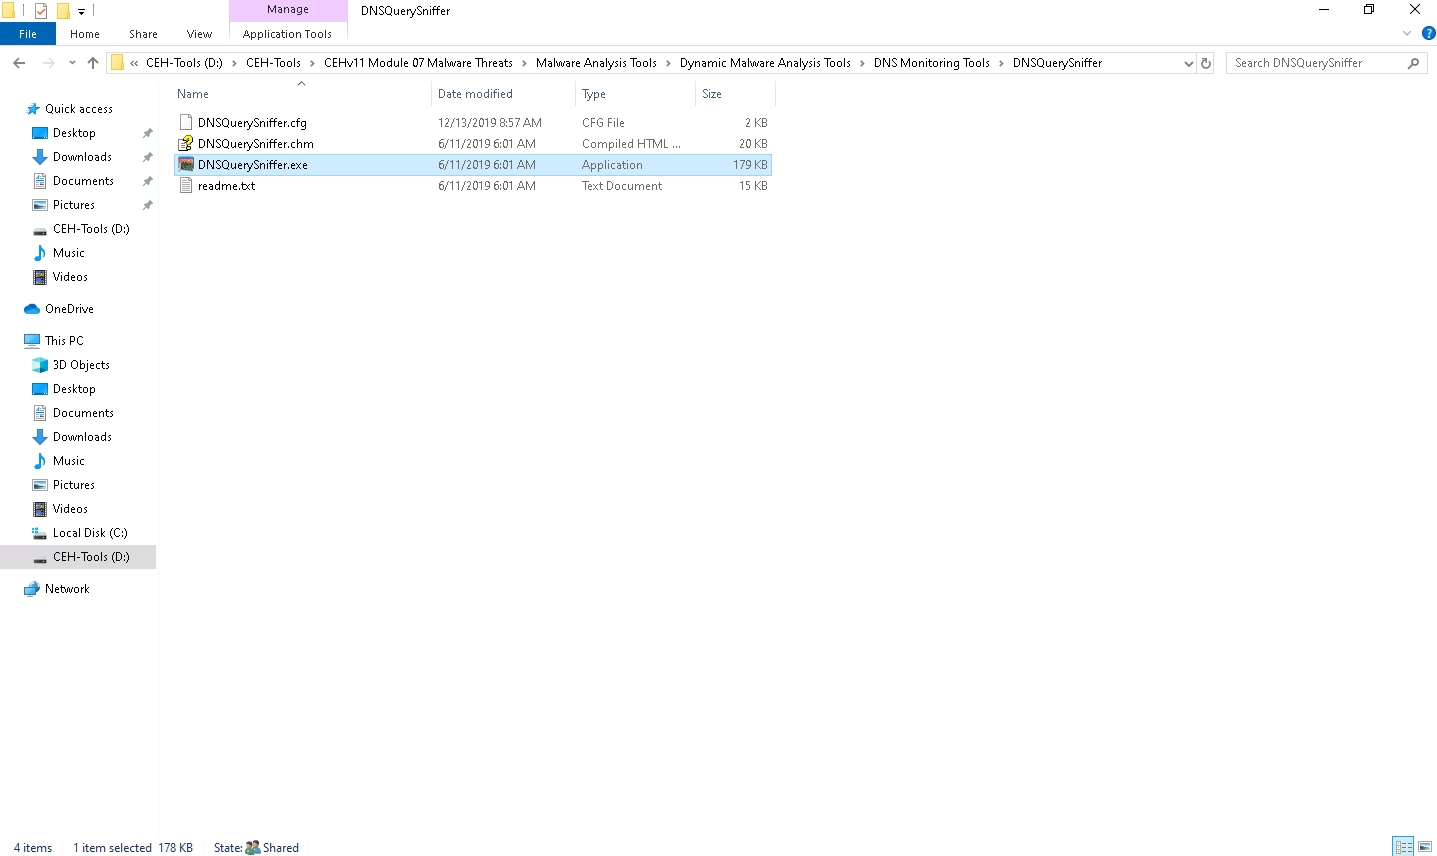
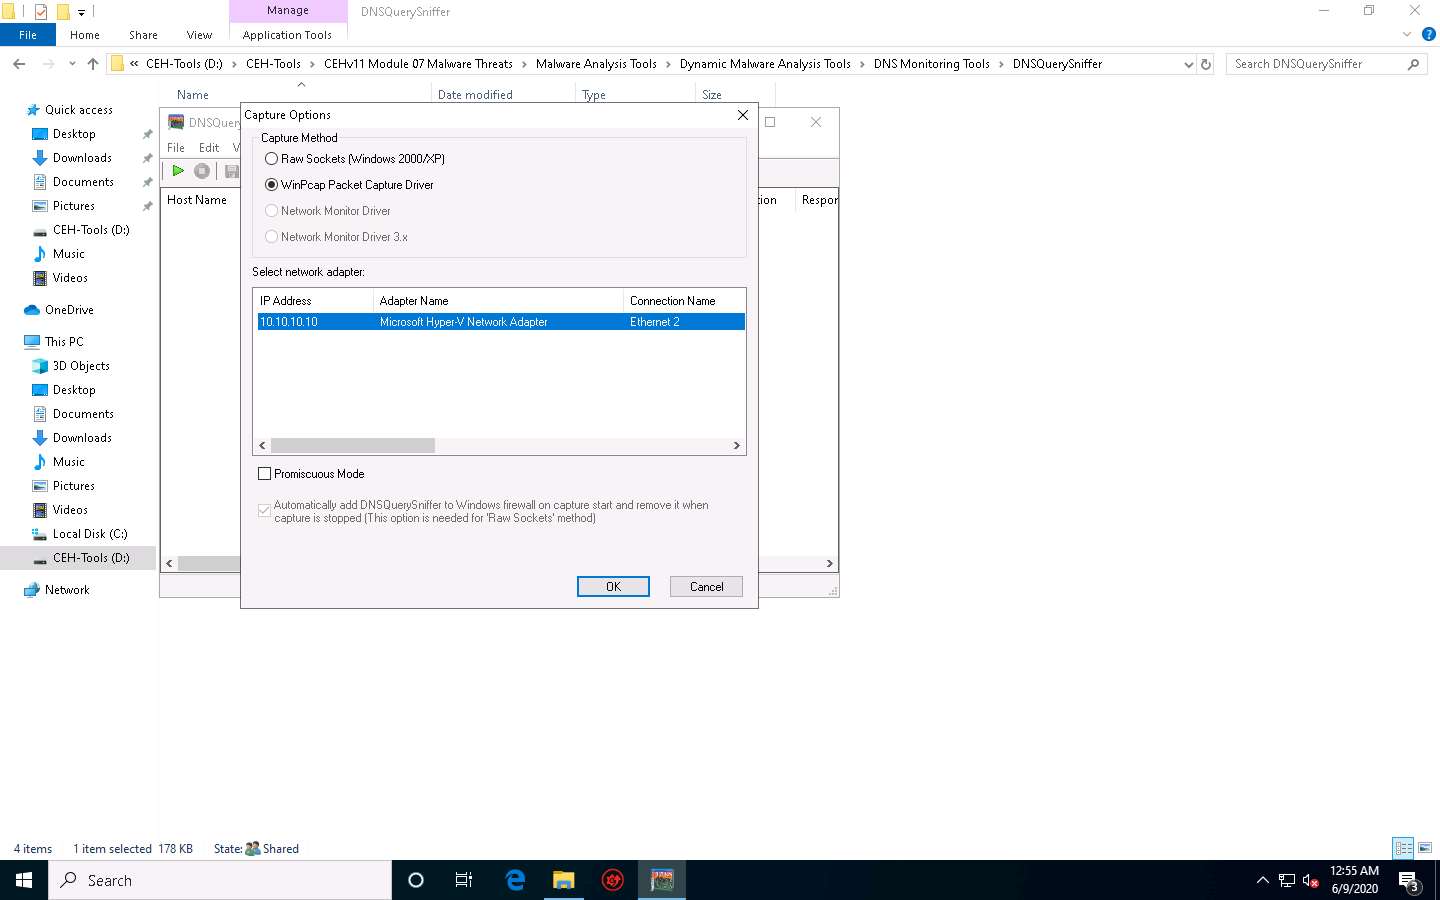
The main window of DNSQuerySniffer appears, along with the Capture Options window.
If the Capture Options window does not appear, then navigate to the Options menu and select Capture Options.
In the Capture Options window, ensure that the WinPcap Packet Capture Driver option is selected under the Capture Method field.
In the Select network adapter section, select the Windows 10 network adapter (here, Ethernet2).
Click OK to start sniffing.
The DNSQuerySniffer starts monitoring the network traffic and takes some time to capture the traffic. Leave the window intact. It shows the DNS queries sent on your system along with its complete information such as host name, port number, request time, response time, duration, source address, and destination address, as shown in the screenshot.
To view the Source Address and Destination Address columns, scroll to the right side of the window.
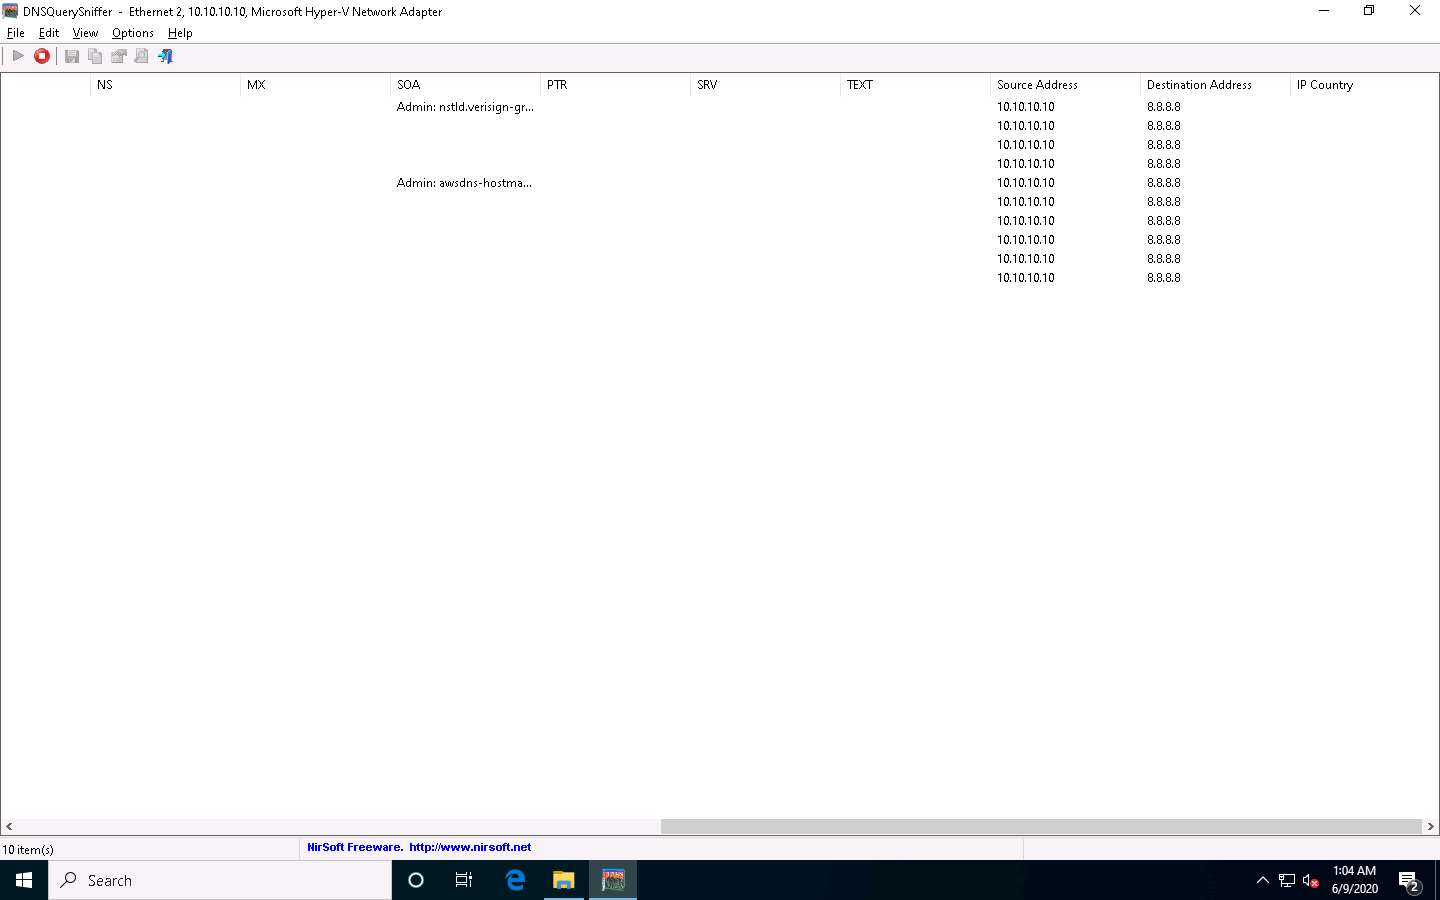
As you can see in the above screenshot, the DNS address is 8.8.8.8.
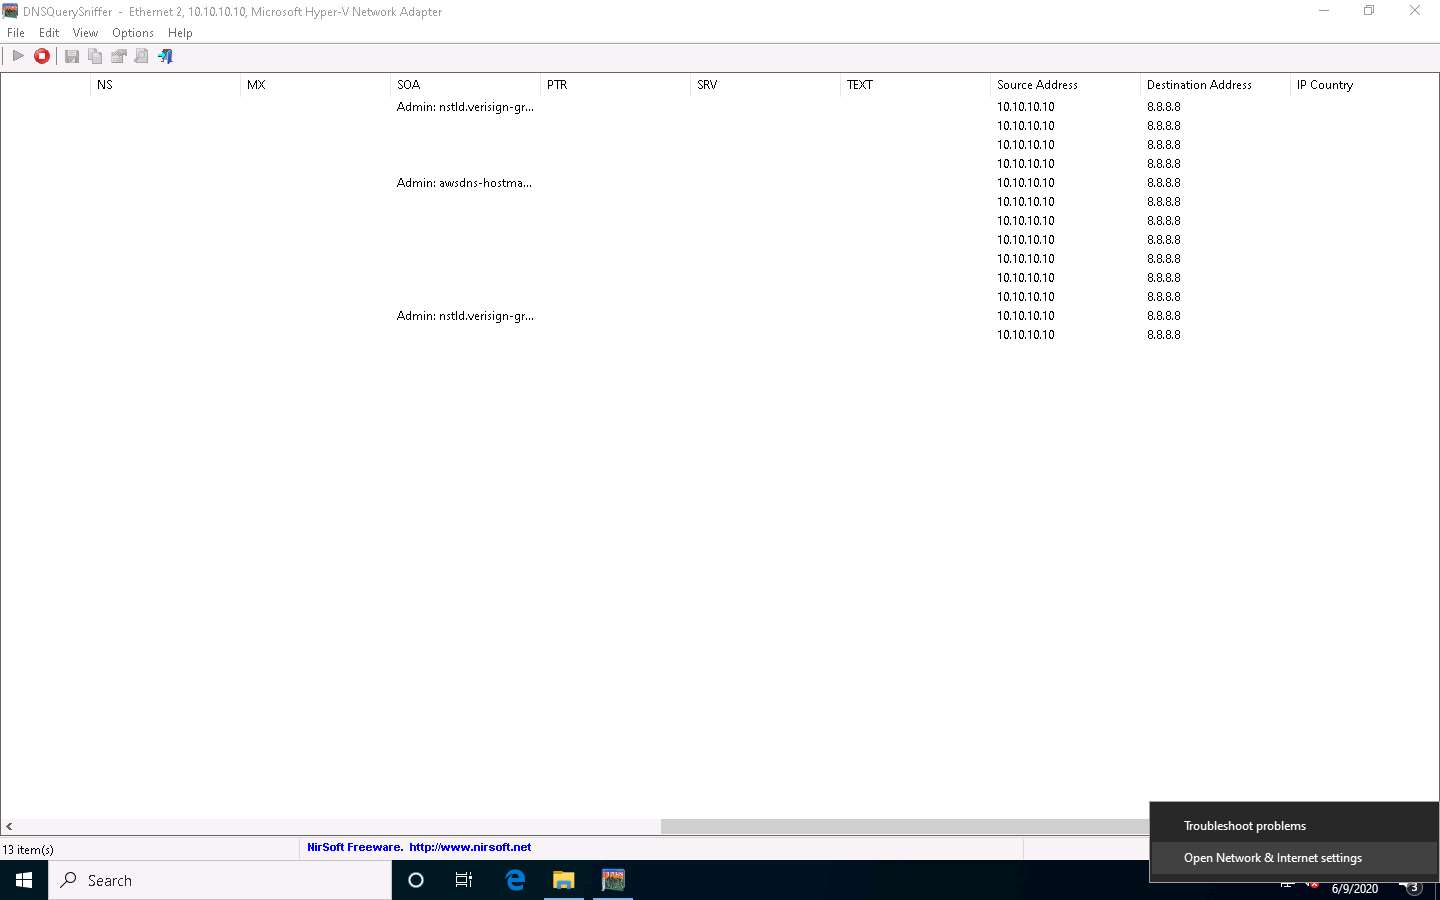
In real-time, attackers will use malicious applications like DNSChanger to change the DNS of the target machine. For demonstration purposes, we are changing the DNS of the Windows 10 machine in the Network & Internet settings.
Right-click on the Network icon in the lower-right corner of Desktop and click Open Network & Internet settings.
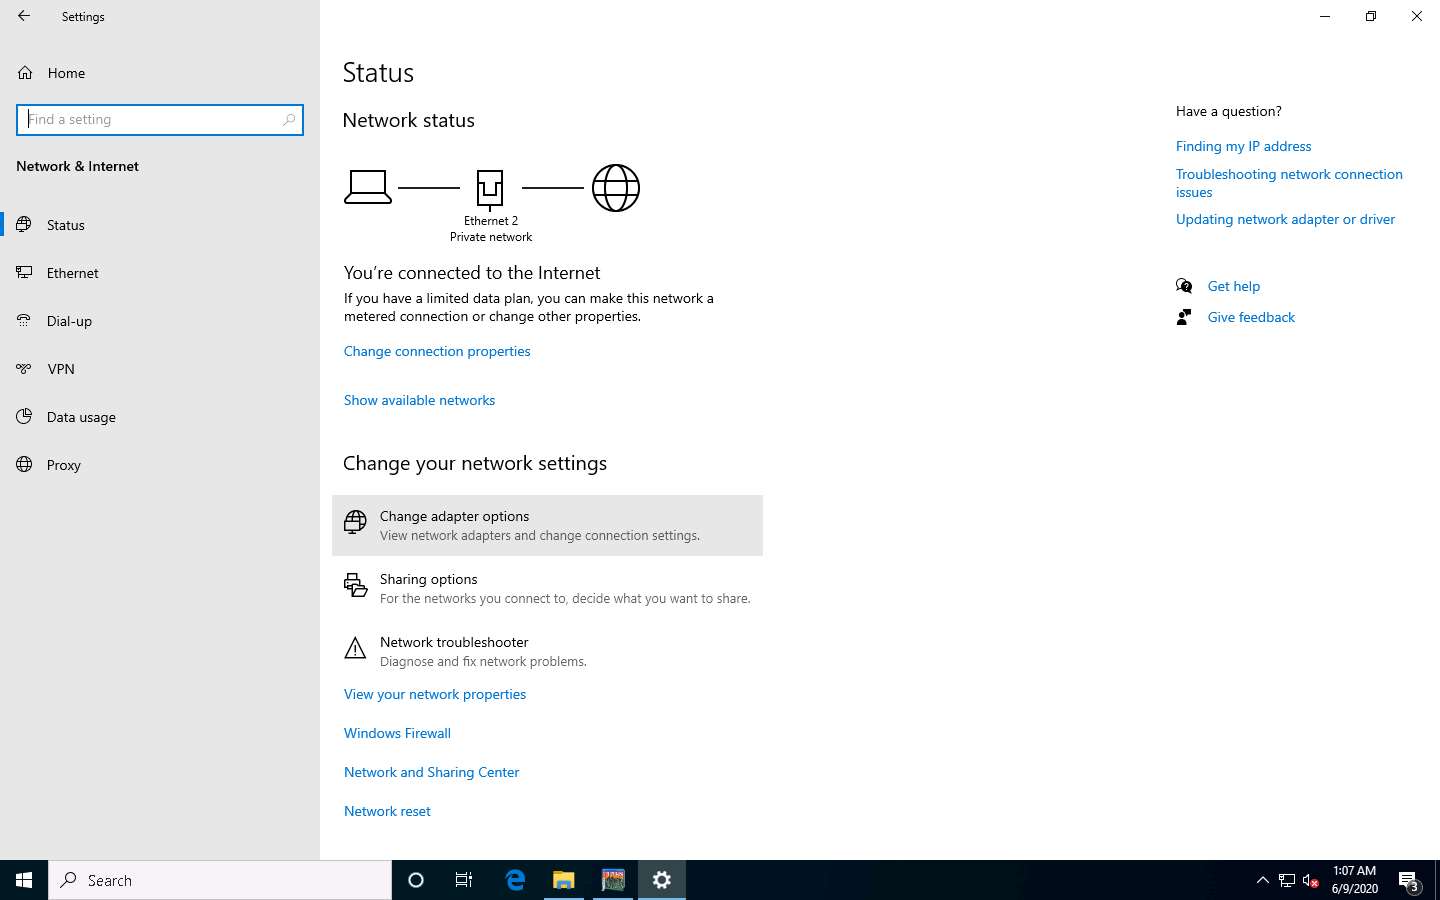
The Network Status window appears. Click Change adapter options under Change your network settings.
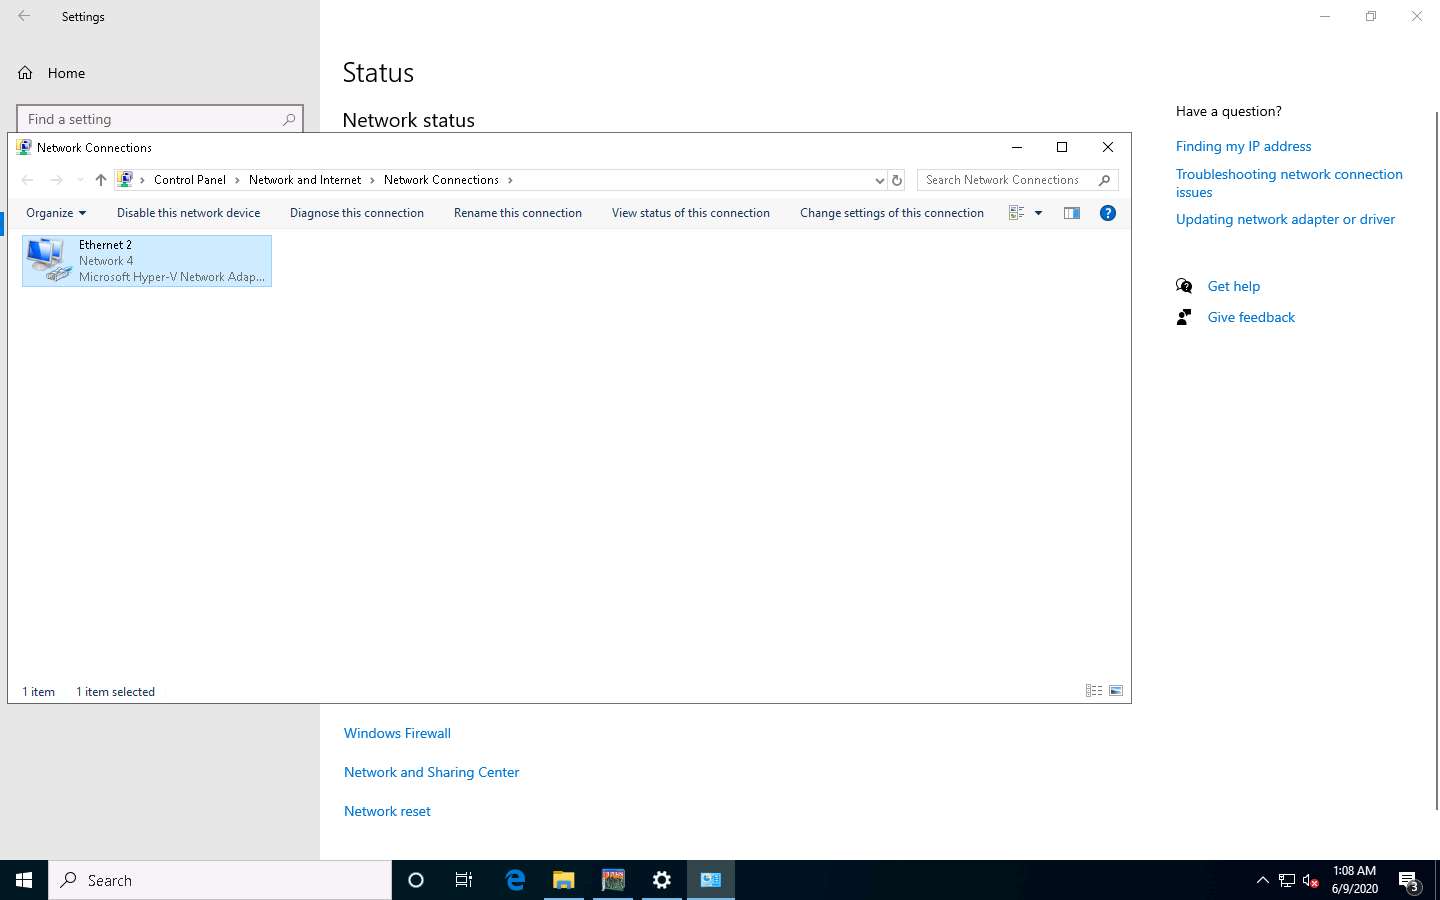
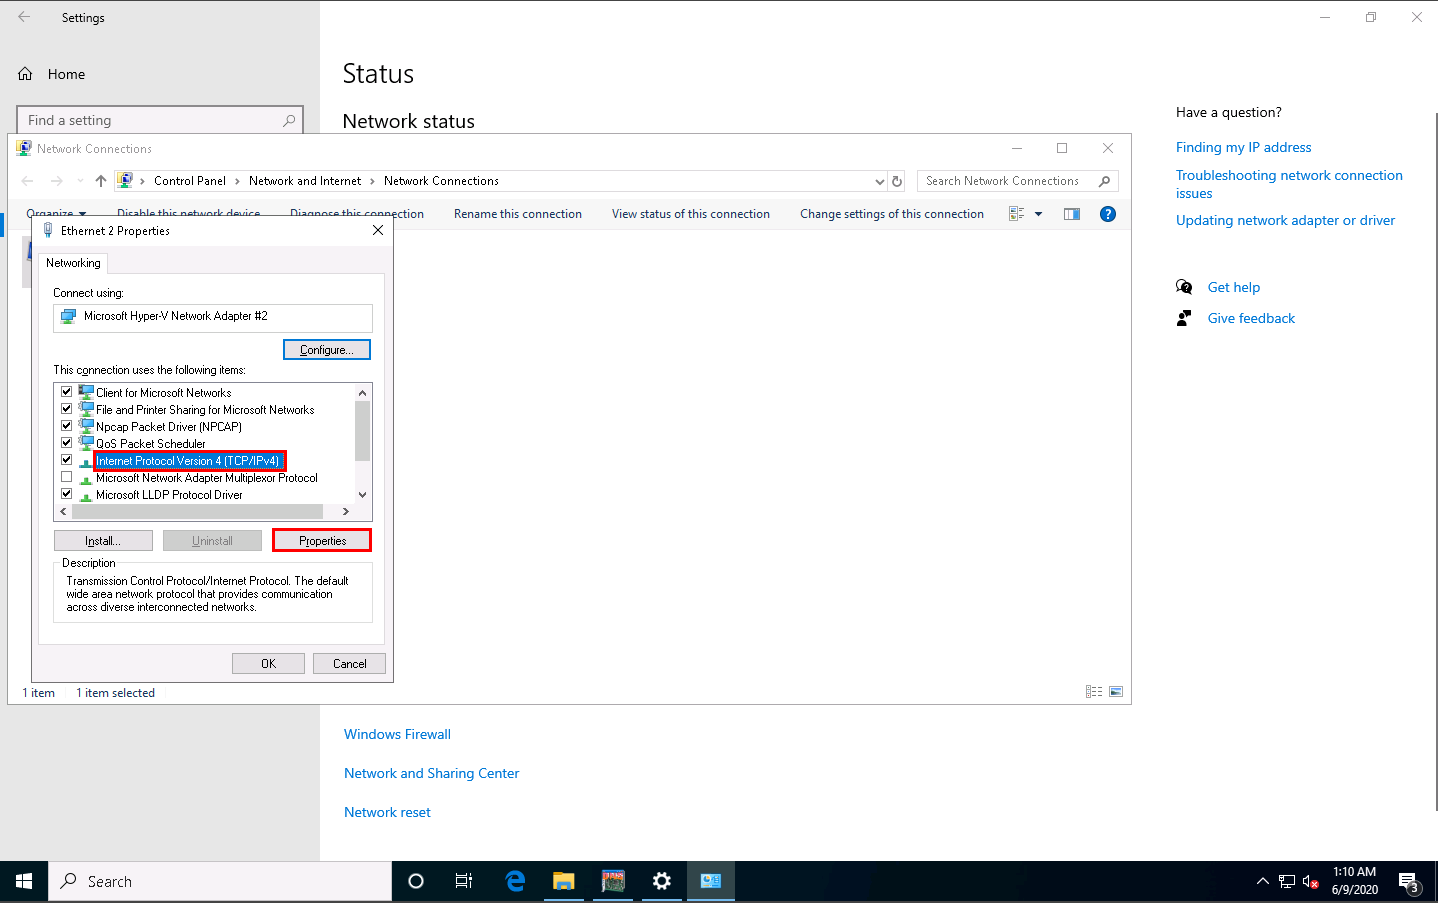
Right-click on the network adapter (here, Ethernet2) and click Properties.
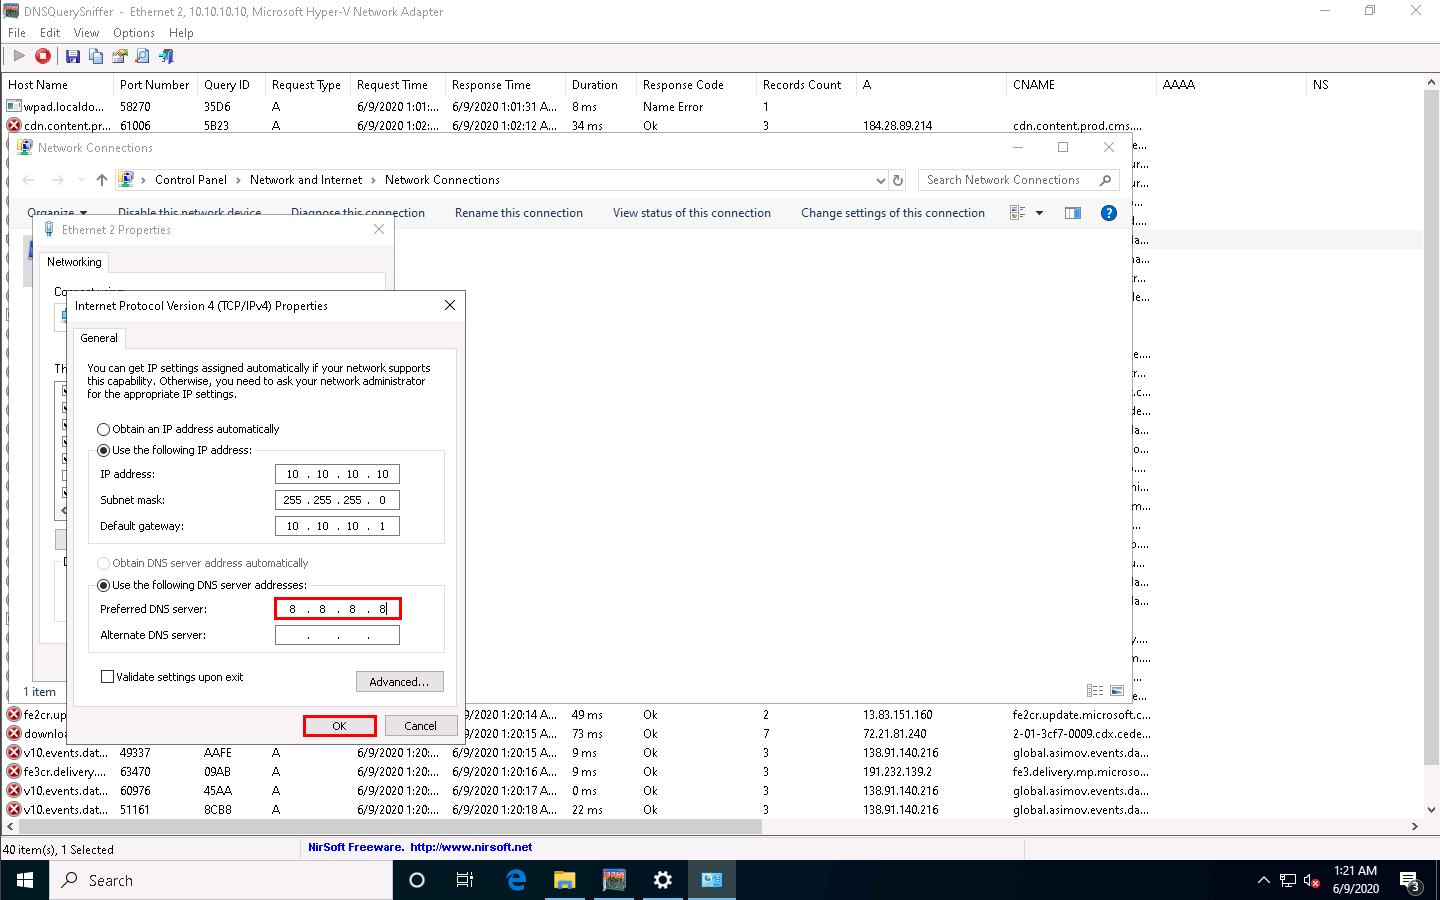
The Adapter Properties window appears. Select Internet Protocol Version 4 (TCP/IPv4) and click Properties.
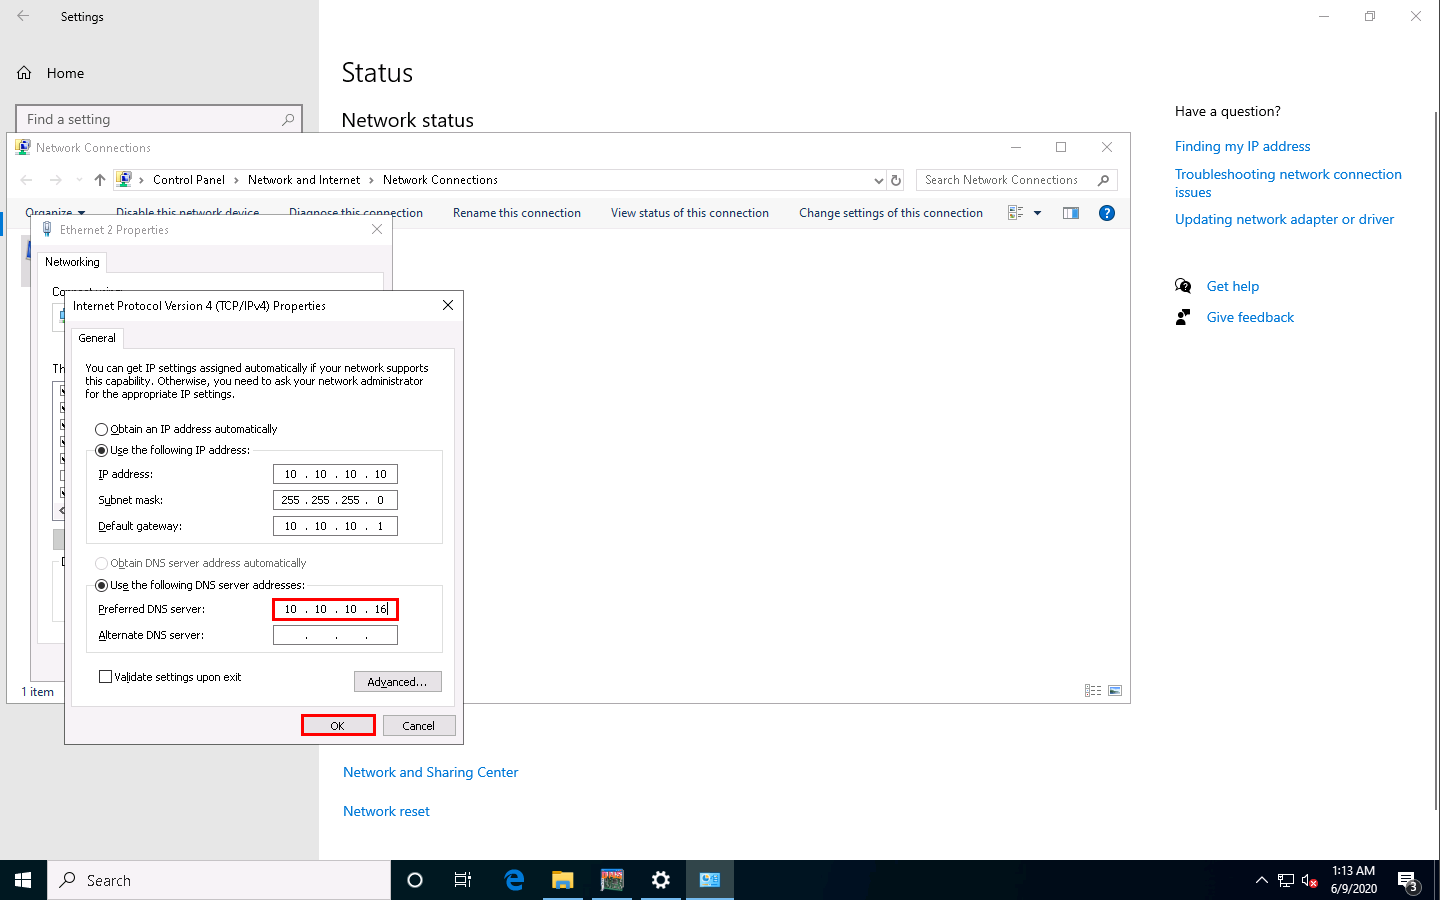
The Internet Protocol Version 4(TCP/IPv4) Properties window appears. Change the Preferred DNS server with the Windows Server 2016 IP address and click OK. In this task, the Windows Server 2016 IP address is 10.10.10.16. This may vary in your lab environment.
Click OK, and then Close the Adapter Properties window.
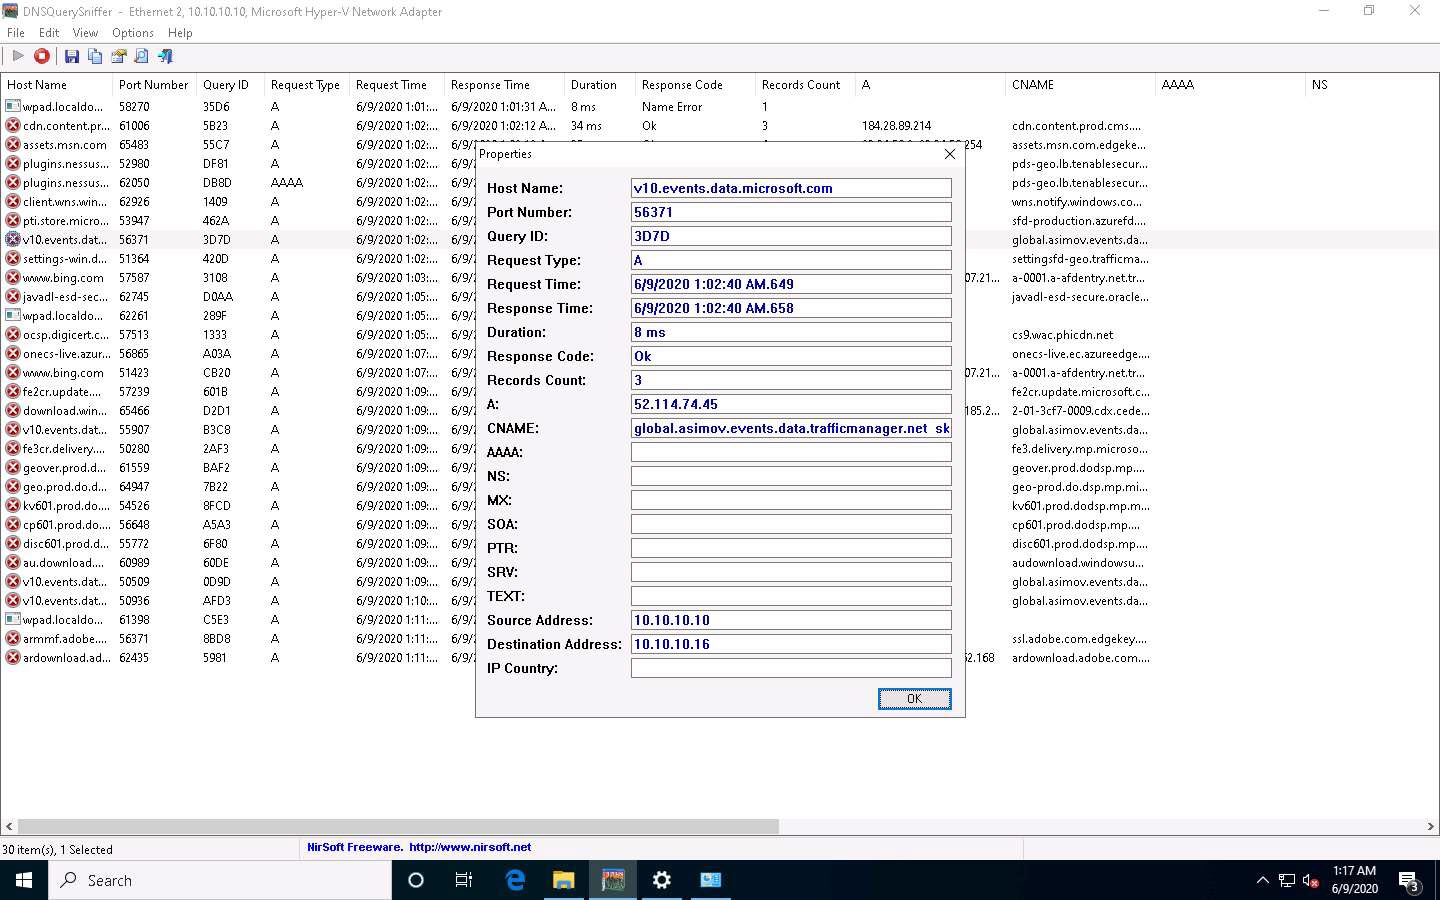
Switch to the DNSQuerySniffer window; observe the few recorded logs. Right-click on the log for which DNS has changed and select Properties from the context menu.
In the Properties window, observe that there is a change in DNS.
After completion of the task, go to the network settings, change DNS 8.8.8.8 in the Windows 10 machine, and close all applications.
Uninstall the DriverBooster and Advanced SystemCare software by navigating to Control Panel --> Programs --> Uninstall a program.
While uninstalling, remove all the files of tools from the system.
You can also use other DNS monitoring/resolution tools such as DNSstuff (https://www.dnsstuff.com), DNS Lookup Tool (https://www.ultratools.com), or Sonar Lite (https://constellix.com) to perform DNS monitoring.


Comments
Post a Comment