Lab 2: Perform Network Sniffing using Various Sniffing Tools
Lab 2: Perform Network Sniffing using Various Sniffing Tools
Module 08: Sniffing
Lab 2: Perform Network Sniffing using Various Sniffing Tools
Task 1: Perform Password Sniffing using Wireshark
Wireshark is a network packet analyzer used to capture network packets and display packet data in detail.
The tool uses Winpcap to capture packets on its own supported networks. It captures live network traffic from Ethernet,
IEEE 802.11, PPP/HDLC, ATM, Bluetooth, USB, Token Ring, Frame Relay, and FDDI networks. The captured files can be programmatically
edited via the command-line. A set of filters for customized data displays can be refined using a display filter.
open wireshark
select ethernet
log the password being put in on the windows 10 pc or upload log that would have that
just of this lab is your opening logs of a possible unenecypted pass
in the filter enter
http.request.method == POST
this will show http POST packets only
click edit
click find packet
where it says display filter drop down and select
String
for the other 2 drop downs select
packet details and narrot (UTF-8/ASCII)
in the box enter
pwd
hit find
it will highlight where it says
username=sam&tx twpwd=test
that shows uernamea nd password sam and test
you can also just expand the HTML from URL encoded: application x -forum urlcencloded
and it will show that info
rest of the lab is you can use Wireshark to capture traffic on a remote interface.
---------------------------------------------------------------------------------------------------------------------------------------
Module 08: Sniffing
Lab 2: Perform Network Sniffing using Various Sniffing Tools
Task 2: Analyze a Network using the Omnipeek Network Protocol Analyzer
OmniPeek Network Analyzer provides real-time visibility and expert analysis of each part of the target network.
It performs analysis, drills down, and fixes performance bottlenecks across multiple network segments. It includes
analytic plug-ins that provide targeted visualization and search abilities.
An ethical hacker or pen tester can use this tool to monitor and analyze network traffic of the target network
in real-time, identify the source location of that traffic, and attempt to obtain sensitive information as well
as find any network loopholes.
refer to blog
---------------------------------------------------------------------------------------------------------------------------------------
Module 08: Sniffing
Lab 2: Perform Network Sniffing using Various Sniffing Tools'
Task 3: Analyze a Network using the SteelCentral Packet Analyzer
SteelCentral Packet Analyzer provides a graphical console for high-speed packet analysis.
It captures terabytes of packet data traversing the network, reads it, and displays it in a GUI. It can analyze
multi-gigabyte recordings from locally presented trace files or on remote SteelCentral NetShark probes (physical,
virtual, or embedded on SteelHeads), without a large file transfer, to identify anomalous network issues or diagnose
and troubleshoot complex network and application performance issues down to the bit level.
refer to blog
---------------------------------------------------------------------------------------------------------------------------------------
Lab Scenario
Data traversing an HTTP channel flows in plain-text format and is therefore prone to MITM attacks. Network administrators can use sniffers for helpful purposes such as to troubleshoot network problems, examine security problems, and debug protocol implementations. However, an attacker can use sniffing tools such as Wireshark to sniff the traffic flowing between the client and the server. The traffic obtained by the attacker might contain sensitive information such as login credentials, which can then be used to perform malicious activities such as user-session impersonation.
An attacker needs to manipulate the functionality of the switch to see all traffic passing through it. A packet sniffing program (also known as a sniffer) can only capture data packets from within a given subnet, which means that it cannot sniff packets from another network. Often, any laptop can plug into a network and gain access to it. Many enterprises leave their switch ports open. A packet sniffer placed on a network in promiscuous mode can capture and analyze all network traffic. Sniffing programs turn off the filter employed by Ethernet network interface cards (NICs) to prevent the host machine from seeing other stations’ traffic. Thus, sniffing programs can see everyone’s traffic.
The information gathered in the previous step may be insufficient to reveal the potential vulnerabilities of the target. There may be more information to help find loopholes in the target. An ethical hacker needs to perform network security assessments and suggest proper troubleshooting techniques to mitigate attacks. This lab provides hands-on experience of how to use sniffing tools to sniff network traffic and capture it on a remote interface.
Lab Objectives
- Perform password sniffing using Wireshark
- Analyze a network using the Omnipeek Network Protocol Analyzer
- Analyze a network using the SteelCentral Packet Analyzer
Overview of Network Sniffing Tools
System administrators use automated tools to monitor their networks, but attackers misuse these tools to sniff network data. Network sniffing tools can be used to perform a detailed network analysis. When protecting a network, it is important to have as many details about the packet traffic as possible. By actively scanning the network, a threat hunter can stay vigilant and respond quickly to attacks.
Task 1: Perform Password Sniffing using Wireshark
Wireshark is a network packet analyzer used to capture network packets and display packet data in detail. The tool uses Winpcap to capture packets on its own supported networks. It captures live network traffic from Ethernet, IEEE 802.11, PPP/HDLC, ATM, Bluetooth, USB, Token Ring, Frame Relay, and FDDI networks. The captured files can be programmatically edited via the command-line. A set of filters for customized data displays can be refined using a display filter.
Here, we will use the Wireshark tool to perform password sniffing.
In this task, we will use the Windows Server 2019 (10.10.10.19) machine as the host machine and the Windows 10 (10.10.10.10) machine as the target machine.
Click Windows Server 2019 to switch to the Windows Server 2019 machine.
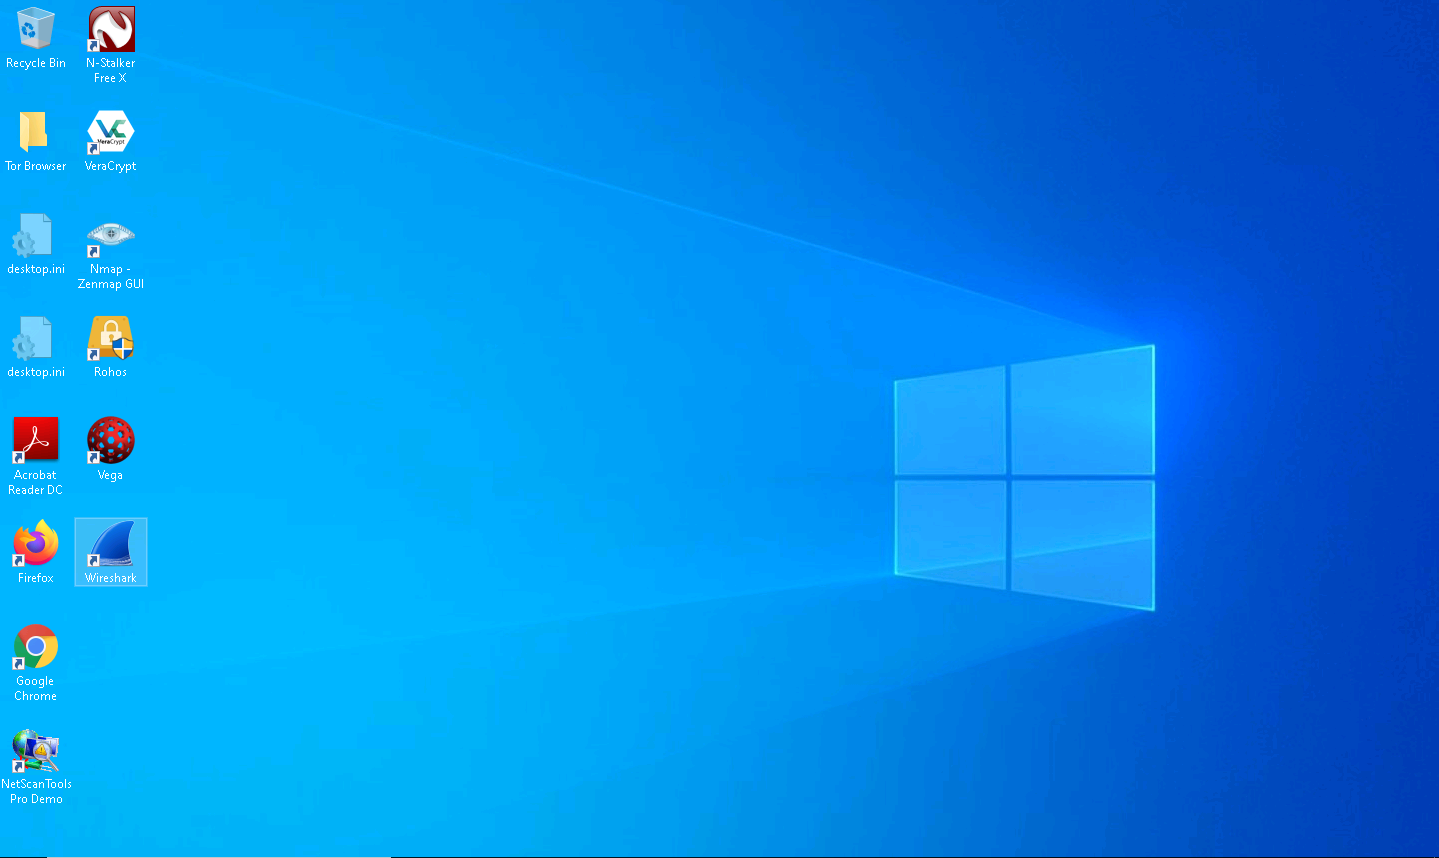
On the Desktop, double-click Wireshark shortcut.
If the Software update window appears, click Remind me later.
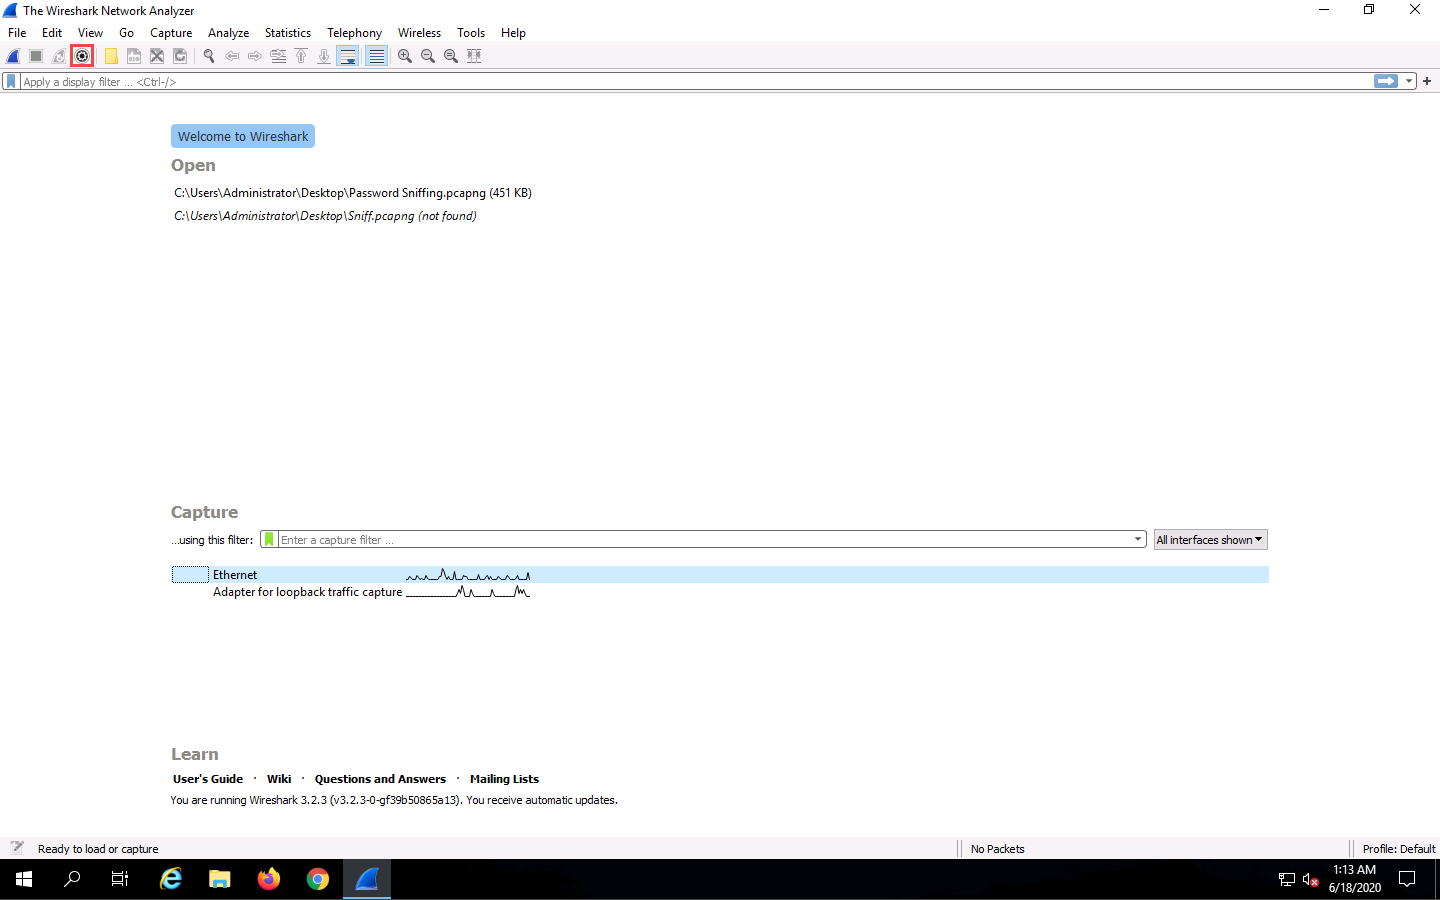
The Wireshark Network Analyzer window appears; double-click the available ethernet or interface (here, Ethernet) to start the packet capture, as shown in the screenshot.
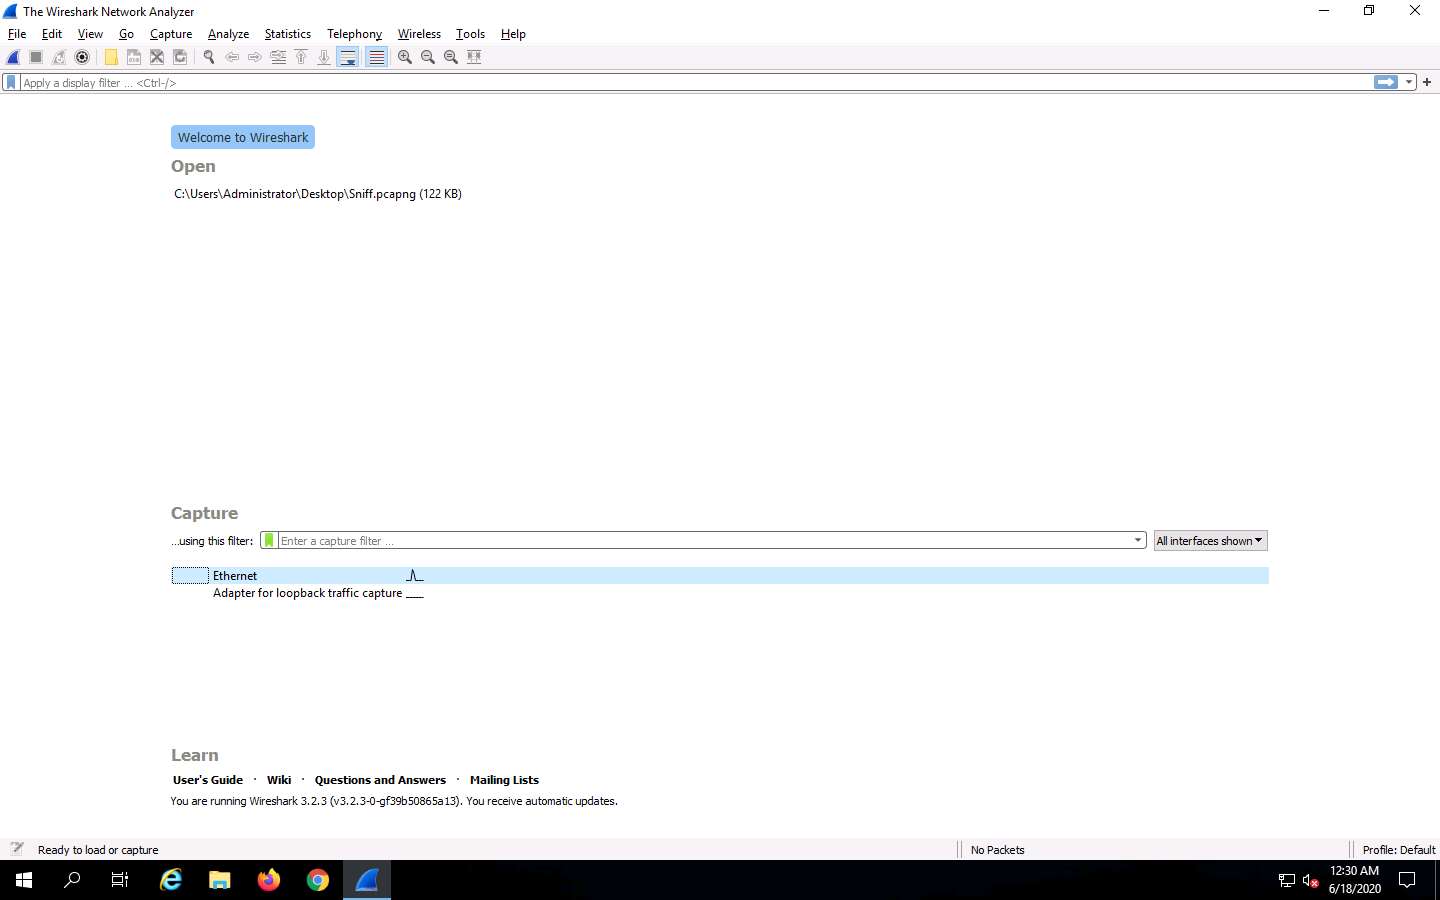
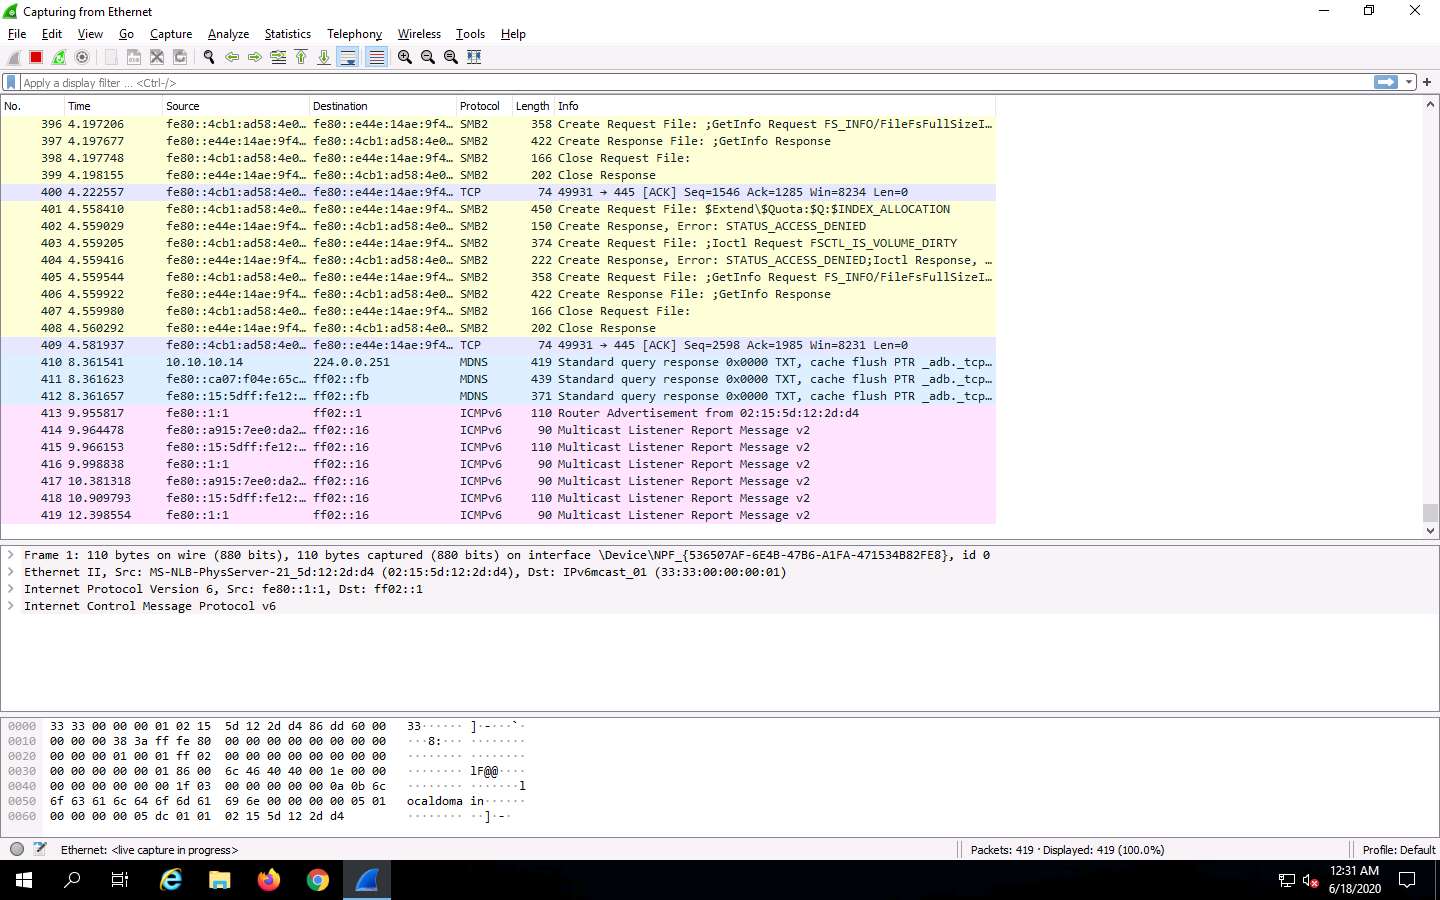
Wireshark starts capturing all packets generated while traffic is received by or sent from your machine.
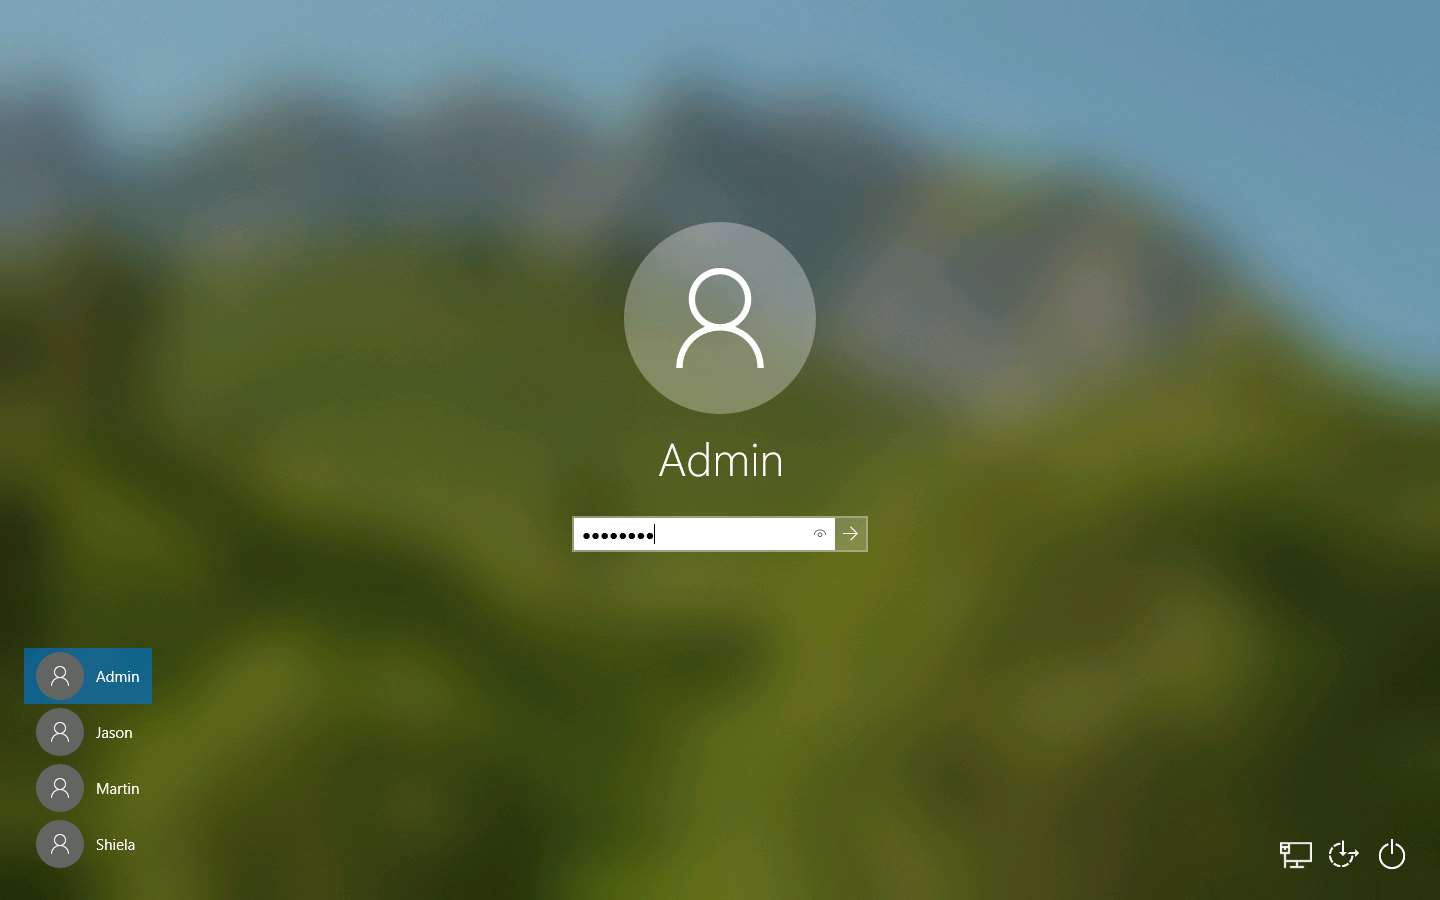
Now, click Windows 10 to switch to the Windows 10 machine, click Ctrl+Alt+Delete.
By default, Admin user profile is selected, click Pa$$w0rd to paste the password in the Password field and press Enter to login.
Alternatively, you can also click Pa$$w0rd under Windows 10 machine thumbnail in the Resources pane or Click Type Text | Type Password button under Commands (thunder icon) menu.
If Welcome to Windows wizard appears, click Continue and in Sign in with Microsoft wizard, click Cancel.
Networks screen appears, click Yes to allow your PC to be discoverable by other PCs and devices on the network.
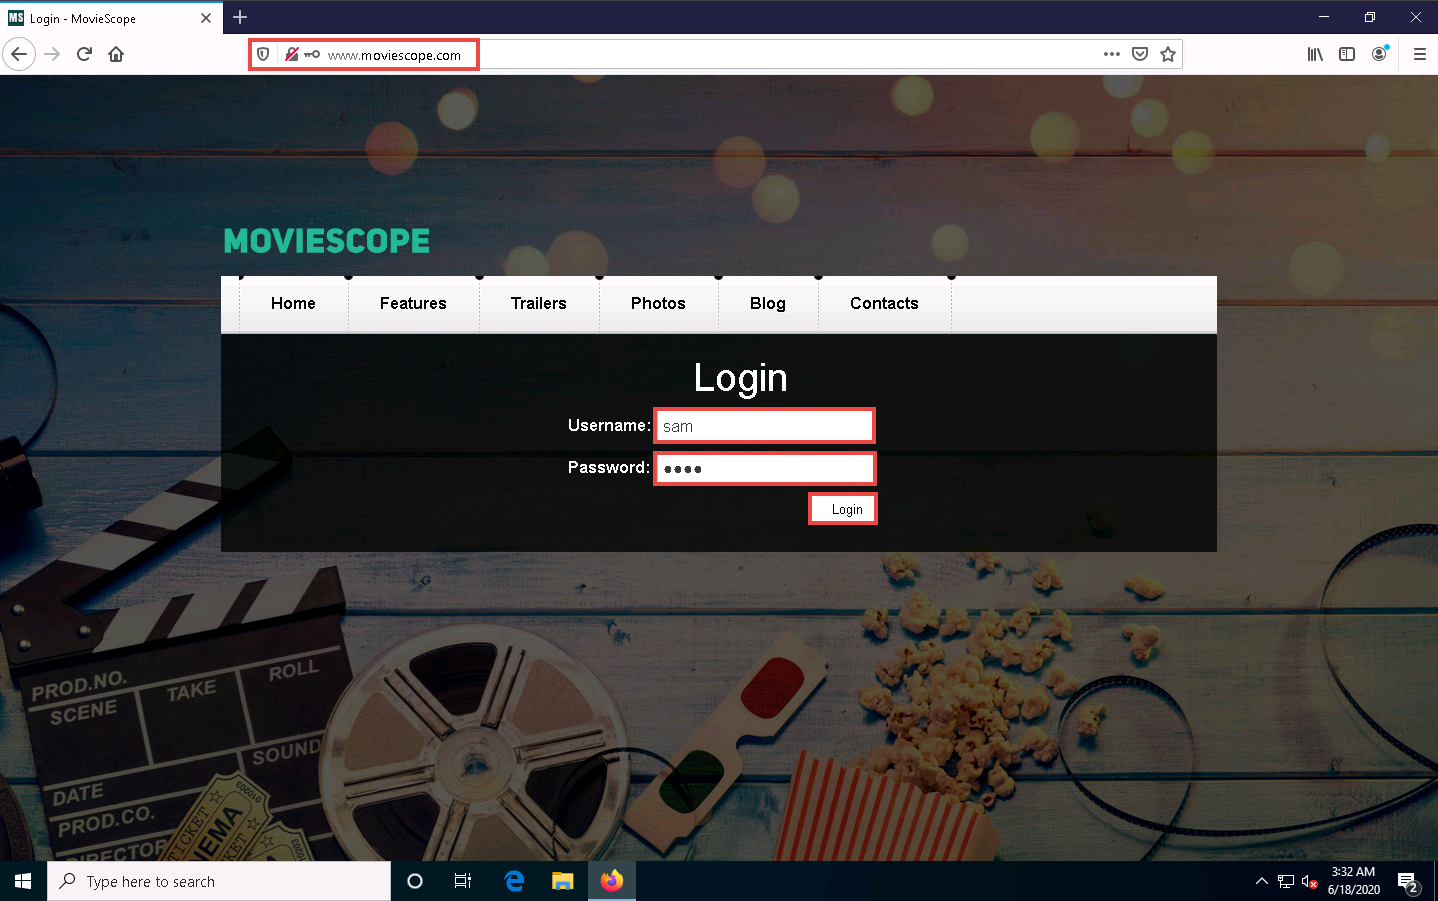
Open any browser (here, Mozilla Firefox), Place the cursor in the address bar and click on http://www.moviescope.com/ in the address bar, and press Enter.
The MOVIESCOPE home page appears; type Username and Password as sam and test, and click Login, as shown in the screenshot.
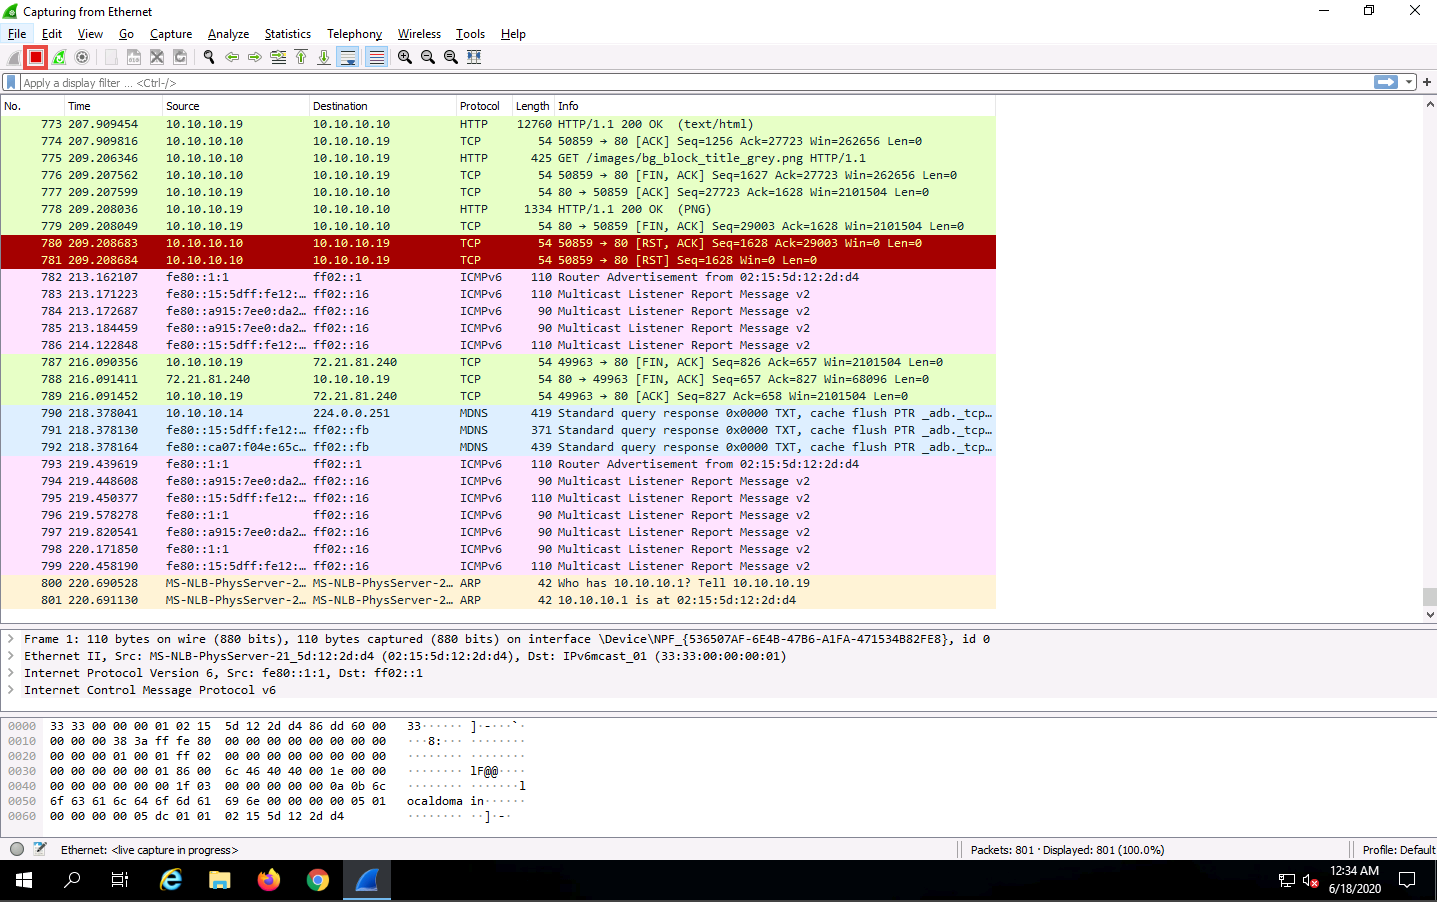
Click Windows Server 2019 to switch back to Windows Server 2019 machine, and in the Wireshark window, click the Stop capturing packets icon on the toolbar.
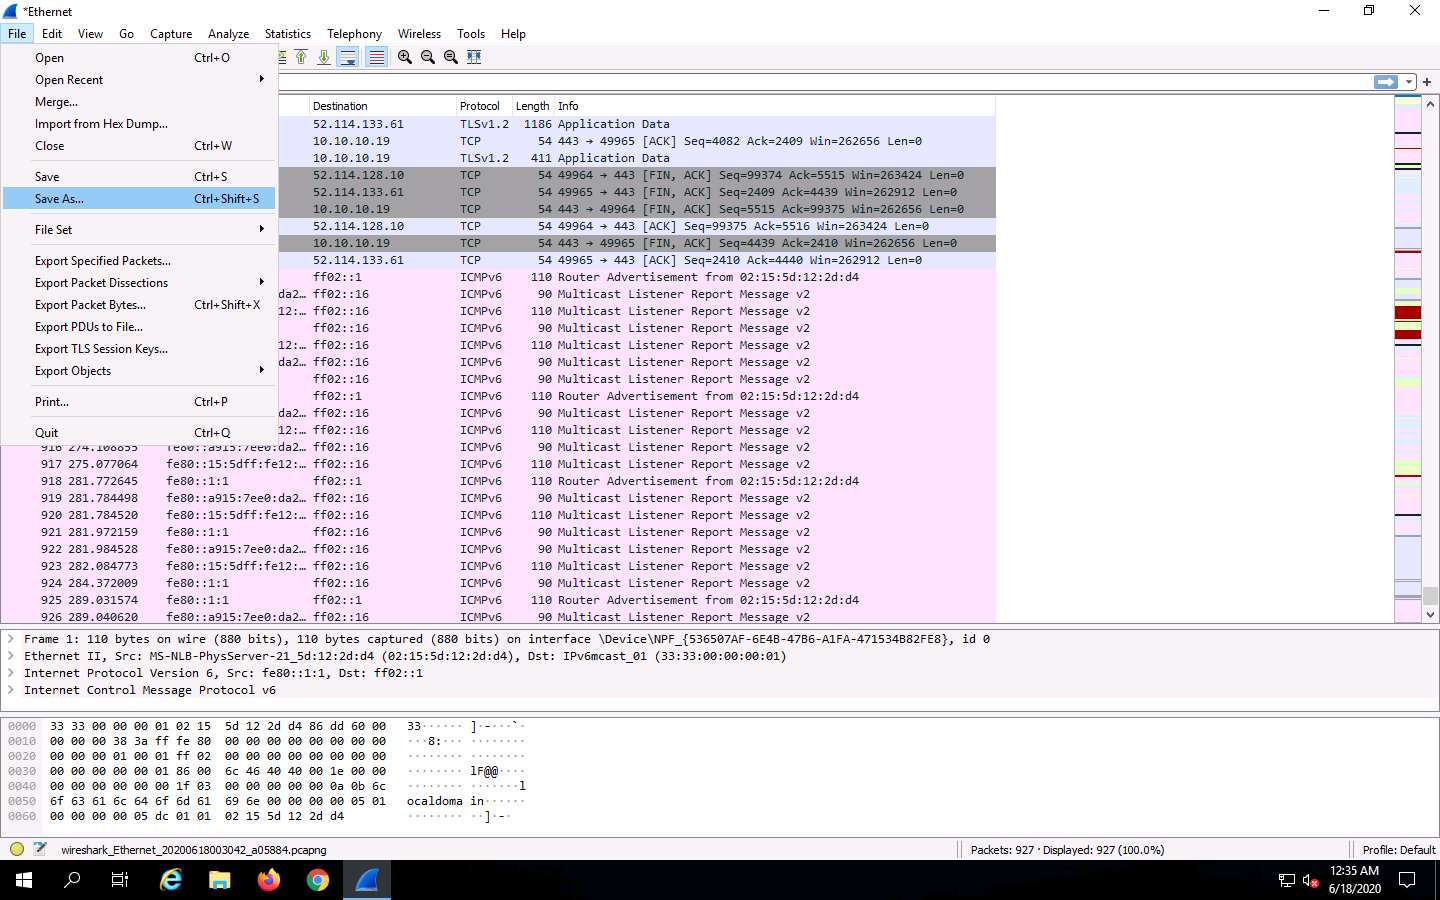
Click File --> Save As… from the top-left corner of the window to save the captured packets.
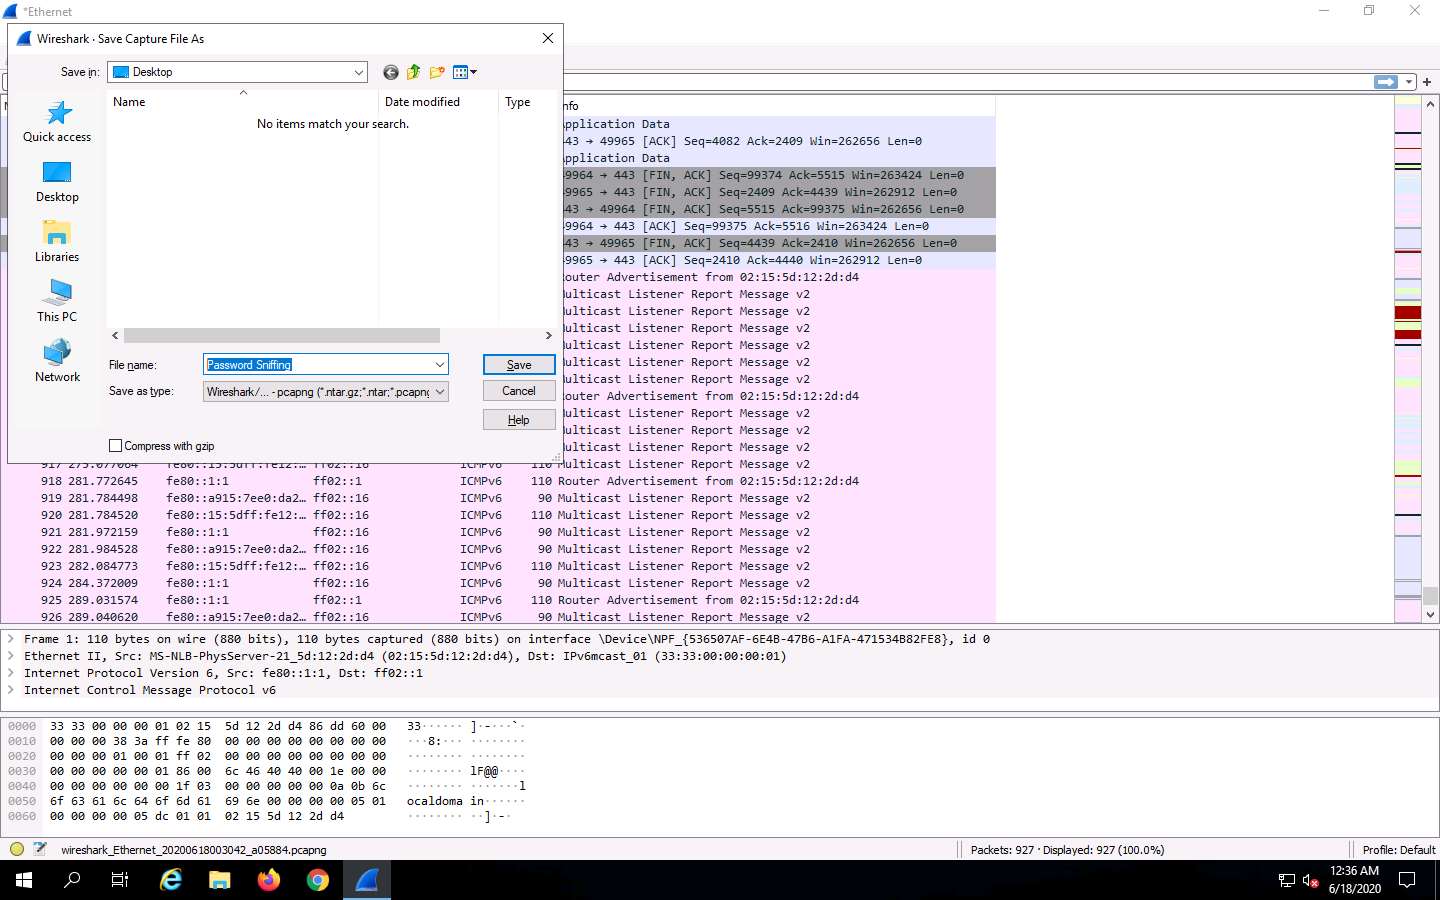
The Wireshark: Save file as window appears. Select any location to save the file, specify File name as Password Sniffing, and click Save.
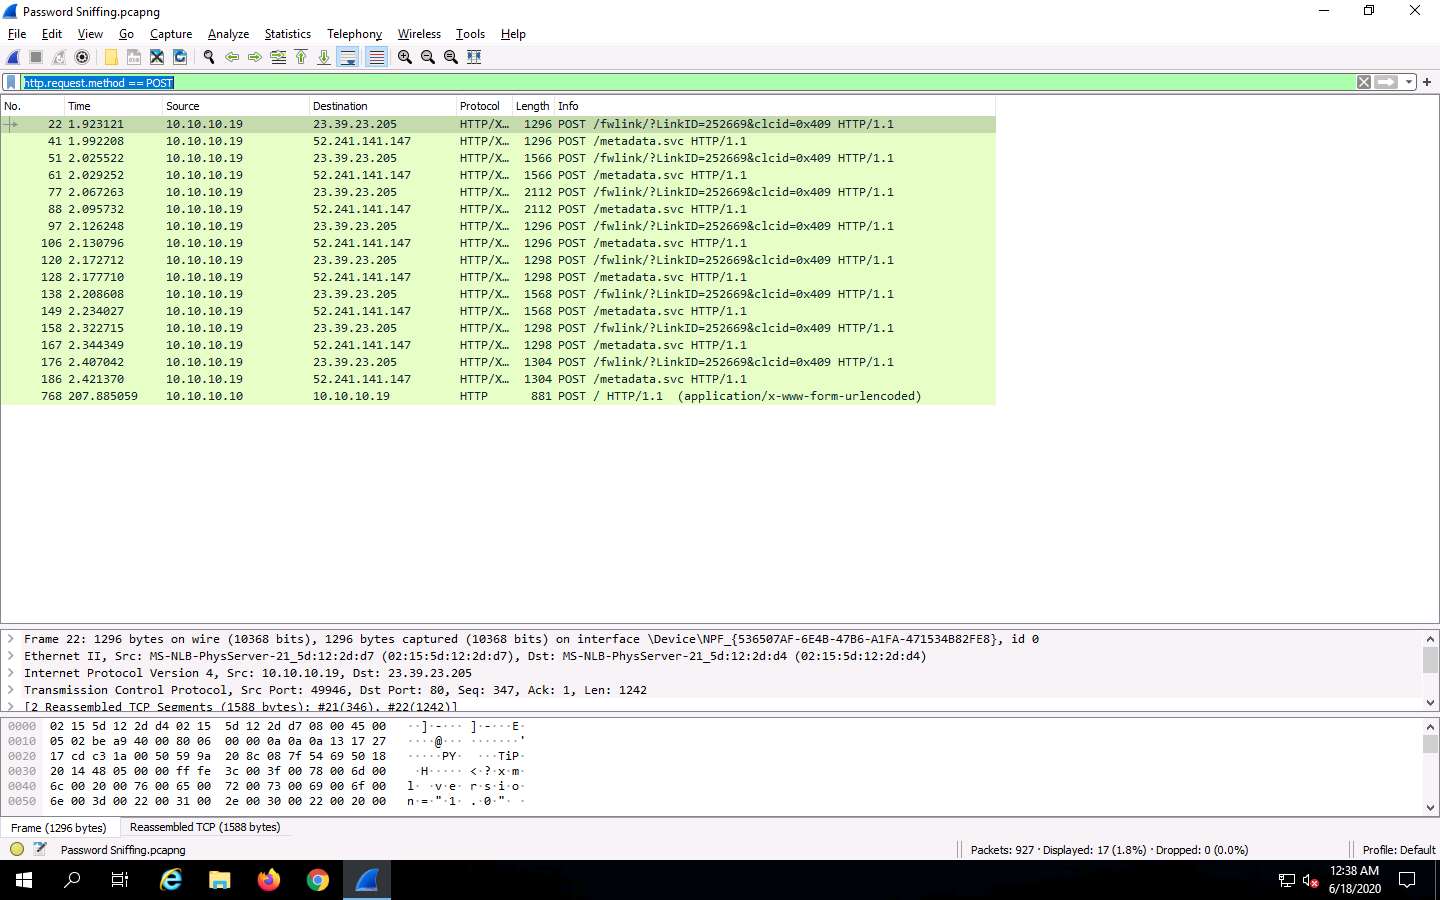
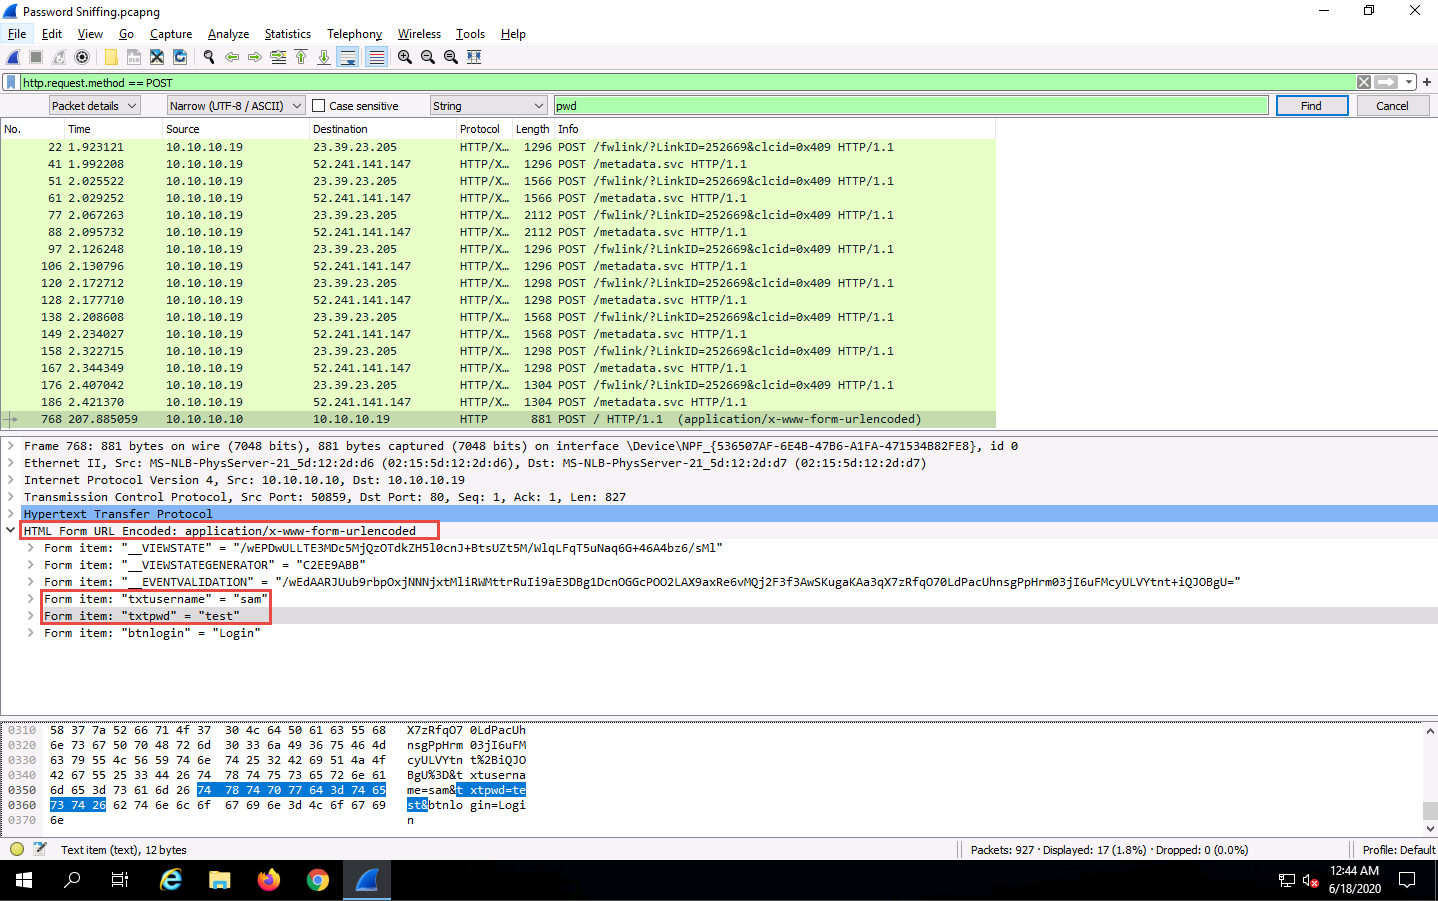
In the Apply a display filter field, type http.request.method == POST and click the arrow icon (-->) to apply the filter.
Applying this syntax helps you narrow down the search for http POST traffic.
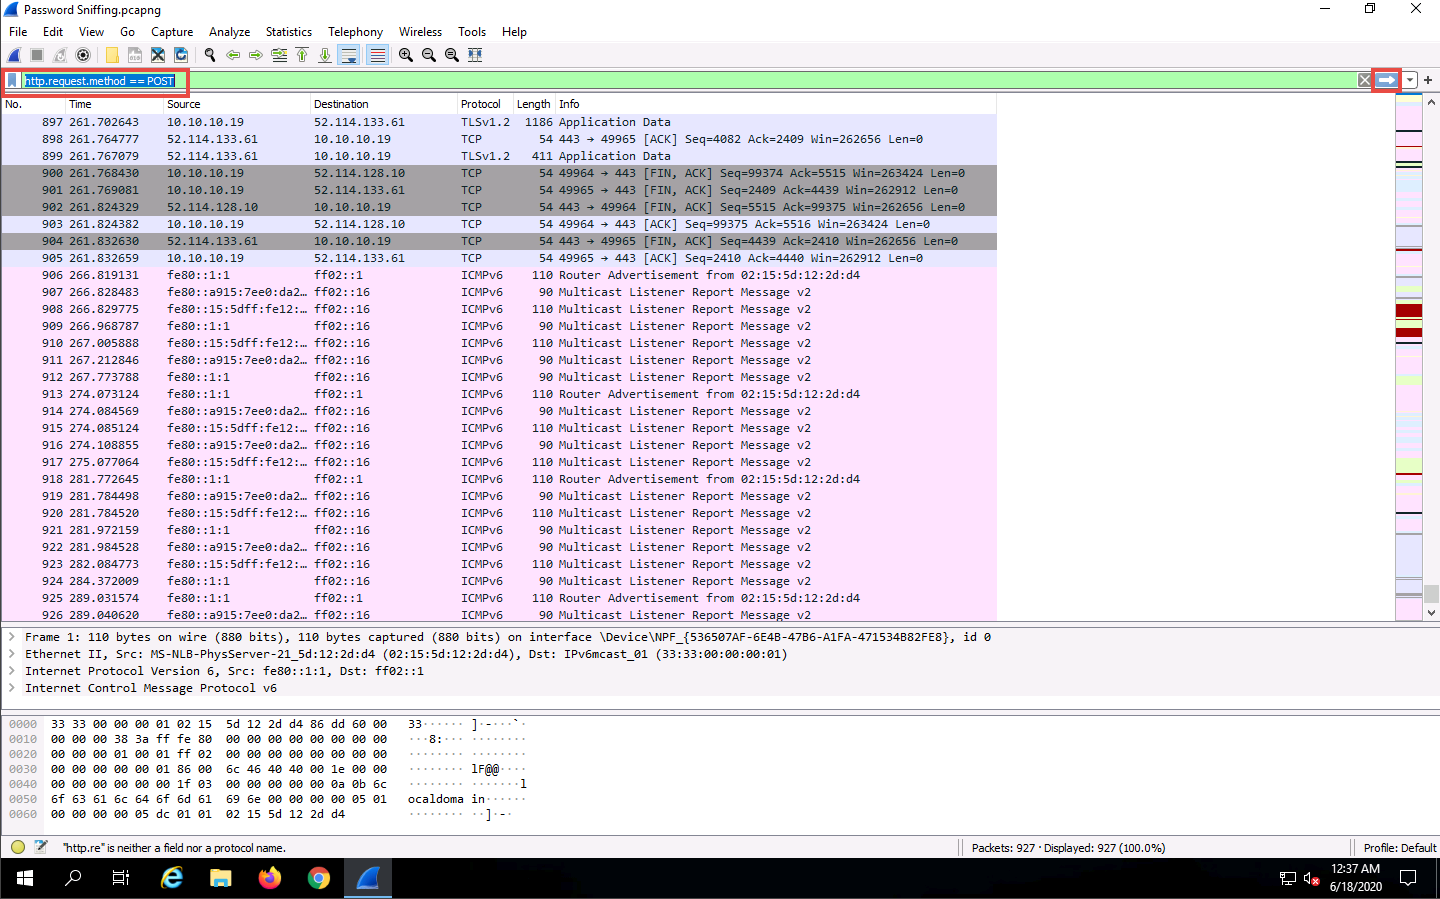
Wireshark only filters http POST traffic packets, as shown in the screenshot.
Now, click Edit from the menu bar and click Find Packet….
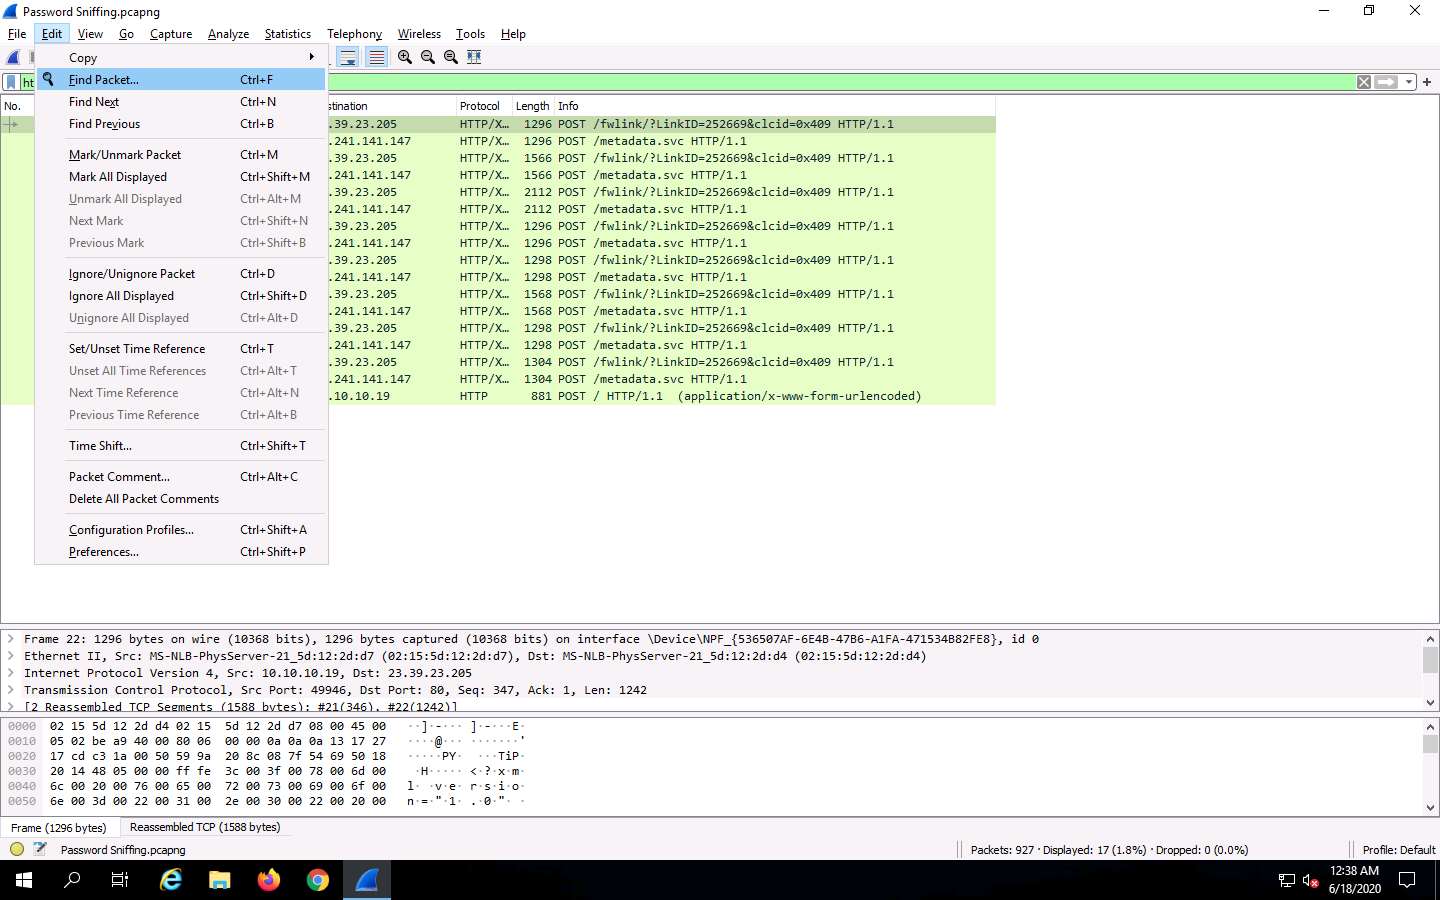
The Find Packet section appears below the display filter field.
Click Display filter, select String from the drop-down options. Click Packet list, select Packet details from the drop-down options, and click Narrow & Wide and select Narrow (UTF-8 / ASCII) from the drop-down options.
In the field next to String, type pwd and click the Find button.
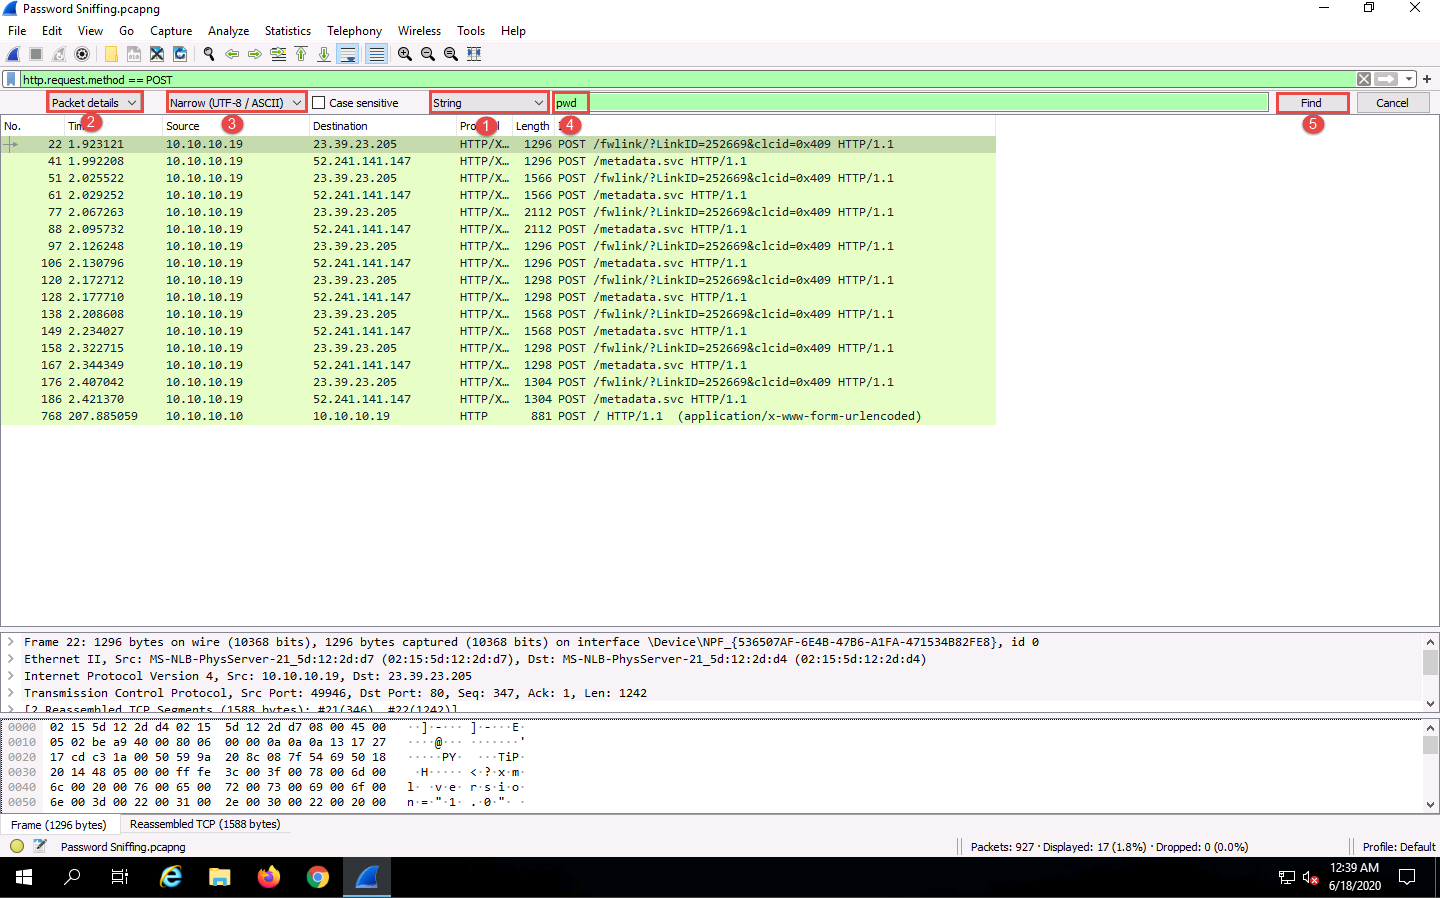
Wireshark will now display the sniffed password from the captured packets.
Expand the HTML Form URL Encoded: application/x-www-form-urlencoded node from the packet details section, and view the captured username and password, as shown in the screenshot.
Close the Wireshark window.
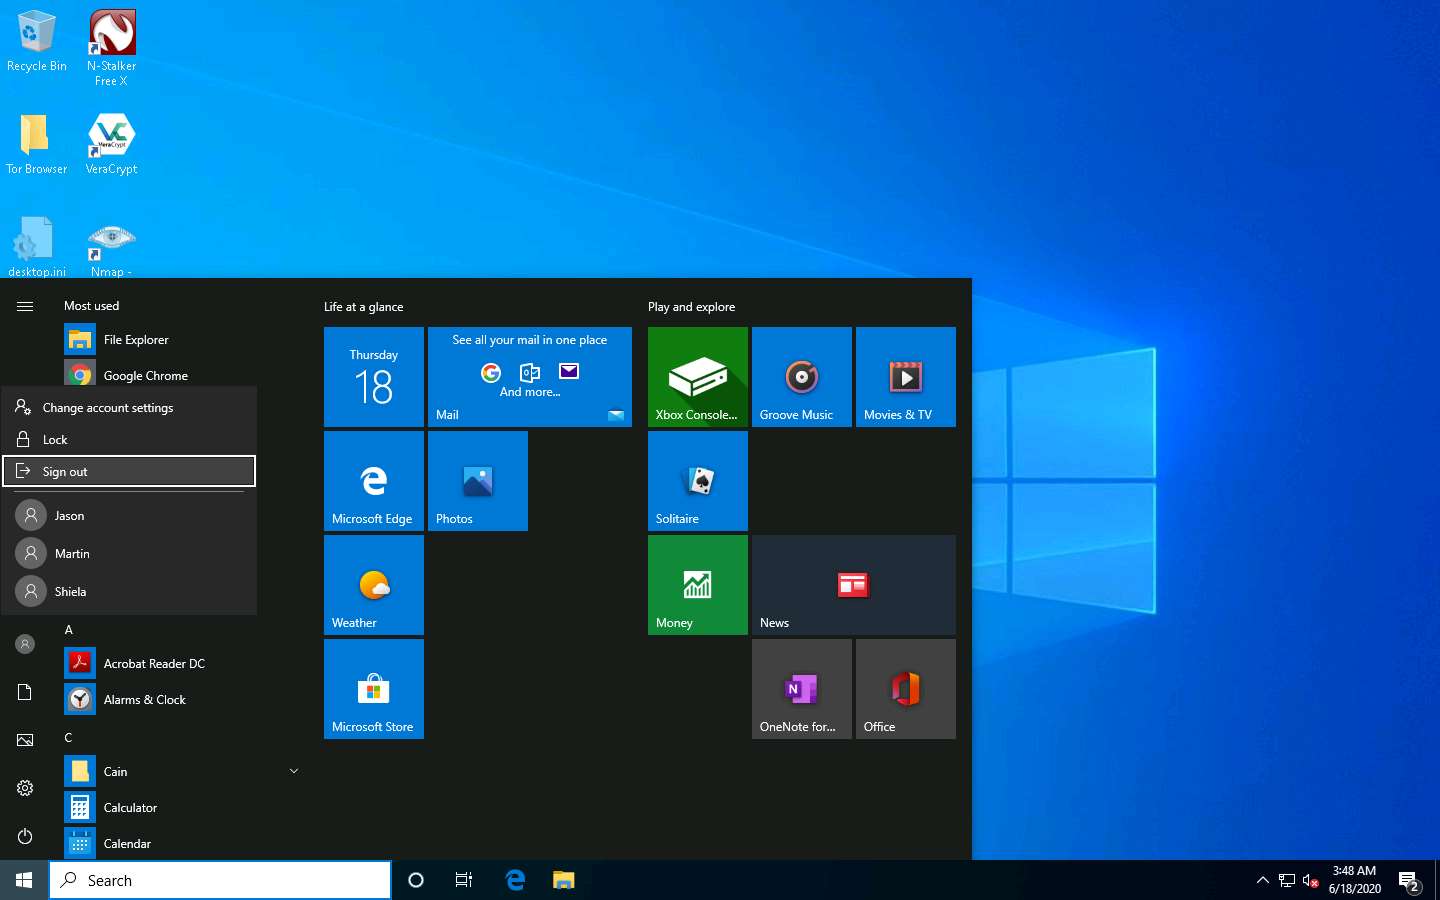
Click Windows 10 to switch to the Windows 10 machine, close the web browser, and sign out from the Admin account.
Click Windows Server 2019 to switch back to the Windows Server 2019 machine.
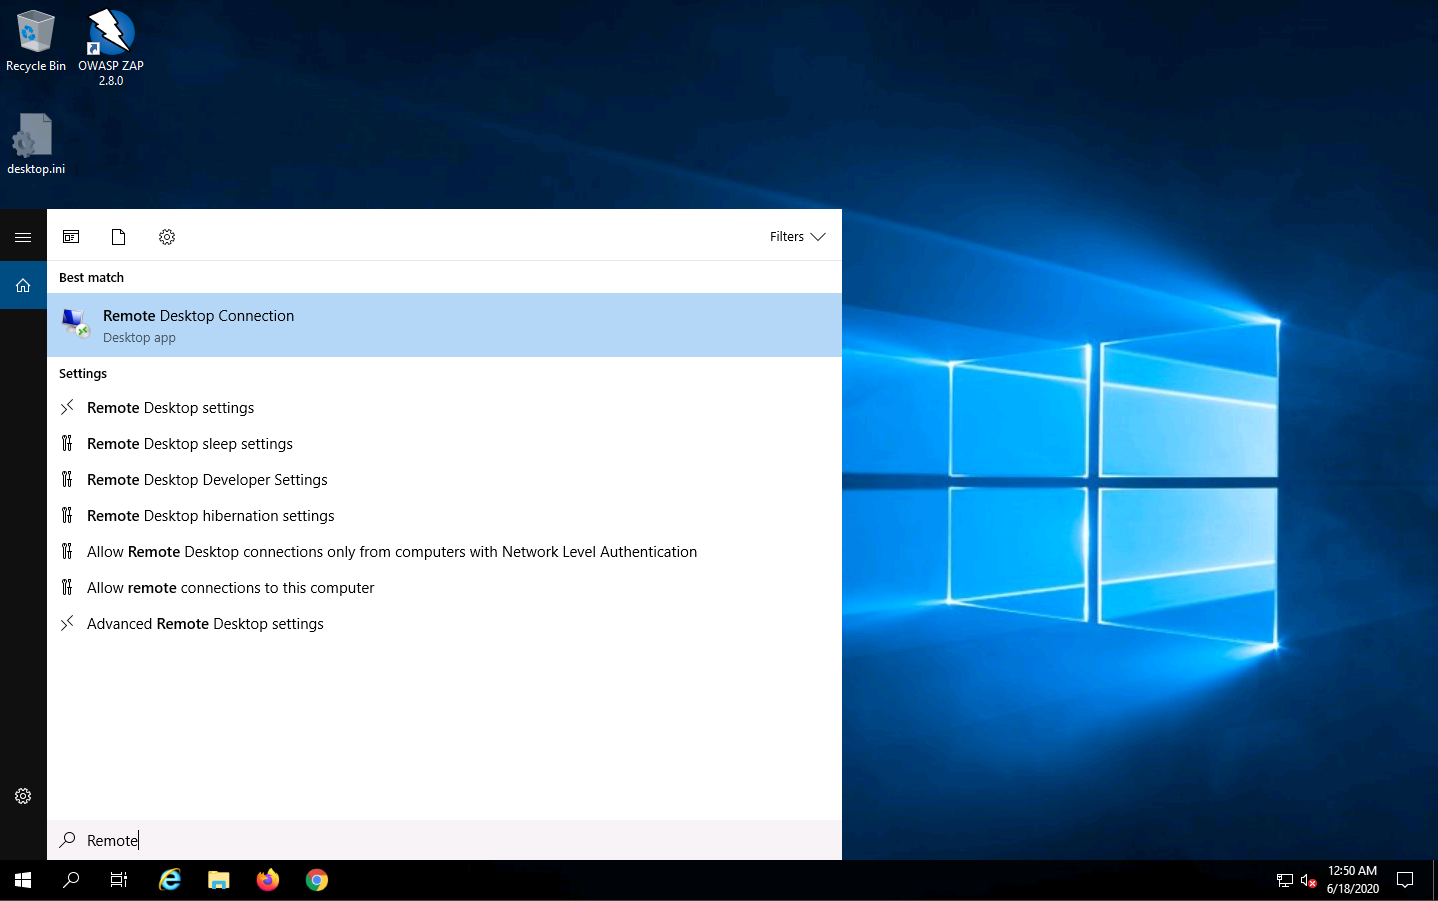
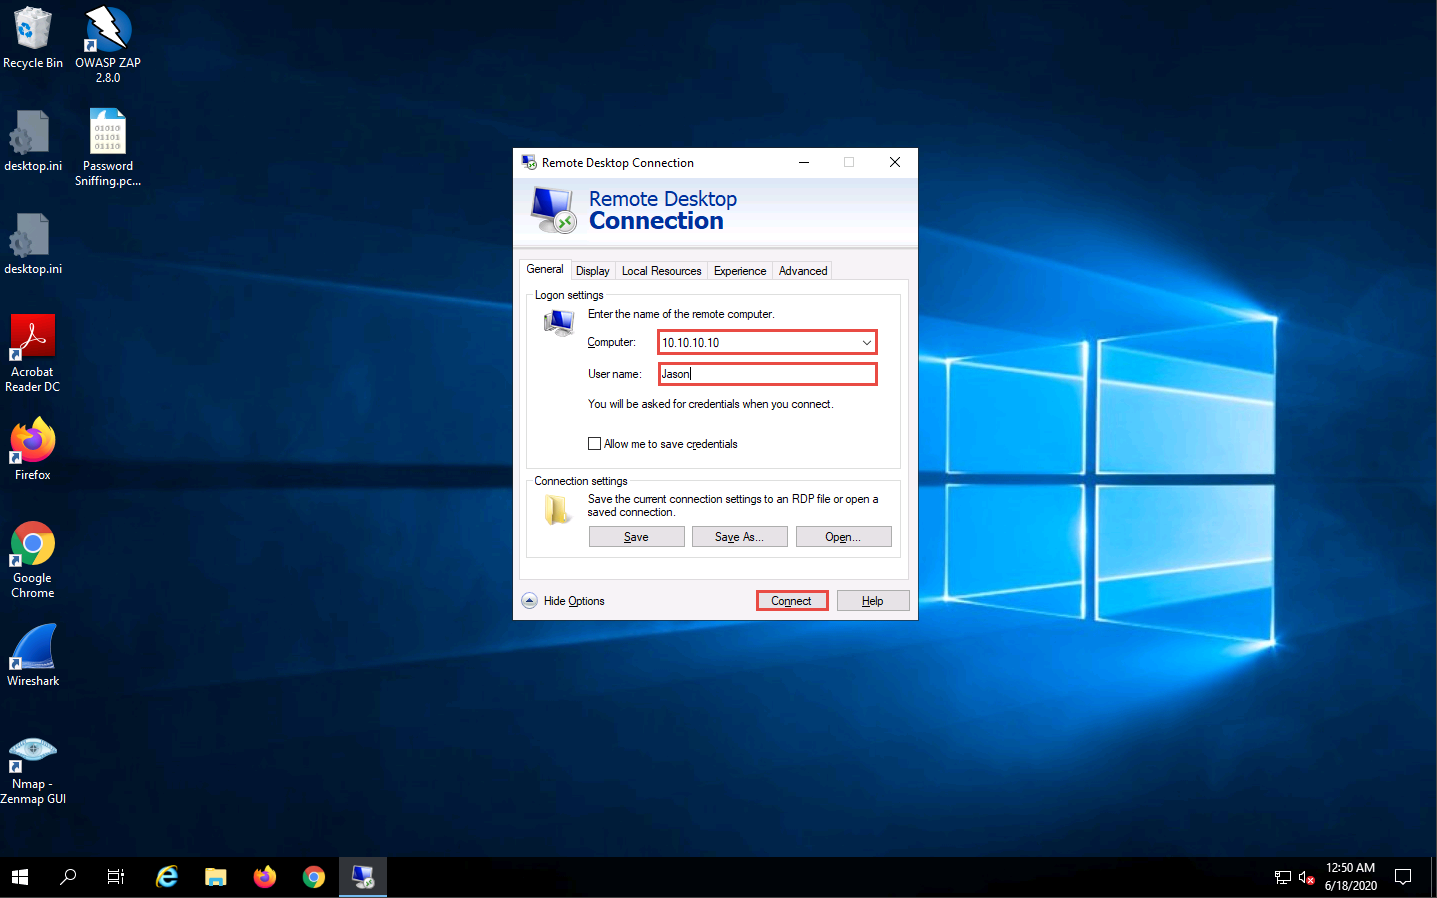
Click the Type here to search icon at the bottom of Desktop and type Remote. Click Remote Desktop Connection from the results.
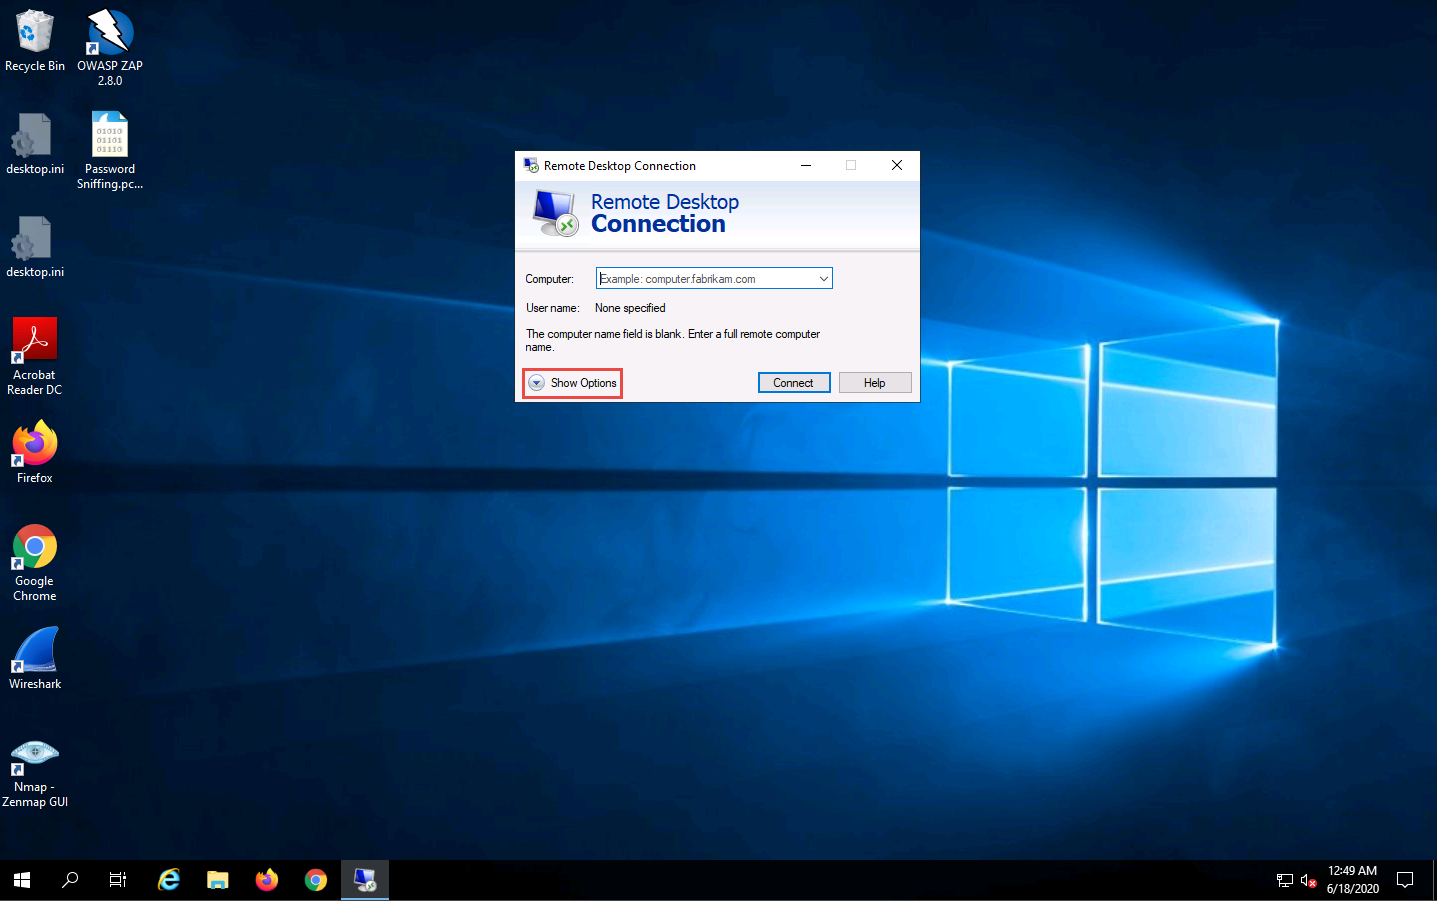
The Remote Desktop Connection dialog-box appears; click Show Options.
If some previously accessed IP address appears in the Computer field, delete it.
The dialog-box expands; under the General tab, type 10.10.10.10 in the Computer field and Jason in the User name field; click Connect.
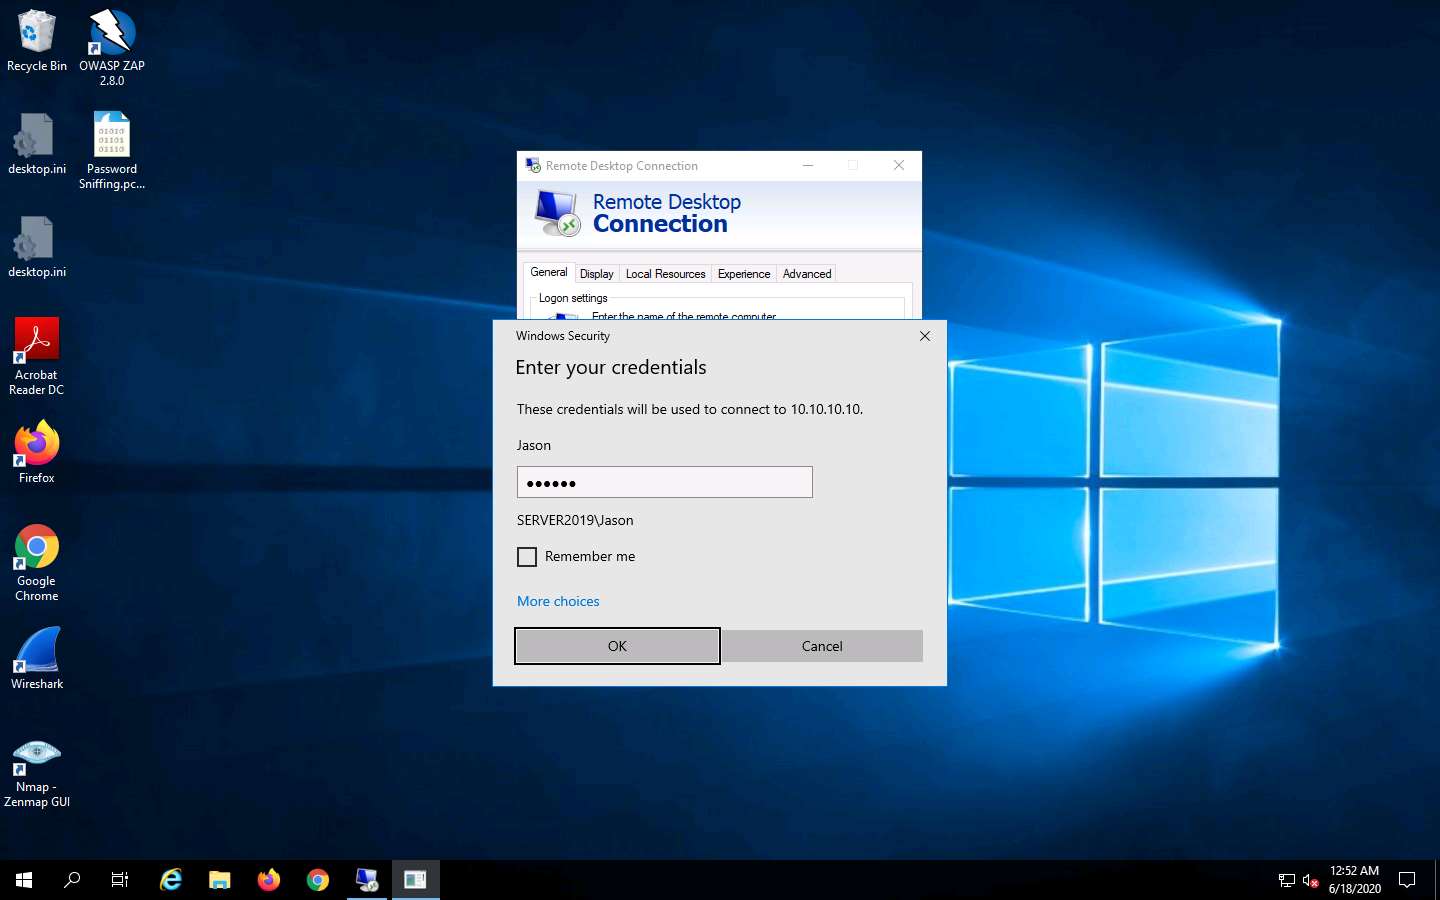
The IP address and username might differ in your lab environment. The target system credentials (Jason and qwerty) we are using here are obtained in the previous labs.
The Windows Security pop-up appears. Enter Password (qwerty) and click OK.
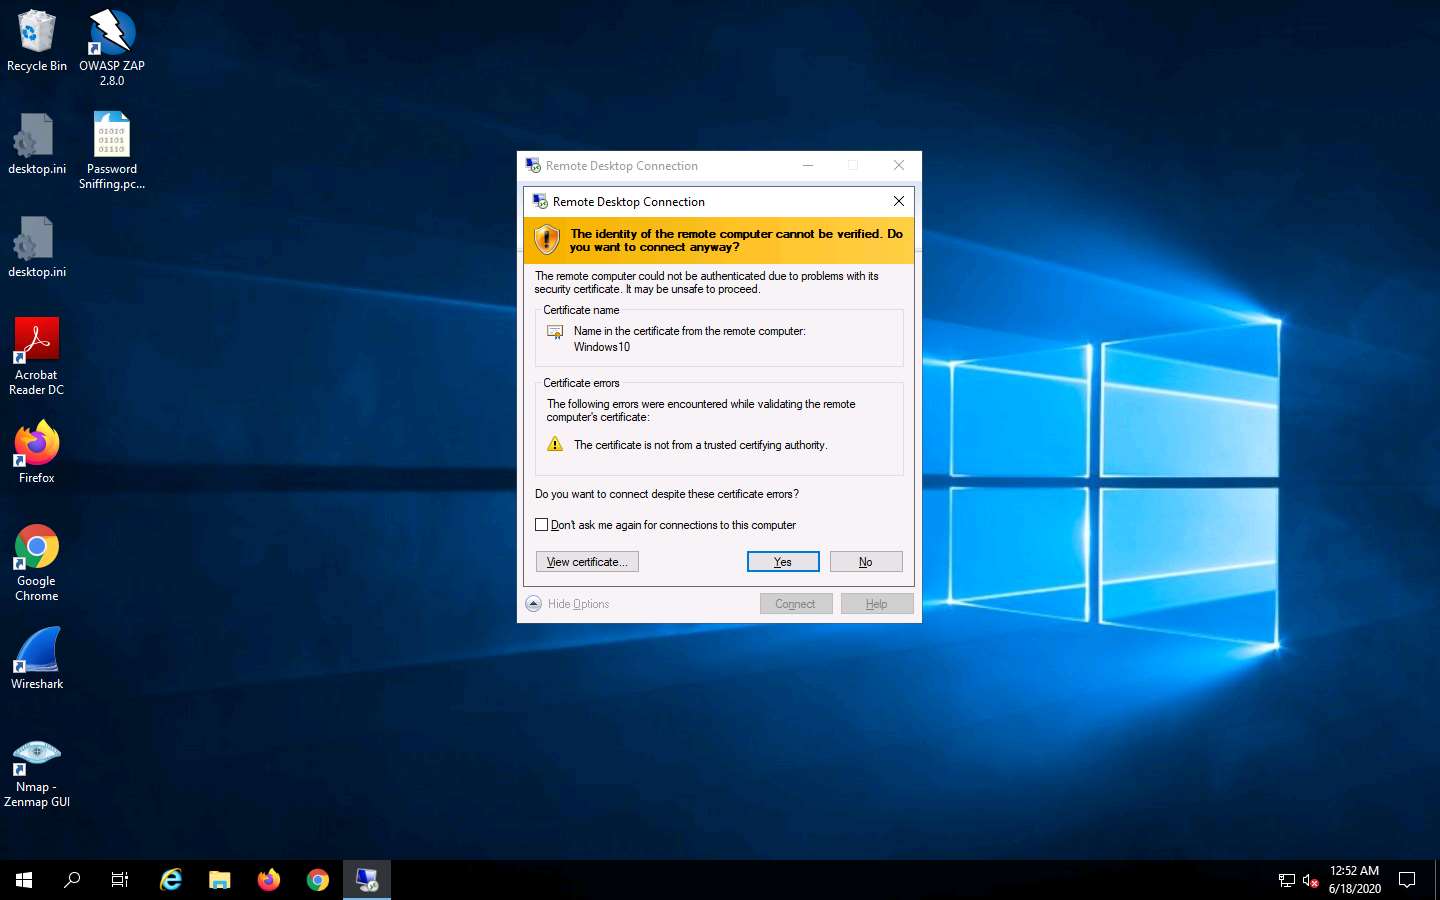
The Remote Desktop Connection pop-up appears; click Yes.
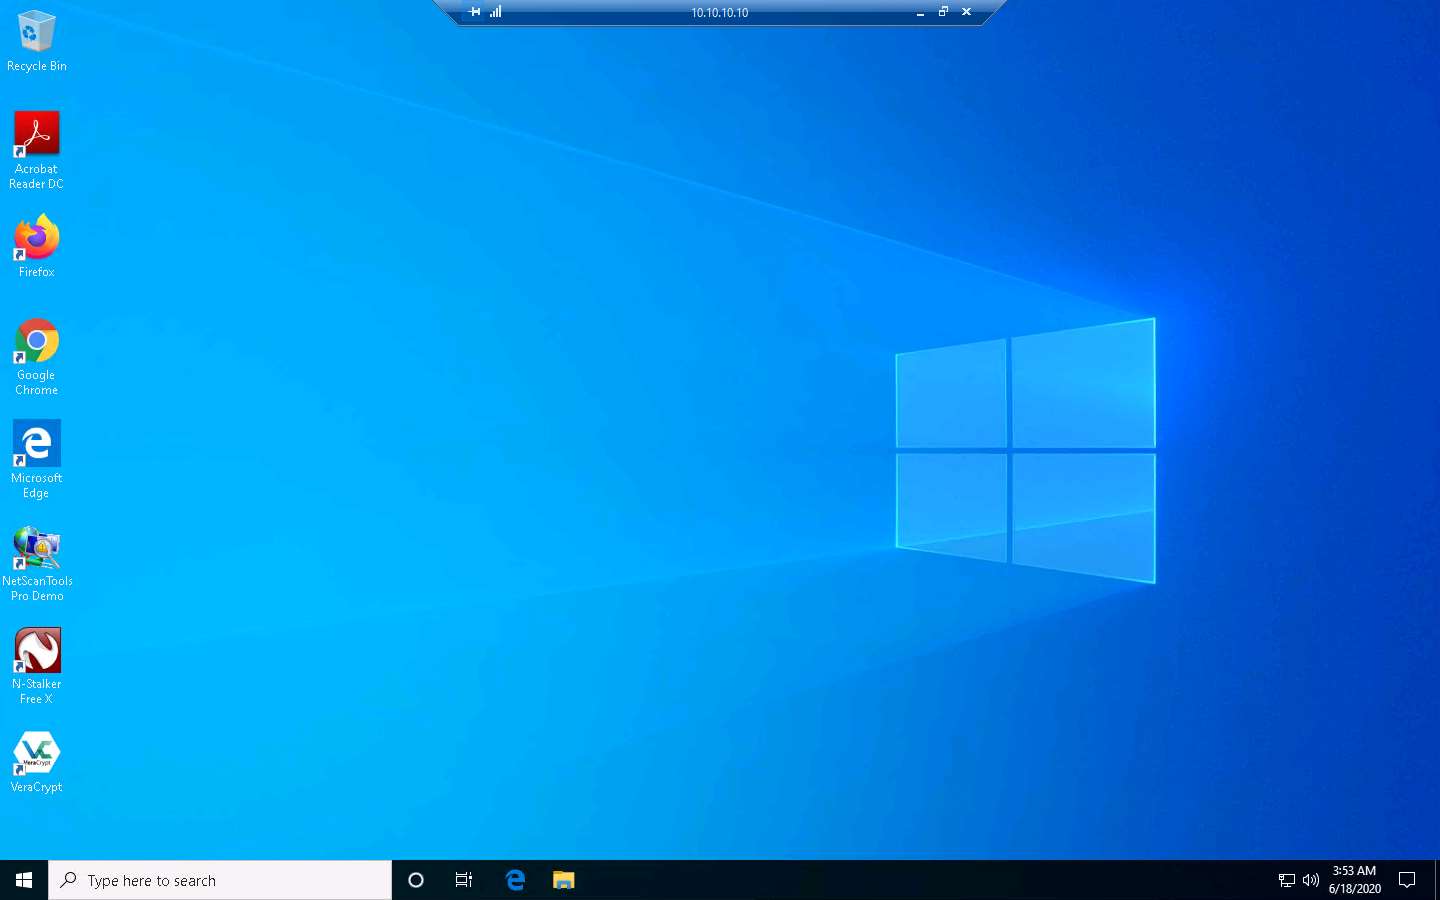
A remote connection to the target system (Windows 10) appears, as shown in the screenshot.
Click Type here to search at the bottom of Desktop and type Control. Click Control Panel from the results.
The Control Panel window appears; navigate to System and Security --> Administrative Tools. In the Administrative Tools control panel, double-click Services.
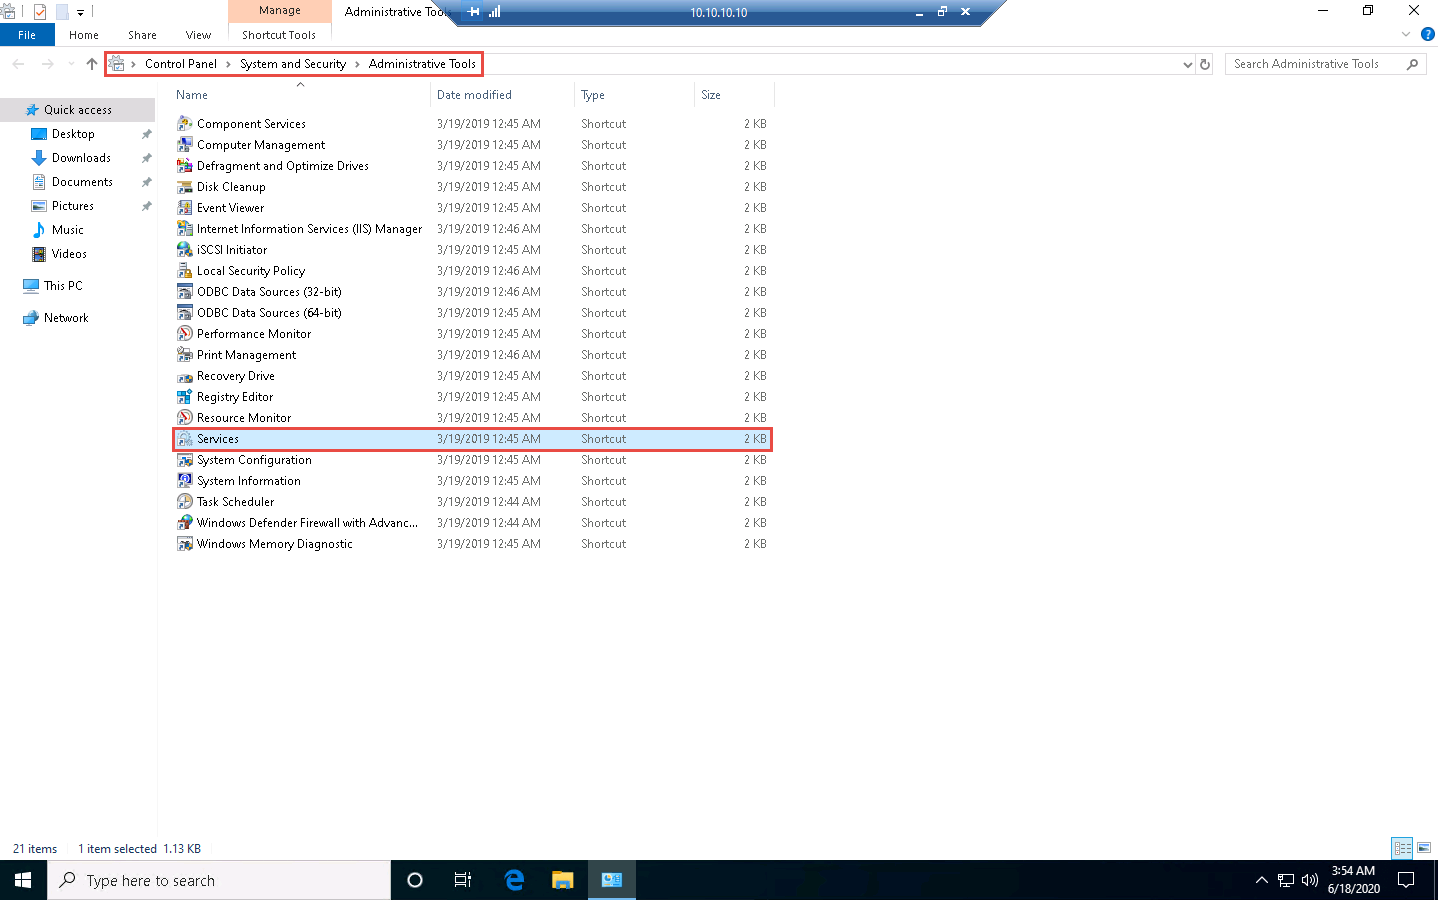
The Services window appears. Choose Remote Packet Capture Protocol v.0 (experimental), right-click the service, and click Start.
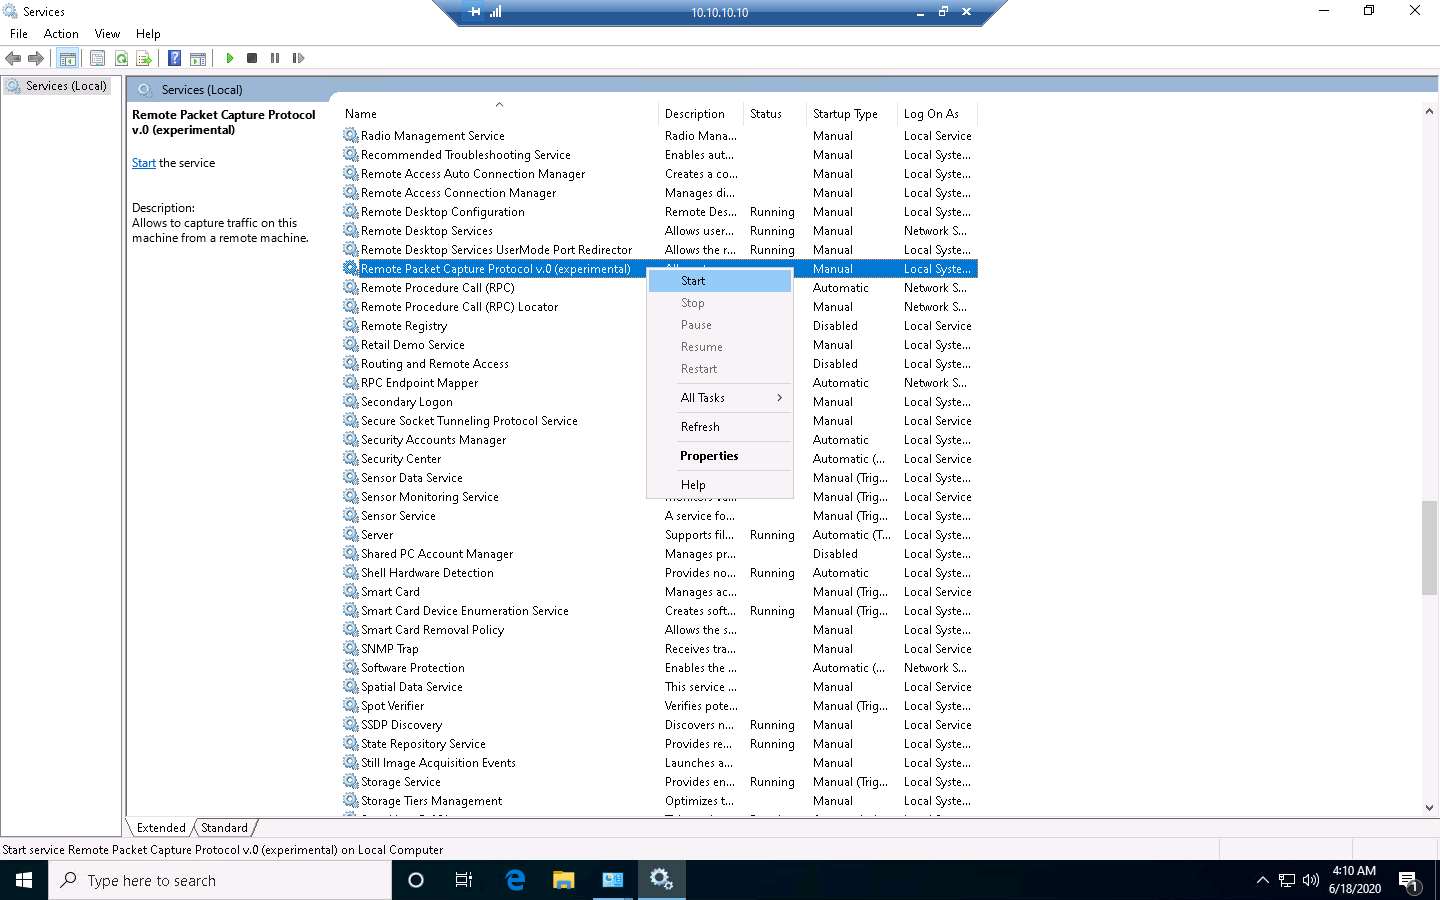
The Status of the Remote Packet Capture Protocol v.0 (experimental) service will change to Running, as shown in the screenshot.

Close all open windows on the Windows 10 machine and close Remote Desktop Connection.
If a Remote Desktop Connection pop-up appears, click OK.
Now, launch Wireshark by double-clicking Wireshark shortcut on the Desktop.
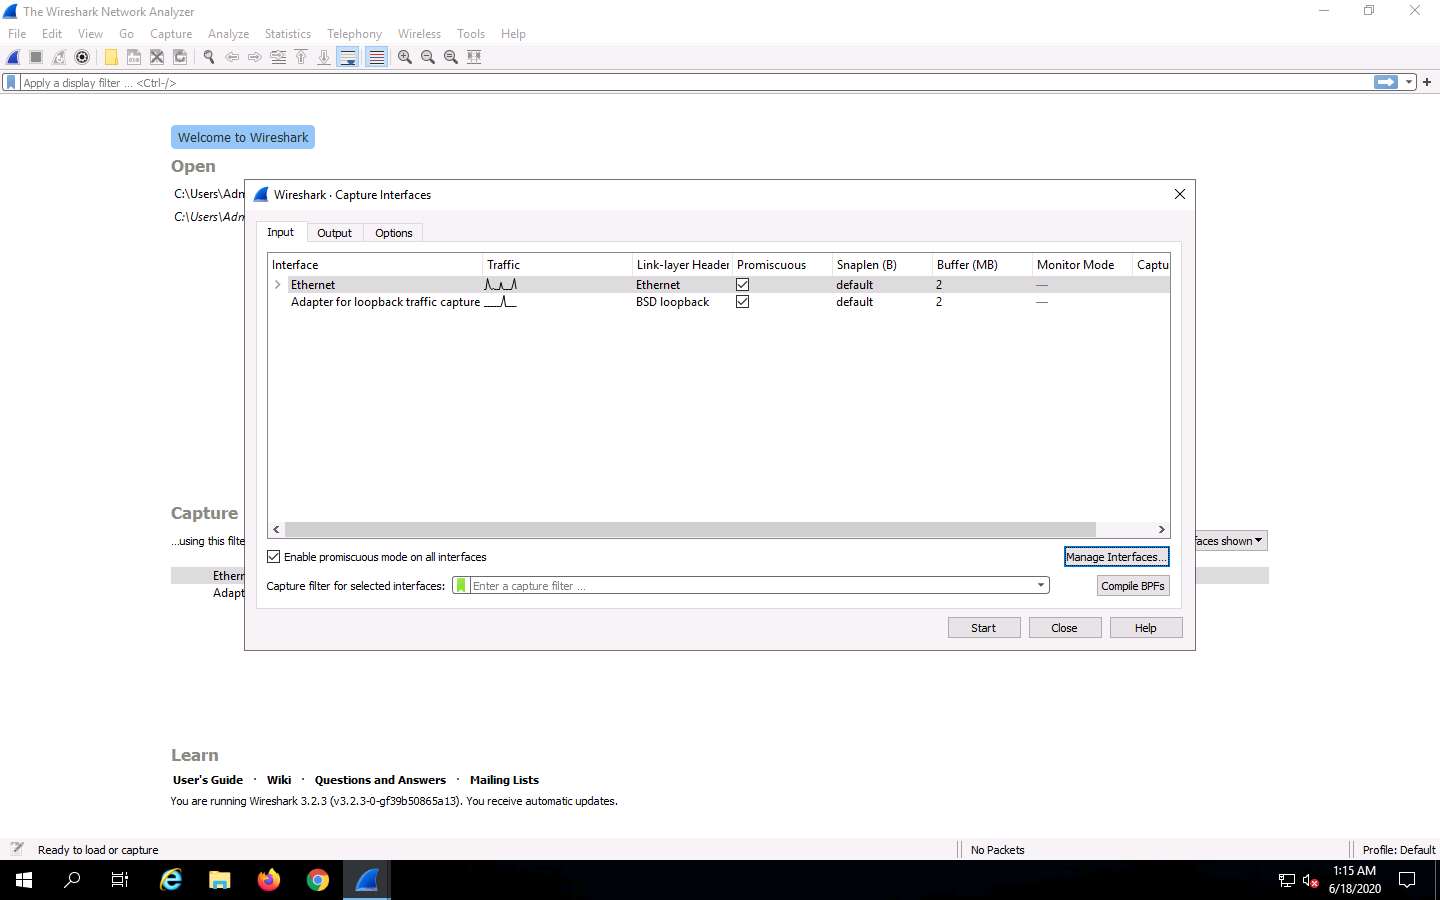
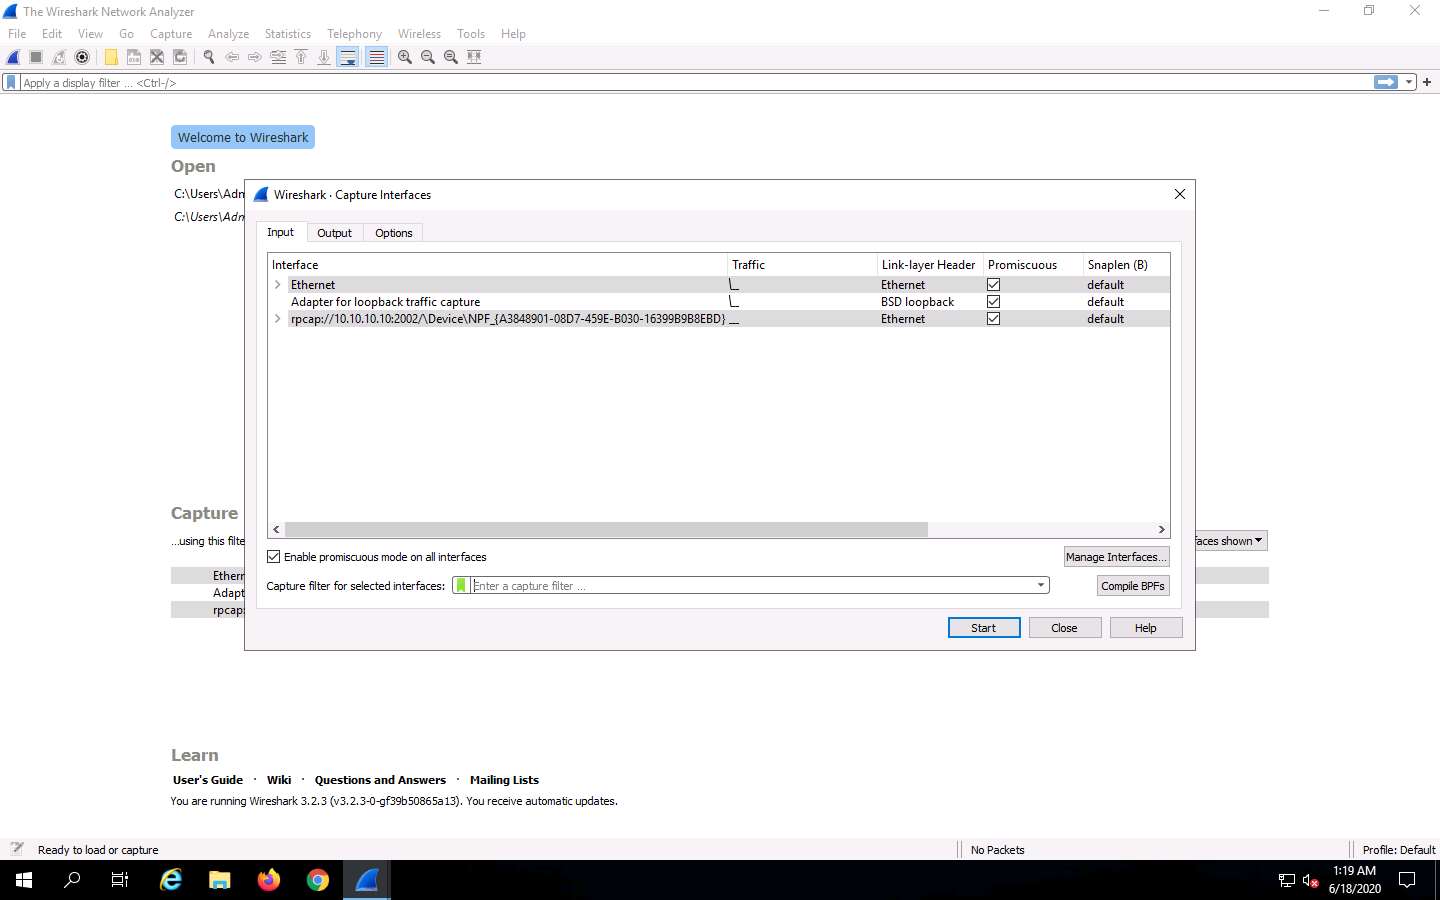
The Wireshark Network Analyzer window appears; click the Capture options icon from the toolbar.
The Wireshark. Capture Interfaces window appears; click the Manage Interfaces… button.
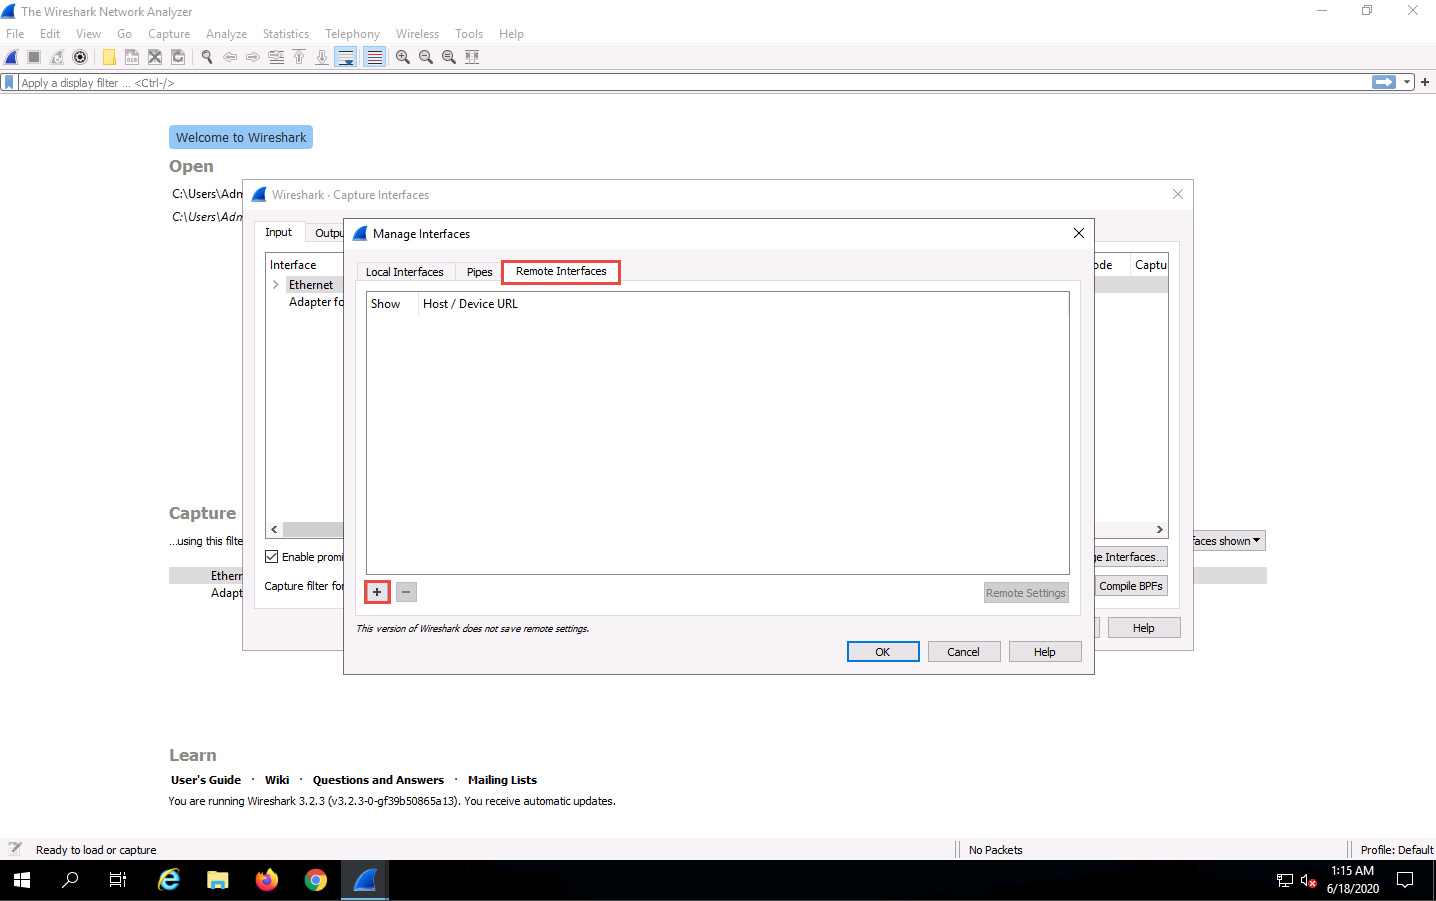
The Manage Interfaces window appears; click the Remote Interfaces tab, and then the Add a remote host and its interface icon (+).
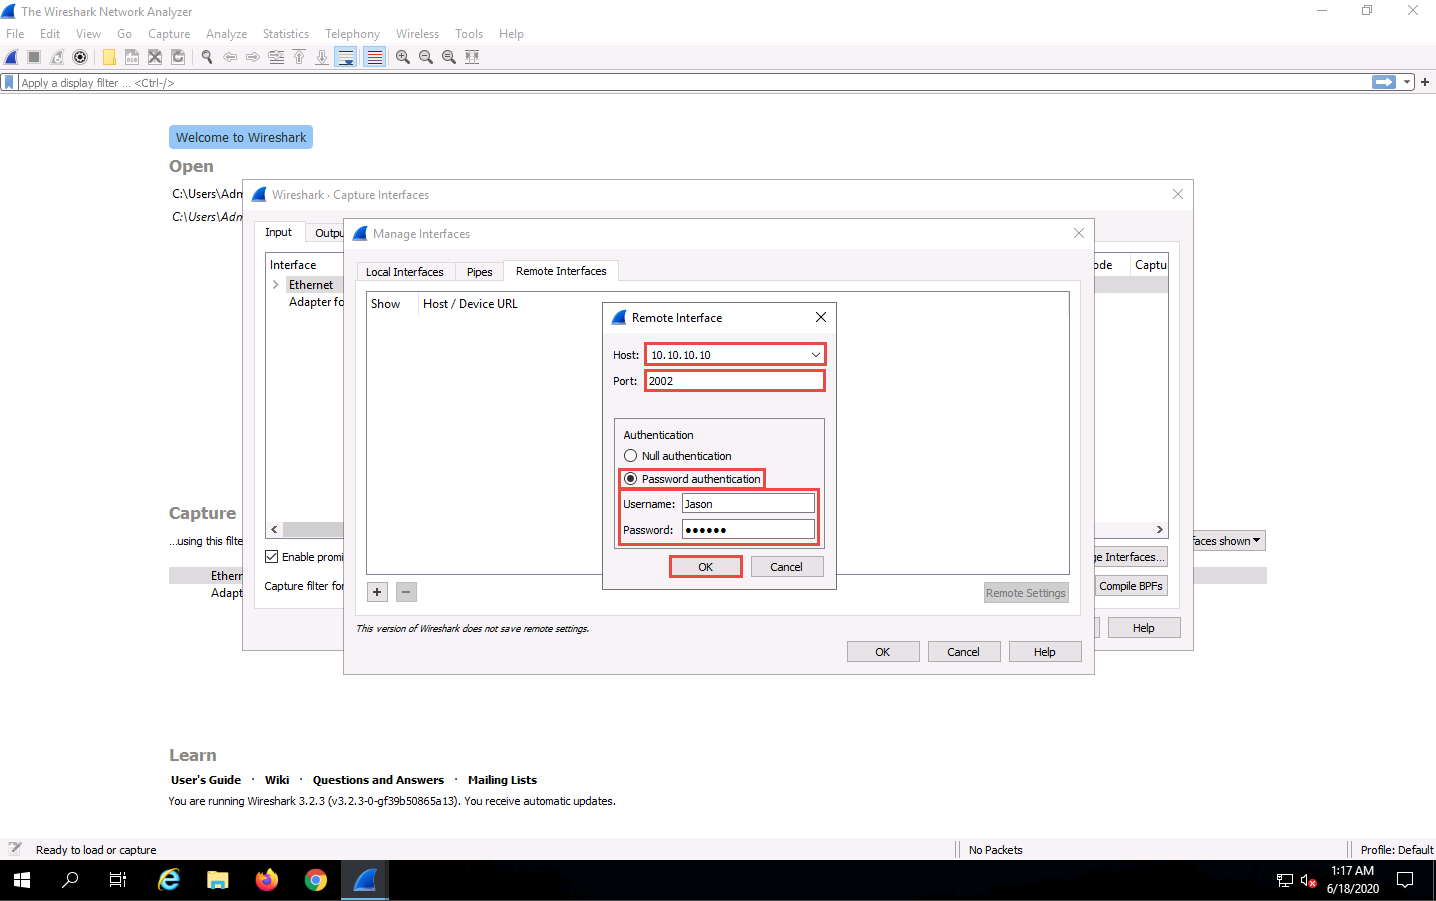
The Remote Interface window appears. In the Host text field, enter the IP address of the target machine (here, 10.10.10.10); and in the Port field, enter the port number as 2002.
Under the Authentication section, select the Password authentication radio button and enter the target machine’s user credentials (here, Jason and qwerty); click OK.
The IP address and user credentials may differ in your lab environment.
A new remote interface is added to the Manage Interfaces window; click OK.
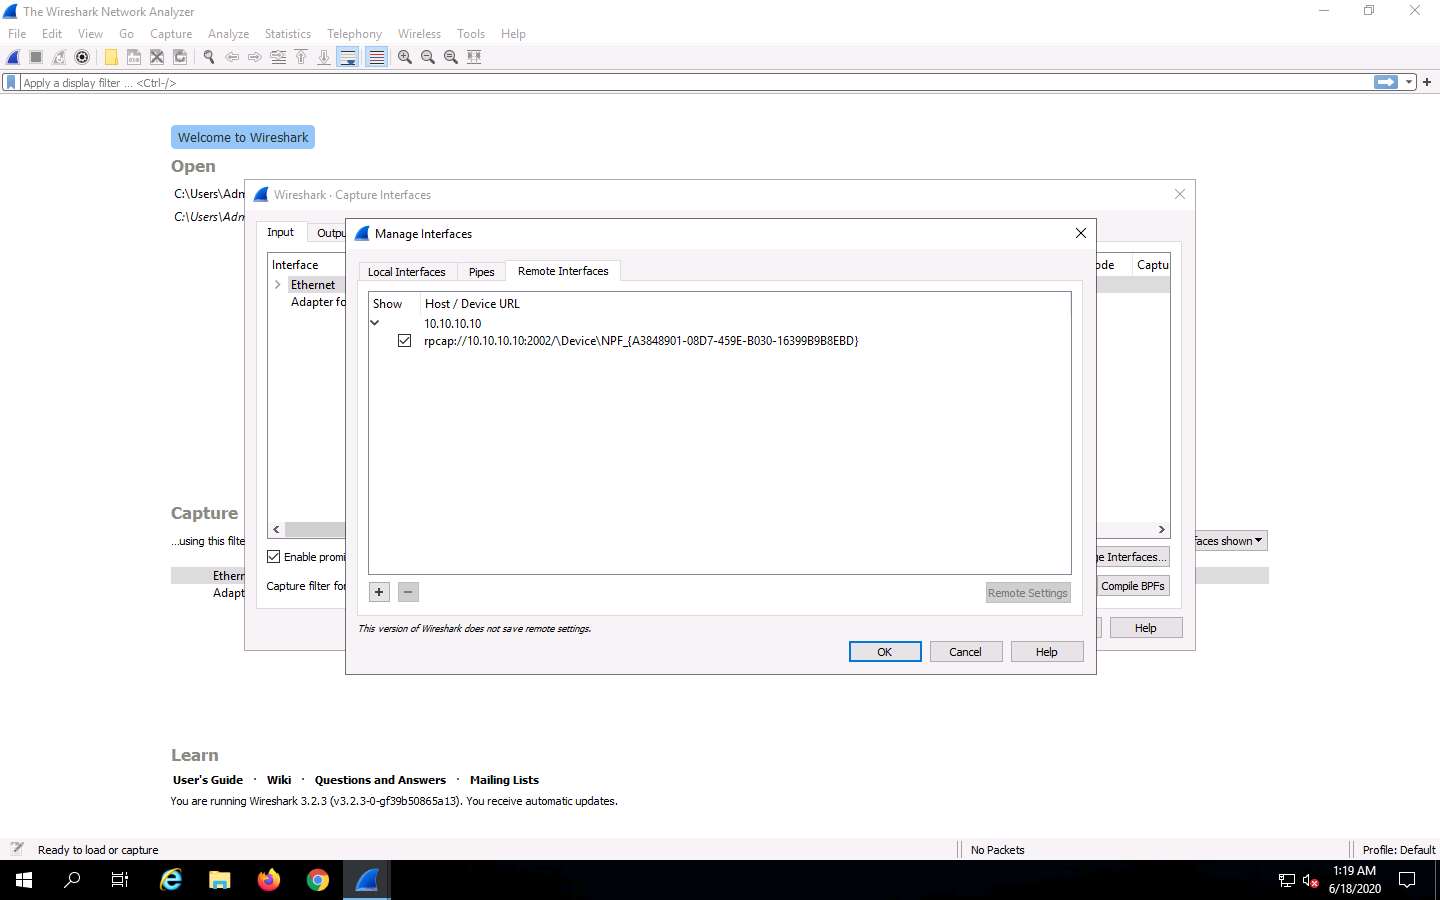
The newly added remote interface appears in the Wireshark. Capture Interfaces window; click Start.
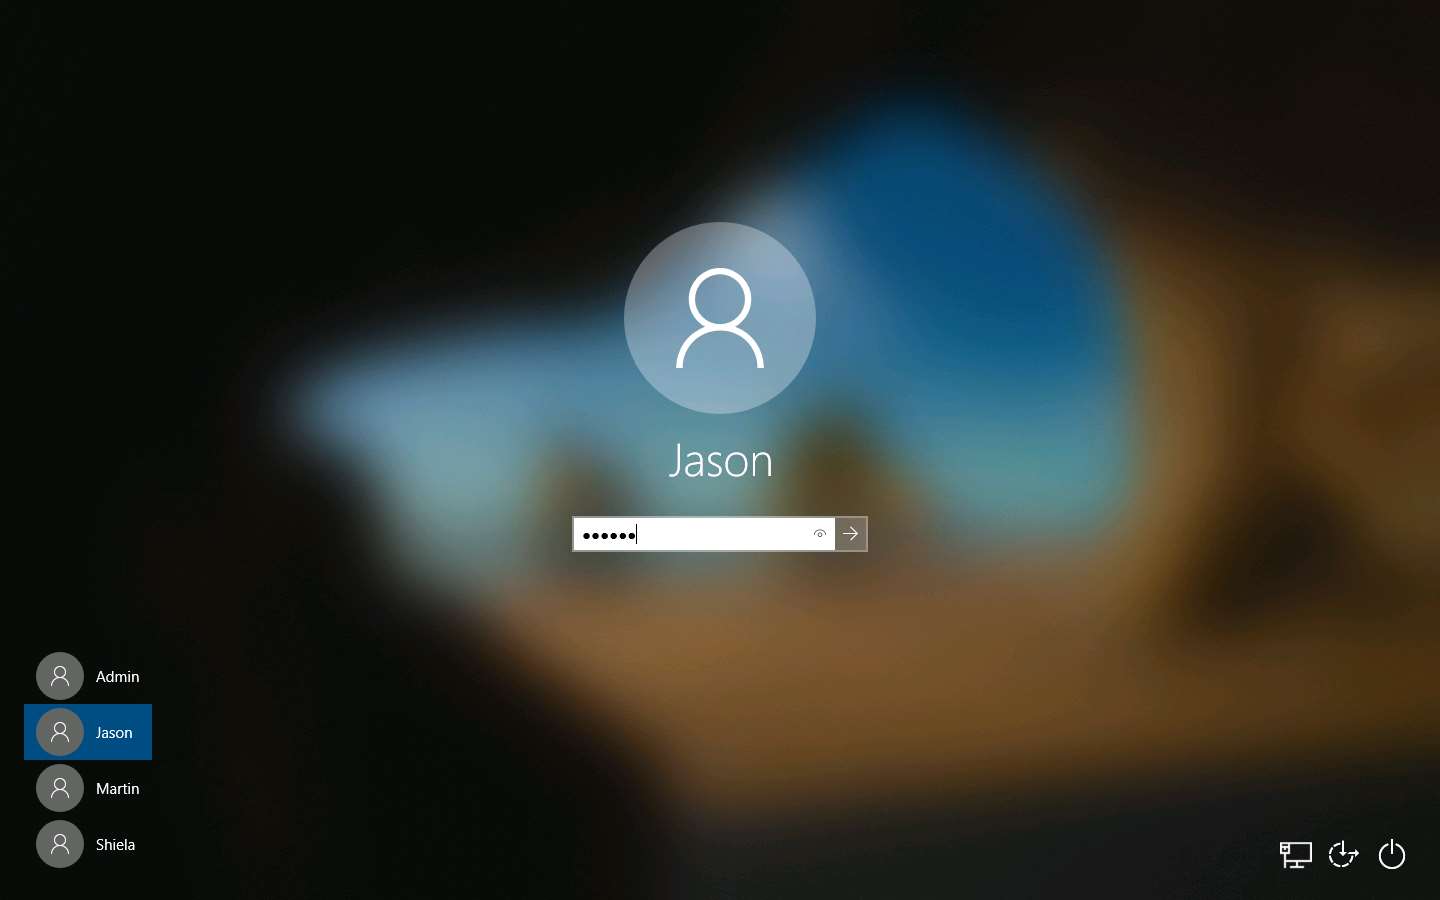
Click Windows 10 to switch to the Windows 10 machine, click Ctrl+Alt+Delete. Select Jason from the list of user accounts in the left-pane, click qwerty to enter the password and press Enter to log in. Here, you are signing in as the victim.
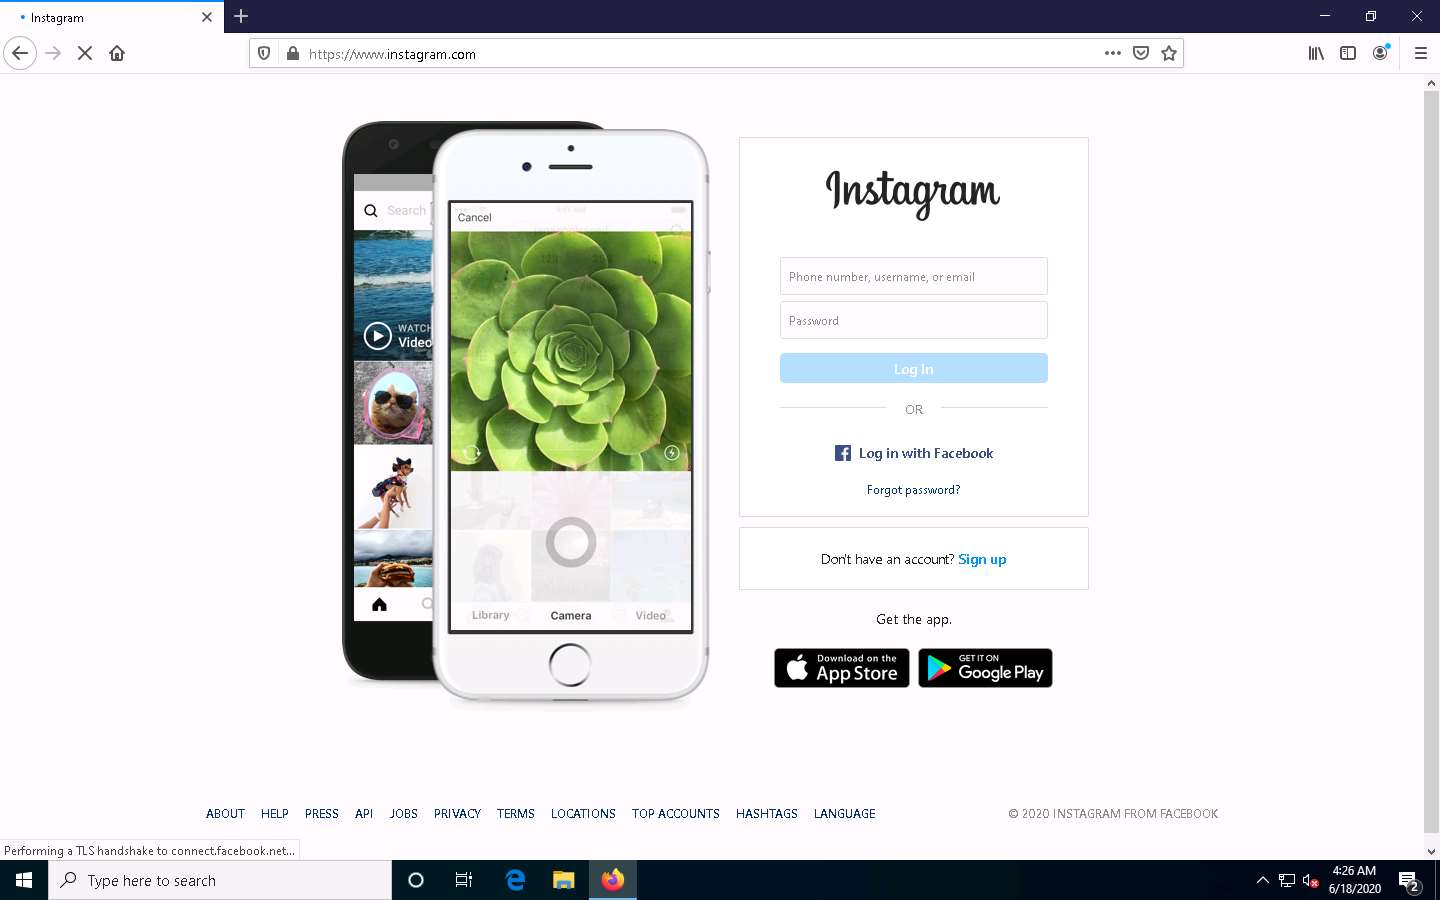
Acting as the target, open any web browser (here, Mozilla Firefox) and browse the website of your choice (here, www.instagram.com).
Although we are only browsing the Internet here, you could also log in to your account and sniff the credentials.
Click Windows Server 2019 to switch back to the Windows Server 2019 machine. Wireshark starts capturing packets as soon as the user (here, you) begins browsing the Internet, the shown in the screenshot.
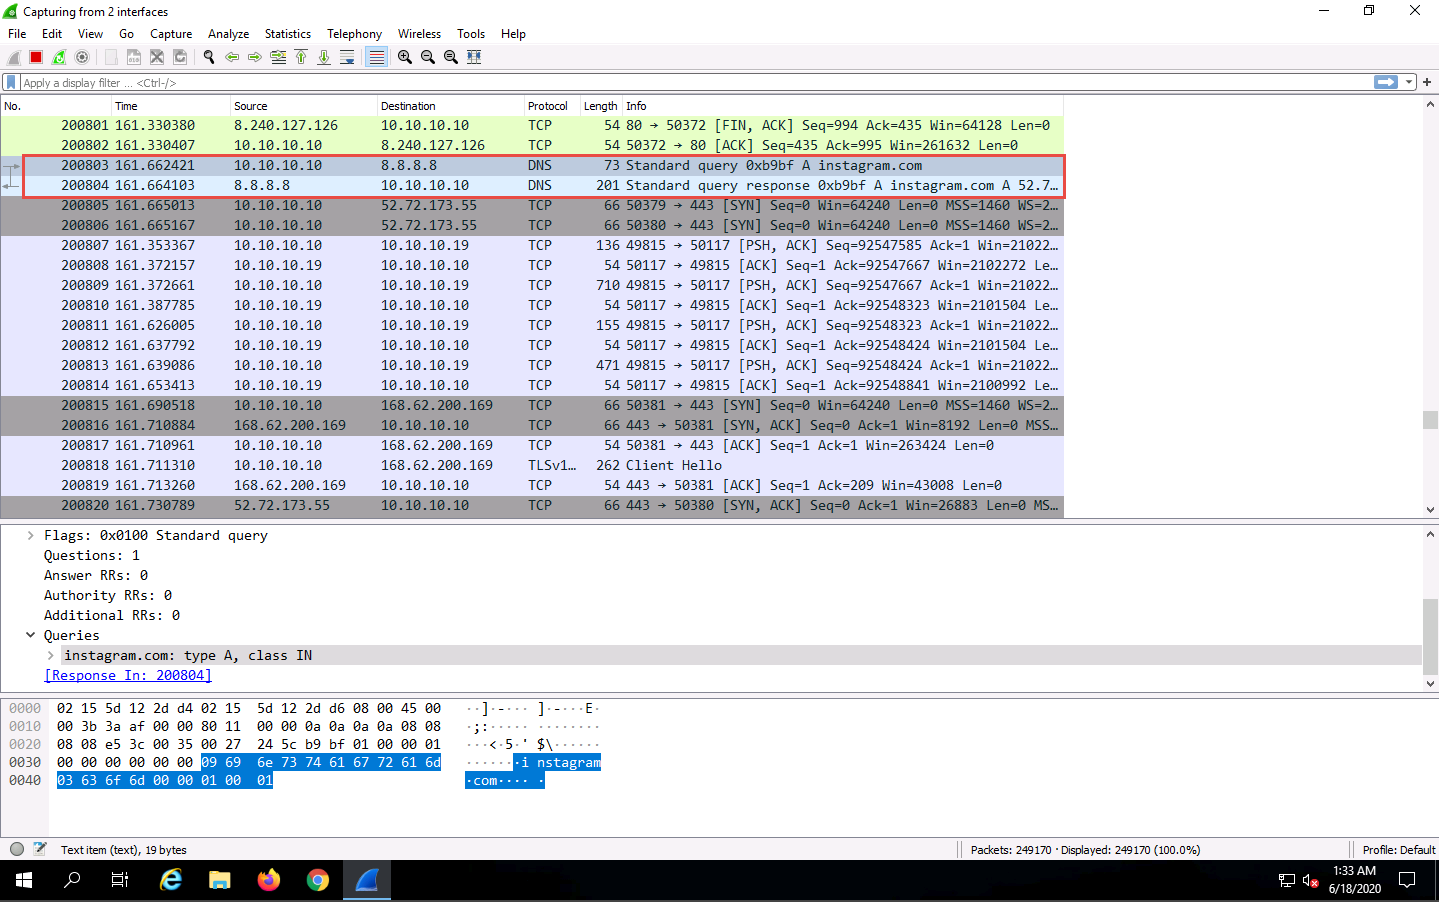
You can see the websites browsed by the victim on the target system in the Info section.
After a while, click the Stop capturing packet icon on the toolbar to stop live packet capture.
This way, you can use Wireshark to capture traffic on a remote interface.
In real-time, when attackers gain the credentials of a victim’s machine, they attempt to capture its remote interface and monitor the traffic its user browses to reveal confidential user information.
This concludes the demonstration of how to perform password sniffing using Wireshark.
Close all open windows and document all the acquired information.
Task 2: Analyze a Network using the Omnipeek Network Protocol Analyzer
OmniPeek Network Analyzer provides real-time visibility and expert analysis of each part of the target network. It performs analysis, drills down, and fixes performance bottlenecks across multiple network segments. It includes analytic plug-ins that provide targeted visualization and search abilities.
An ethical hacker or pen tester can use this tool to monitor and analyze network traffic of the target network in real-time, identify the source location of that traffic, and attempt to obtain sensitive information as well as find any network loopholes.
Before starting this lab, we need to find the User IDs associated with the usernames for the Windows 10 machine.
Click Windows 10 to switch to the Windows 10 machine.
Open any browser (here, Mozilla Firefox), Place the cursor in the address bar and click on https://www.liveaction.com/products/omnipeek-network-protocol-analyzer/ in the address bar, and press Enter.
If a website cookie notification appears, click Accept.
The LiveAction website appears; click the Start Your 30-Day Trial button.
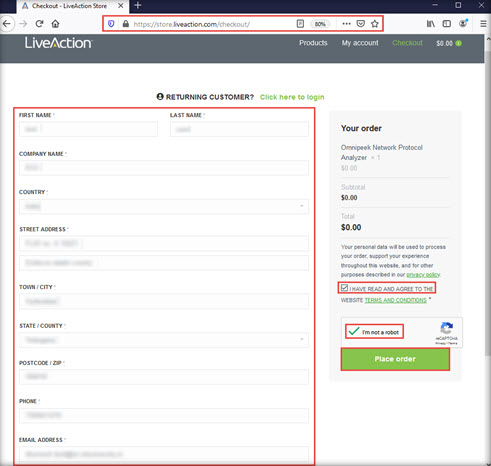
You will be redirected to a cart in live action, click checkout.
The LiveAction Store website appears. Input your personal details in all required fields. Click the I HAVE READ AND AGREE TO THE WEBSITE TERMS AND CONDITIONS checkbox and check the captcha in the right-hand pane. Click the Place order button.
Here, you must provide your professional EMAIL ADDRESS (work or school accounts).
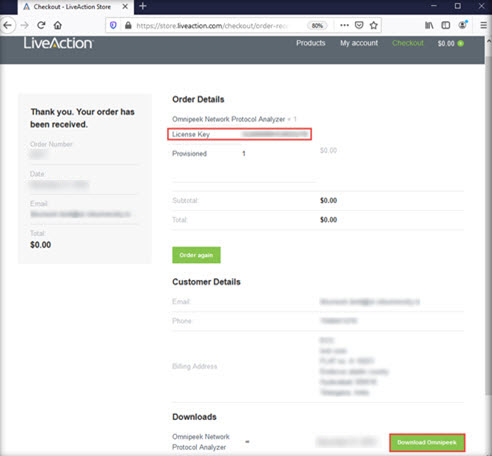
The Thank you. Your order has been received webpage appears, displaying the License Key and download link for Omnipeek. Click on the Download Omnipeek button to begin the download.
The Opening Omnipeek_13.0.0.msi pop-up appears; click Save File to download the application.
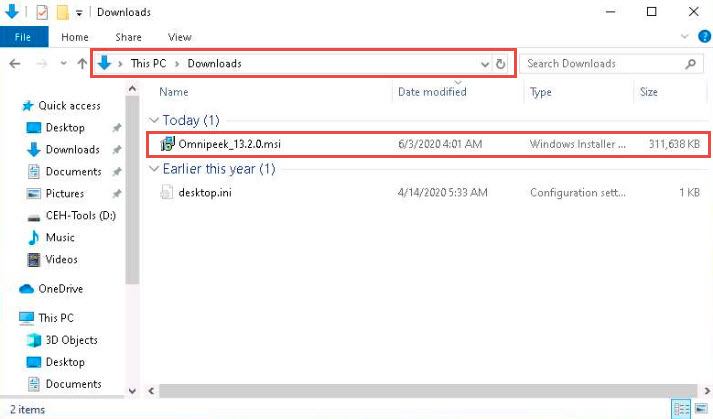
On completion of the download, navigate to the download location of the tool (here, Downloads) and double-click Omnipeek_13.0.0.msi.
If an Open File - Security Warning pop-up appears, click Run.
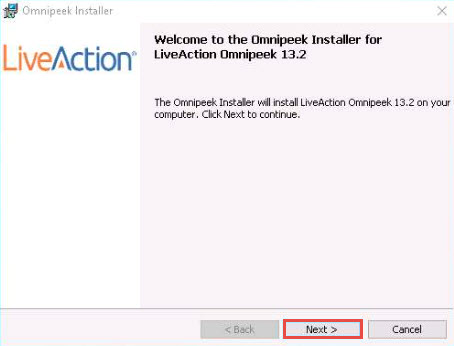
The OmniPeek Installer wizard appears; click Next.
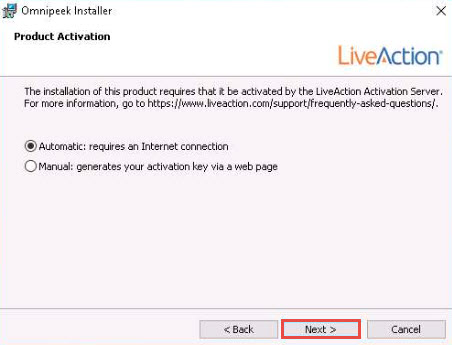
In the Product Activation wizard, ensure that the Automatic: requires an Internet connection radio-button is selected and click Next.
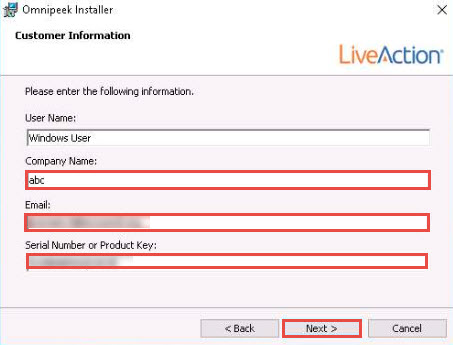
The Customer Information wizard appears; type a Company Name (here, abc) and Email (provided at the time of registration). For the serial number field, switch to the Mozilla Firefox browser and copy the License Key. Close the browser.
Switch back to the Ompnipeek Installer window, paste the License Key in the Serial Number or Product Key field, and then click Next.
Follow the wizard-driven installation steps to install Omnipeek using the default settings.
While Installing LiveAction Omnipeek, if a User Account Control pop-up appears, click Yes.
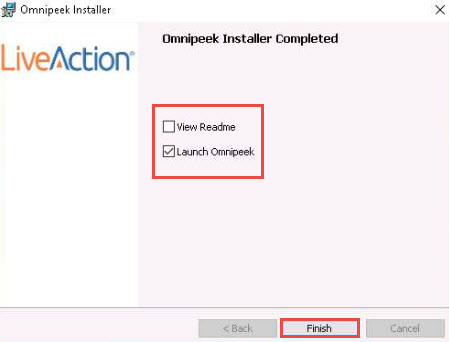
On completion of the installation, the Omnipeek Installer Completed wizard appears; uncheck View Readme, ensure that the Launch Omnipeek option is checked, and click Finish.
If a User Account Control pop-up appears, click Yes.
The Omnipeek evaluation dialog-box appears; click OK.
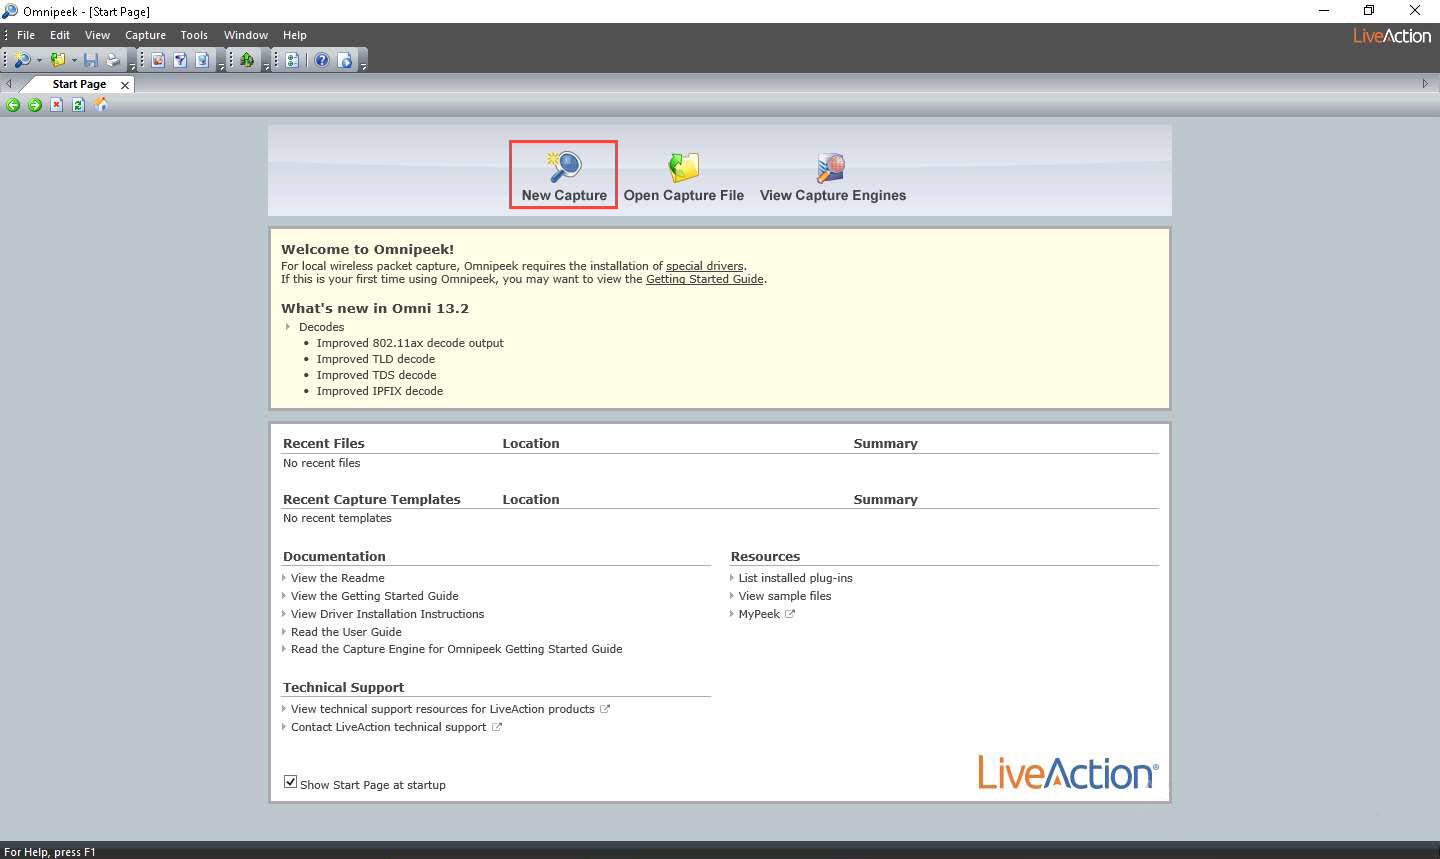
The Omnipeek main window appears, as shown in the screenshot.
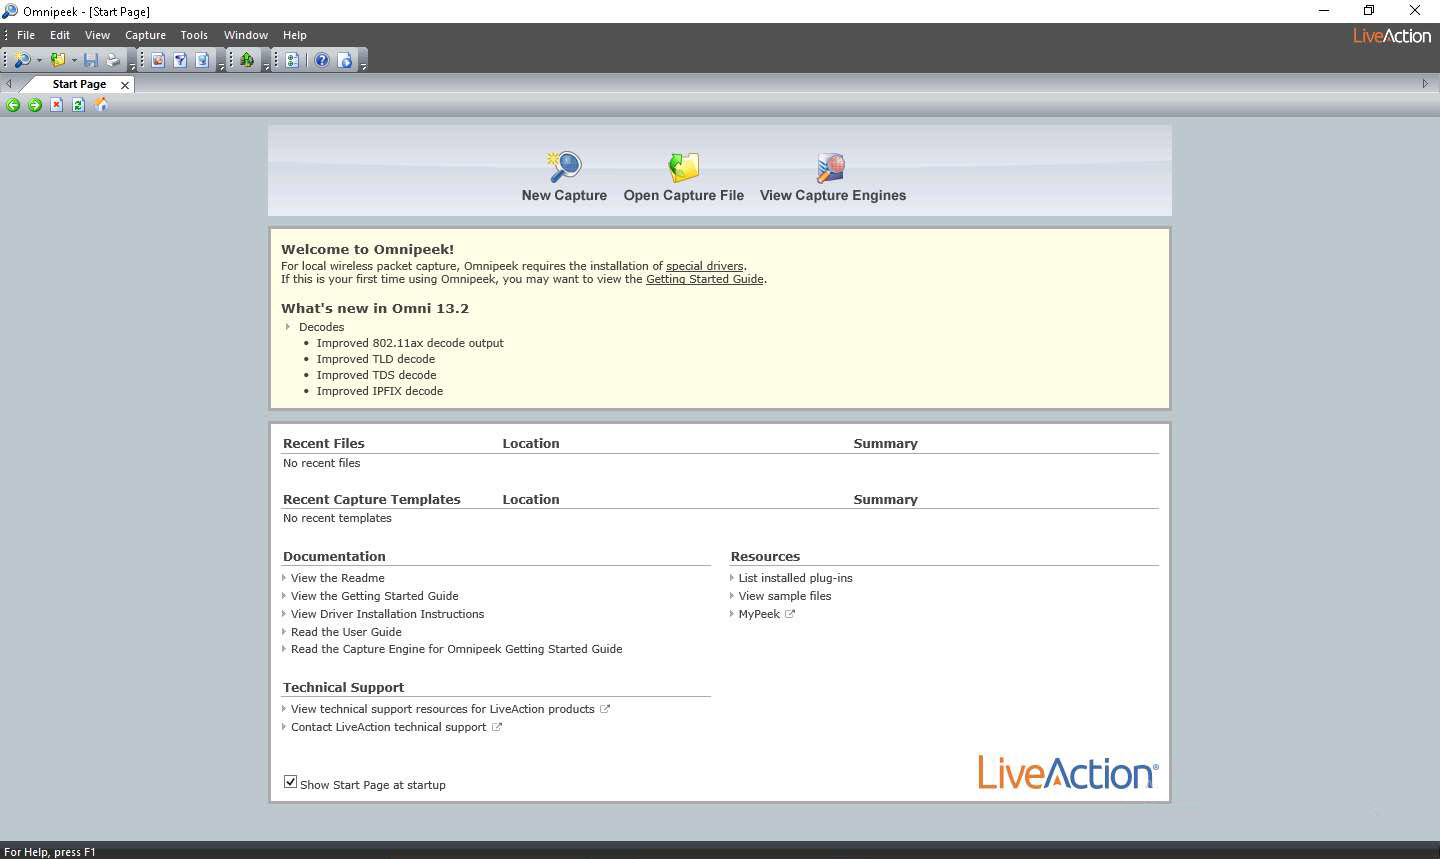
Click on the New Capture option from the Omnipeek’s main screen to create an Omnipeek capture window.
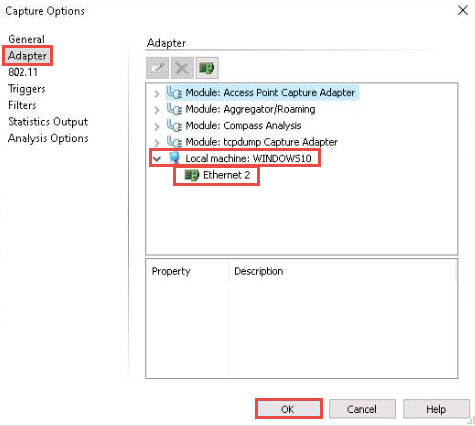
The Capture Options window appears; by default, the Adapter option opens-up.
Under the Adapter section in the right-hand pane, expand the Local machine: WINDOWS 10 node, select Ethernet2, and click OK.
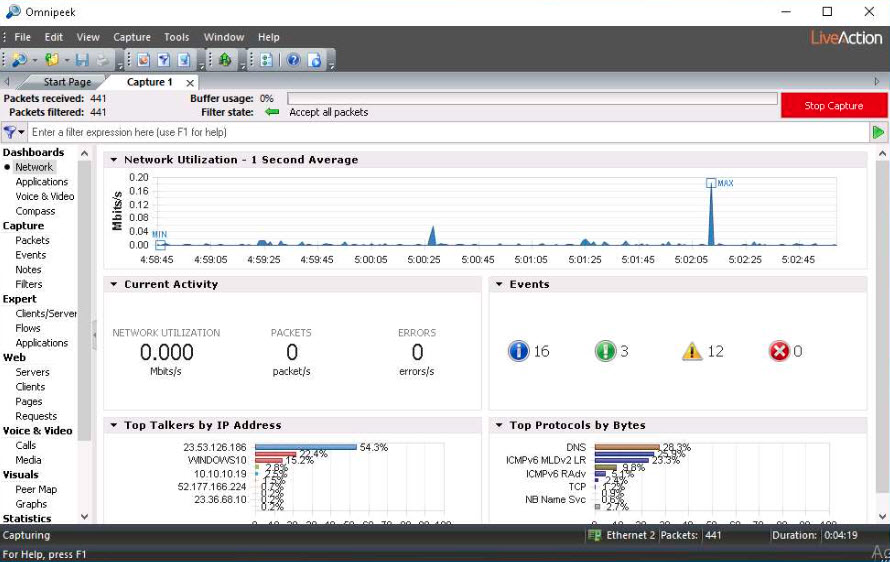
The Capture 1 tab appears; click the Start Capture button in the right-hand corner of the window to begin capturing packets.
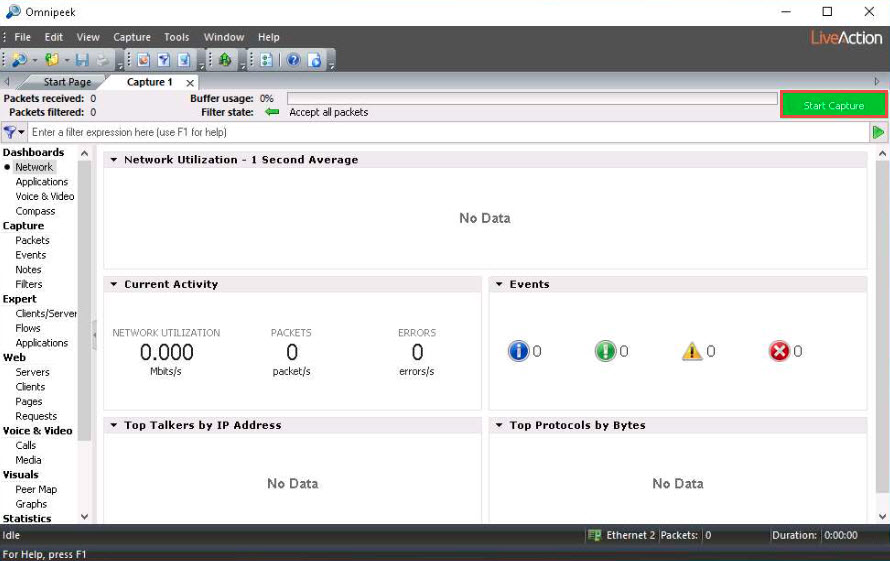
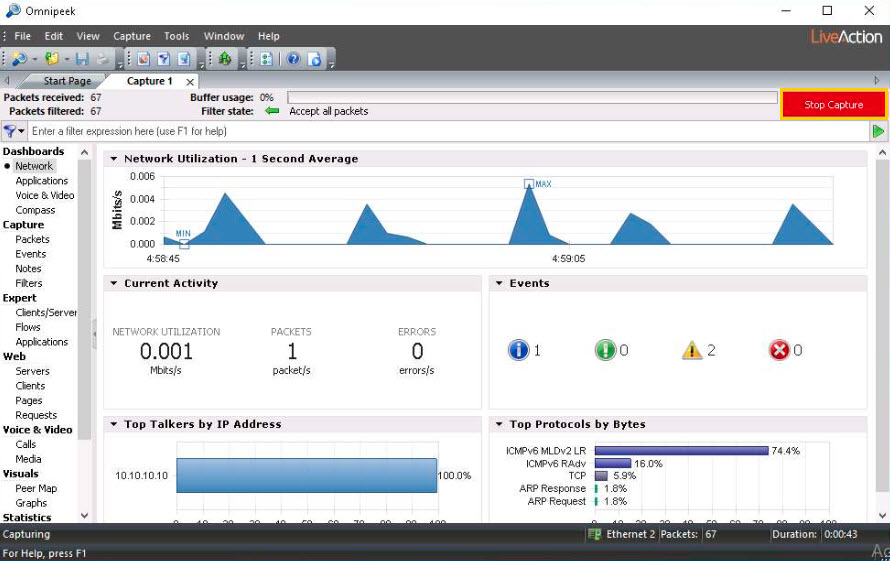
The Start Capture button changes to read “Stop Capture” and traffic statistics begin to populate Network under the Dashboards section, as shown in the screenshot.
Click Windows Server 2019 to switch to the Windows Server 2019 machine.
Acting as the target, open any web browser (here, Mozilla Firefox) and browse the website of your choice (here, www.facebook.com).
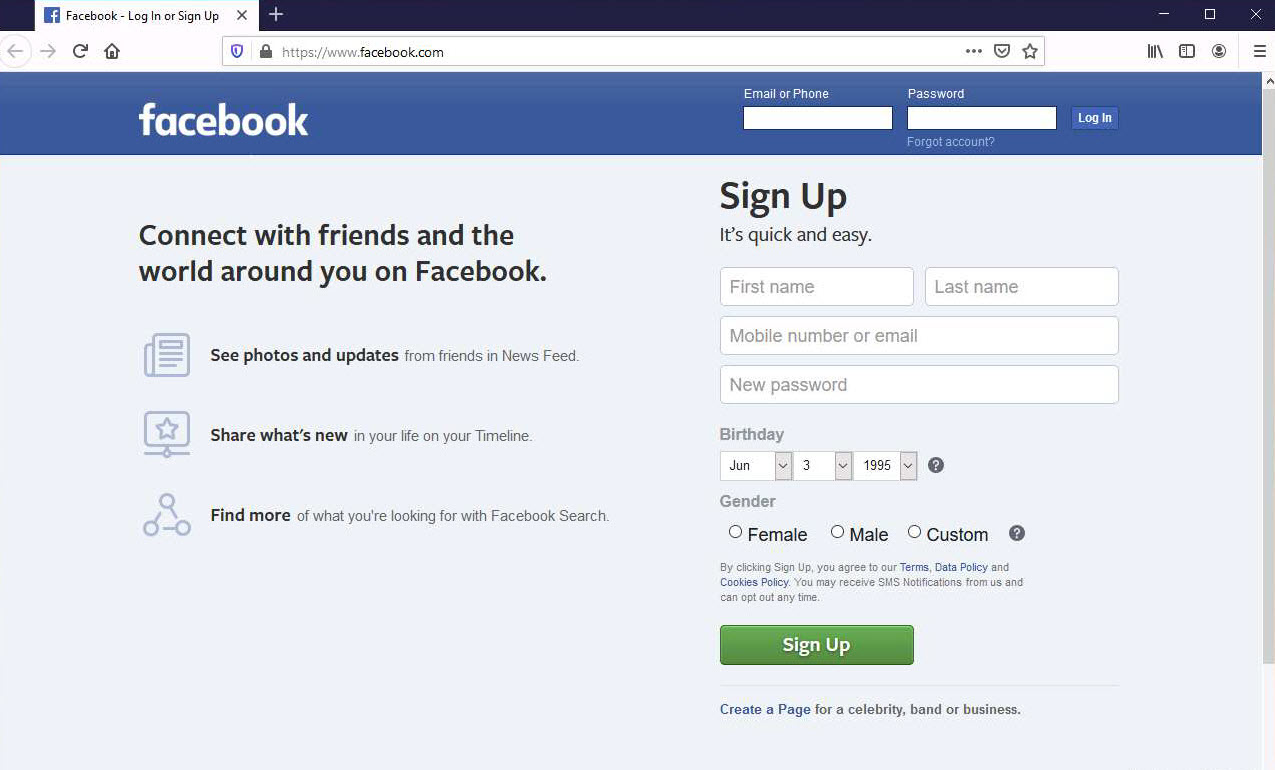
Now, click Windows 10 to switch back to the Windows 10 machine. The captured statistical analysis of the data is displayed in the Capture 1 tab of the navigation bar.
You can observe the network traffic along with the websites visited by the target machine.
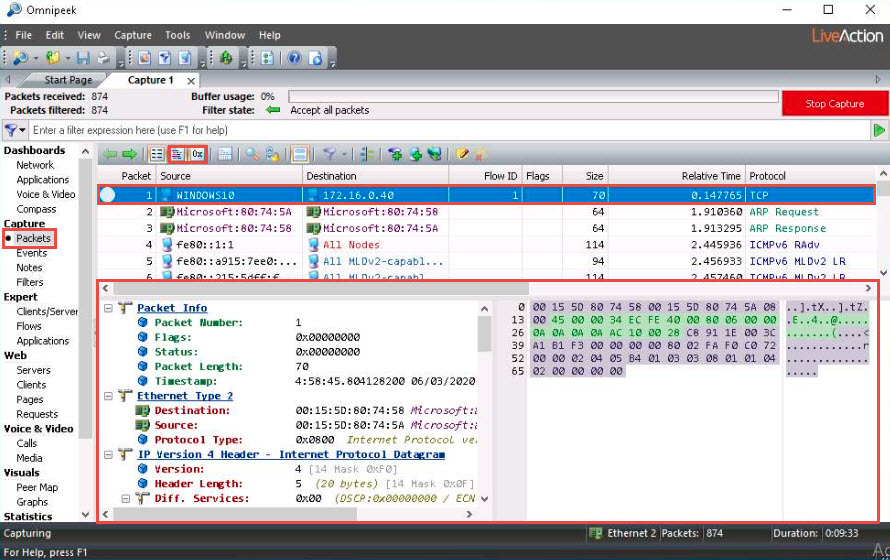
To view the captured packets, select Packets under the Capture section in the left-hand pane. You can observe the outgoing and incoming network packets of the target system.
You can further click the Show Decode View and Show Hex View icons to view detailed information regarding any selected packet.
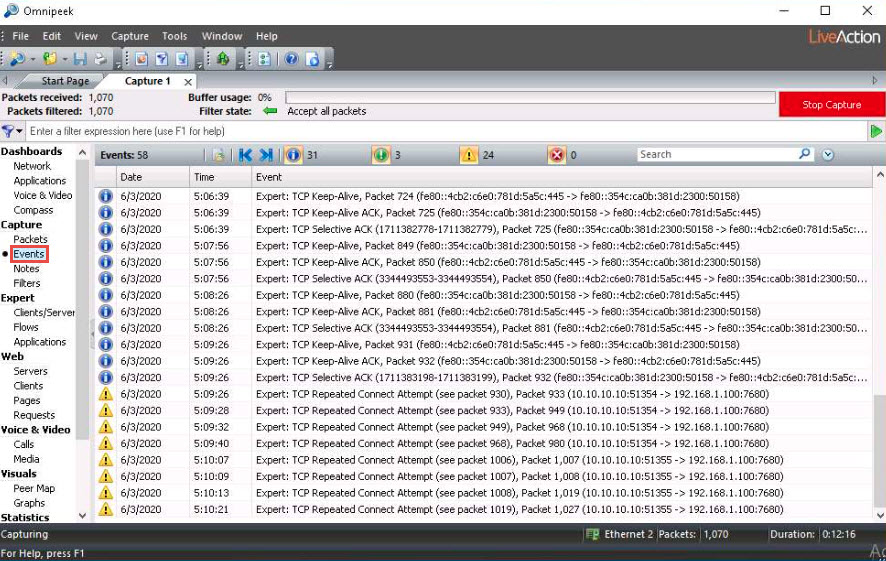
Click Events under the Capture section in the left-hand pane to view the events occurring in the network.
Click Clients/Servers under the Expert section in the left-hand pane to view a list of active systems in the local network.
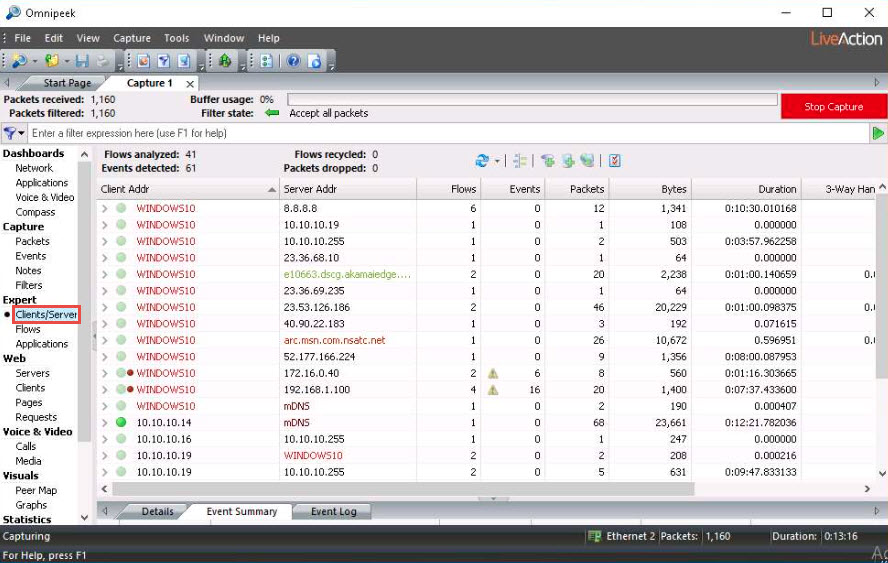
Similarly, under the Flows and Applications options, you can view the packet flow and applications running on the systems in the local network.
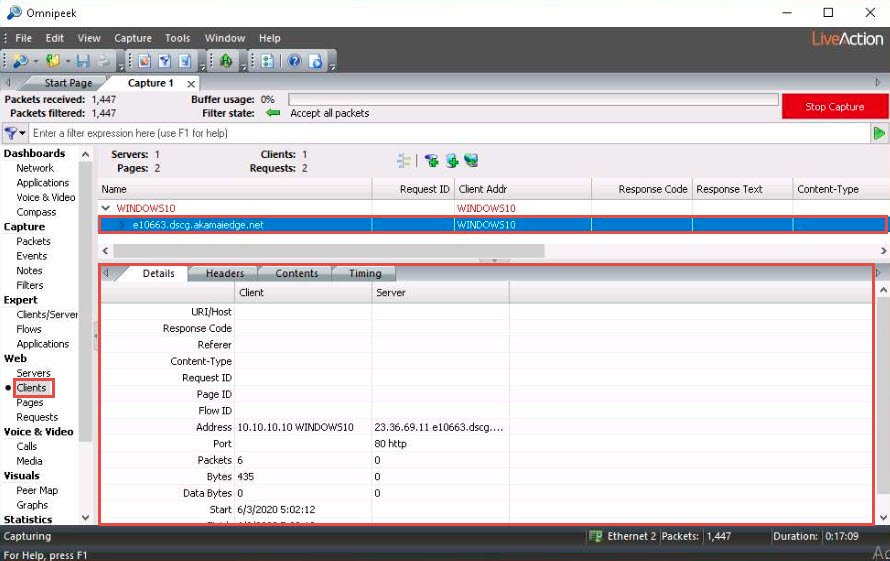
Click on Clients under the Web section in the left-hand pane to view the active systems in the network.
Expand client nodes (here,WINDOWS10) and click on any packet to view its detailed information under the Details tab in the lower section of the window.
Click Peer Map under the Visuals section in the left-hand pane to show a mapped view of the network traffic. By default, all Traffic Types (Unicast, Multicast, and Broadcast) are selected.
You can select any traffic according to your purpose.
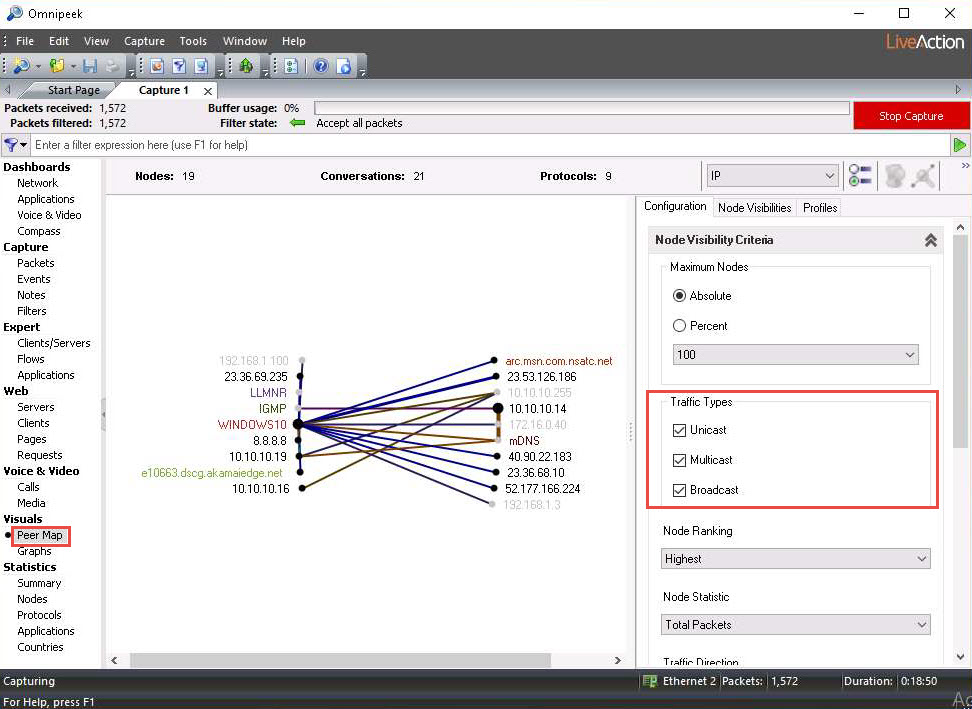
Similarly, under the Visuals section, you can click the Graphs option to show graphs on packet size, QoS analysis, TCP analysis, TCP vs. UDP, and web protocols.
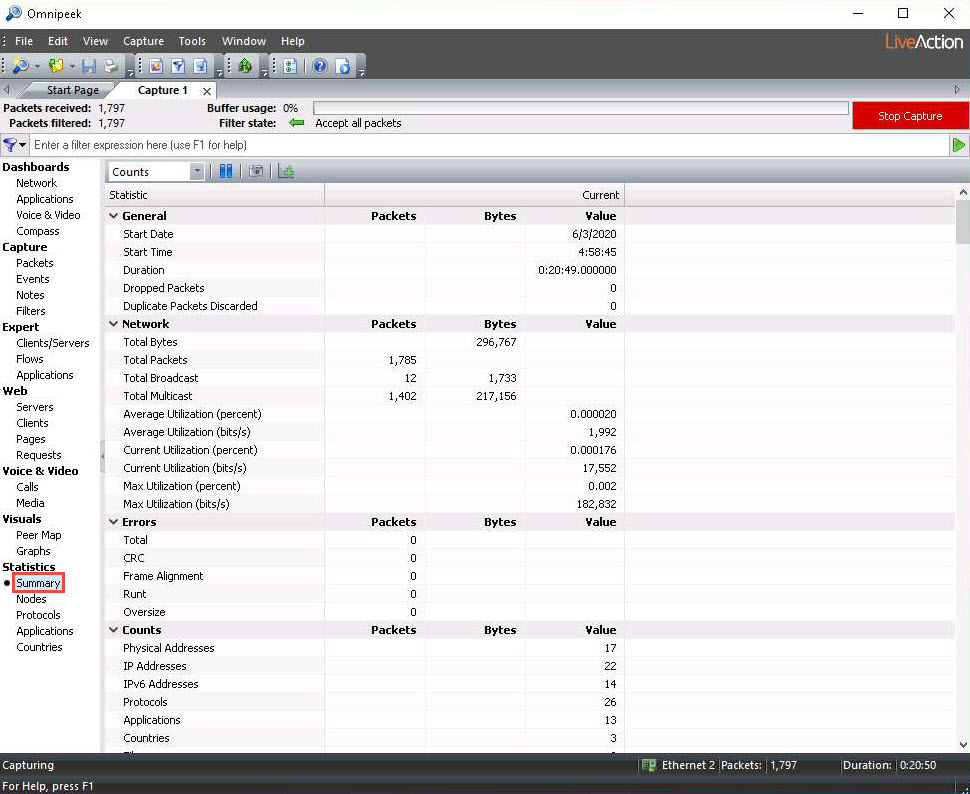
Click on the Summary option under the Statistics section in the left-hand pane to view a summary report of the network analysis.
Stop the packet capturing by clicking on the Stop Capture button in the right-hand corner of the window. The Stop Capture button will toggle back to the Start Capture button.
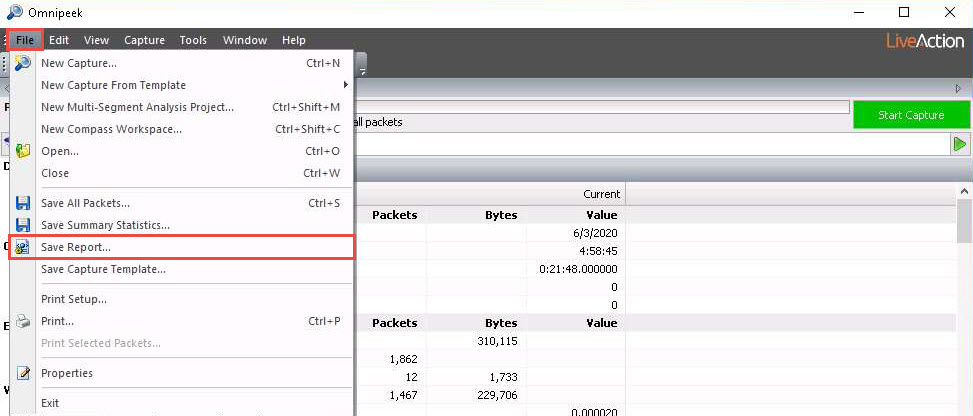
Click File from the menu bar and click Save Report… to save the report.
The Save Report window appears; under the Report folder field, click the ellipse icon to change the download location.
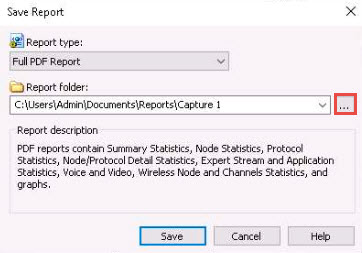
The Browse For Folder window appears; select the Desktop as your save location and click OK.
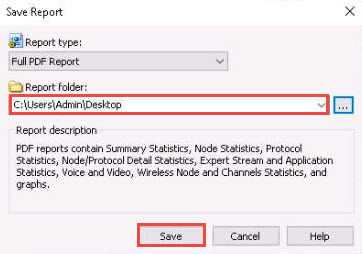
The changed save location appears in the Report folder field; click the Save button to save the report.
The saved report automatically appears, as shown in the screenshot.
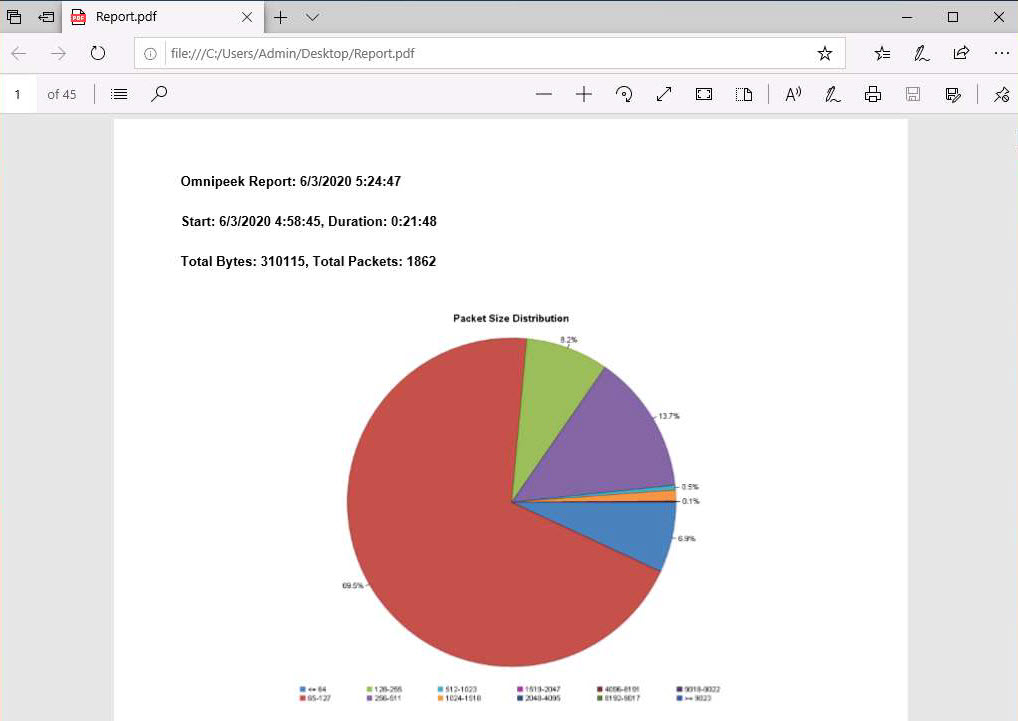
Scroll down the page in the pdf to view the complete report.
In real-time, an attacker may perform this analysis to obtain sensitive information as well as to find any loopholes in the network.
This concludes the demonstration of analyzing a network using the Omnipeek Network Protocol Analyzer.
Close all open windows and document all the acquired information.
Task 3: Analyze a Network using the SteelCentral Packet Analyzer
SteelCentral Packet Analyzer provides a graphical console for high-speed packet analysis. It captures terabytes of packet data traversing the network, reads it, and displays it in a GUI. It can analyze multi-gigabyte recordings from locally presented trace files or on remote SteelCentral NetShark probes (physical, virtual, or embedded on SteelHeads), without a large file transfer, to identify anomalous network issues or diagnose and troubleshoot complex network and application performance issues down to the bit level.
Here, we will use the SteelCentral Packet Analyzer tool to analyze a network.
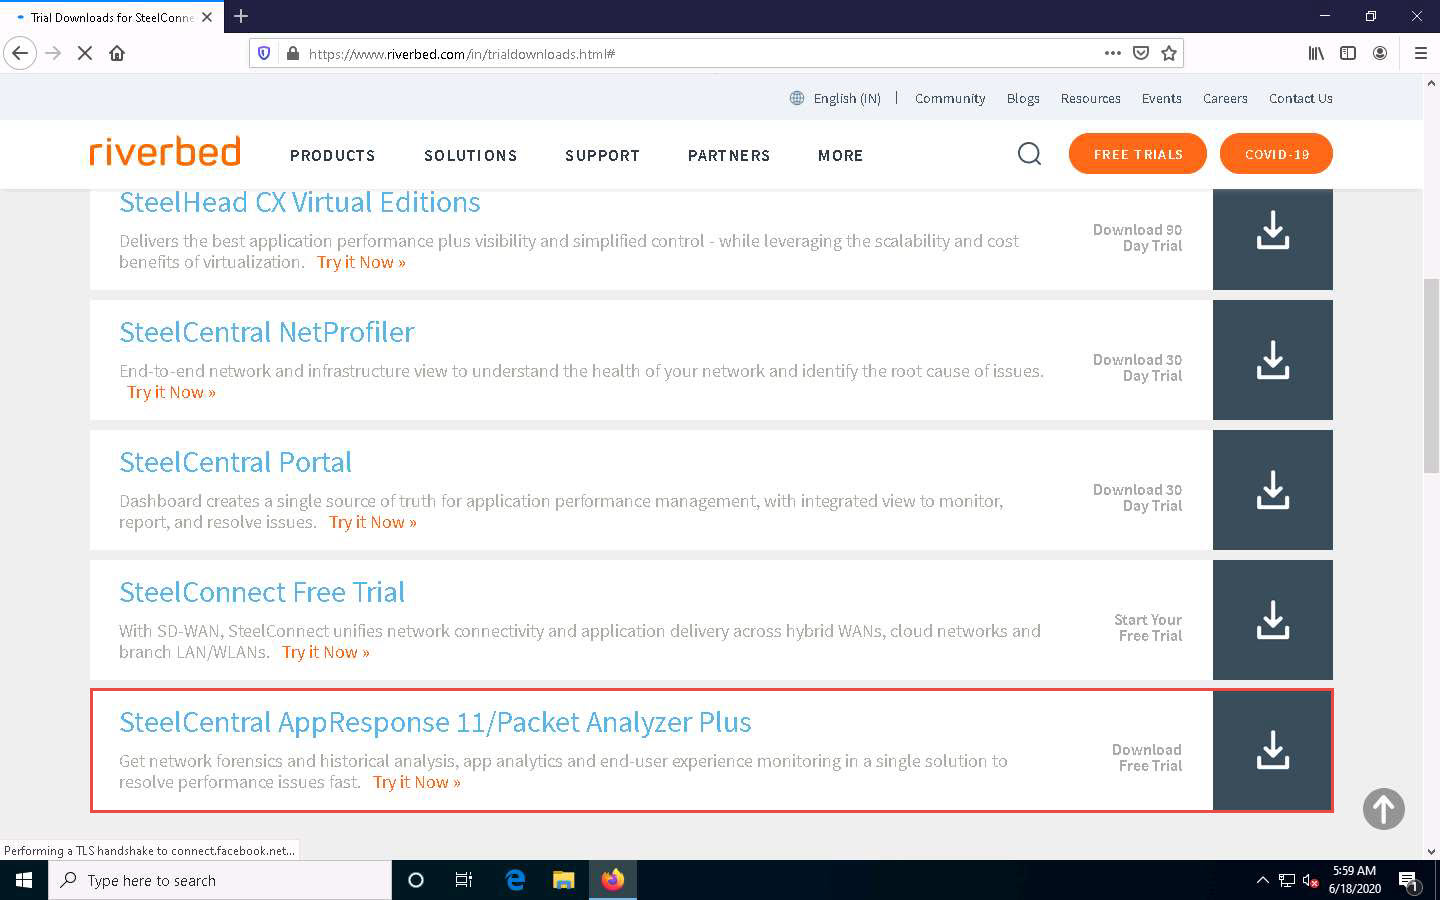
Click Windows 10 to switch to the Windows 10 machine, open any web browser (here, Mozilla Firefox) now type https://www.riverbed.com/in/trialdownloads.html in the address bar; press Enter.
The riverbed website appears, displaying TRIAL DOWNLOADS. Scroll down and click on SteelCentral AppResponse 11/Packet Analyzer Plus.
The tool version might differ in your lab environment.
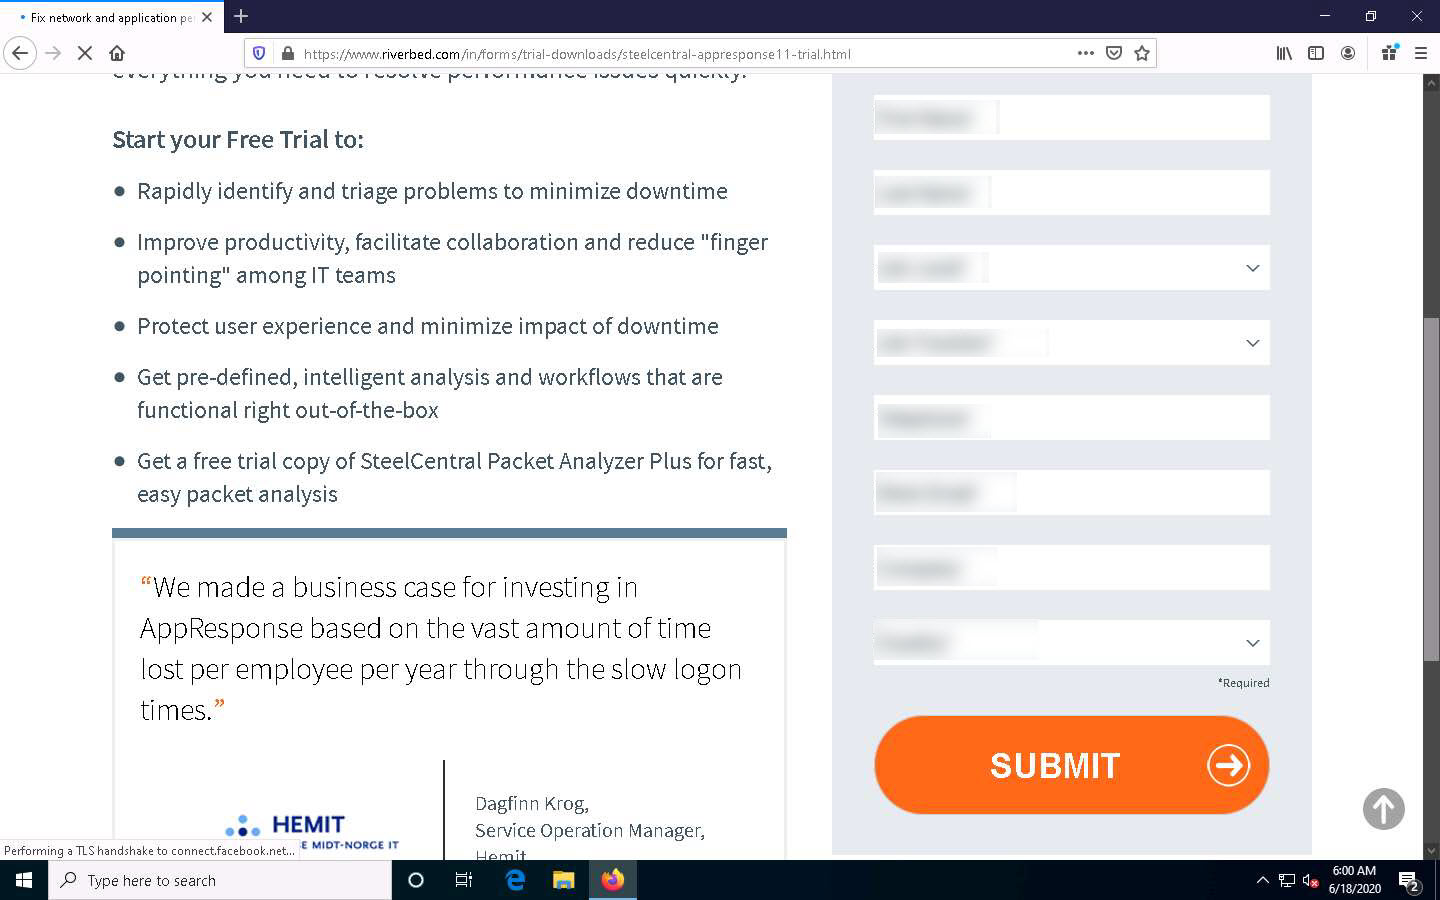
A website appears with a registration form. Fill in your required personal details to create an account and click the SUBMIT button.
Here, you must give your work email to create an account.
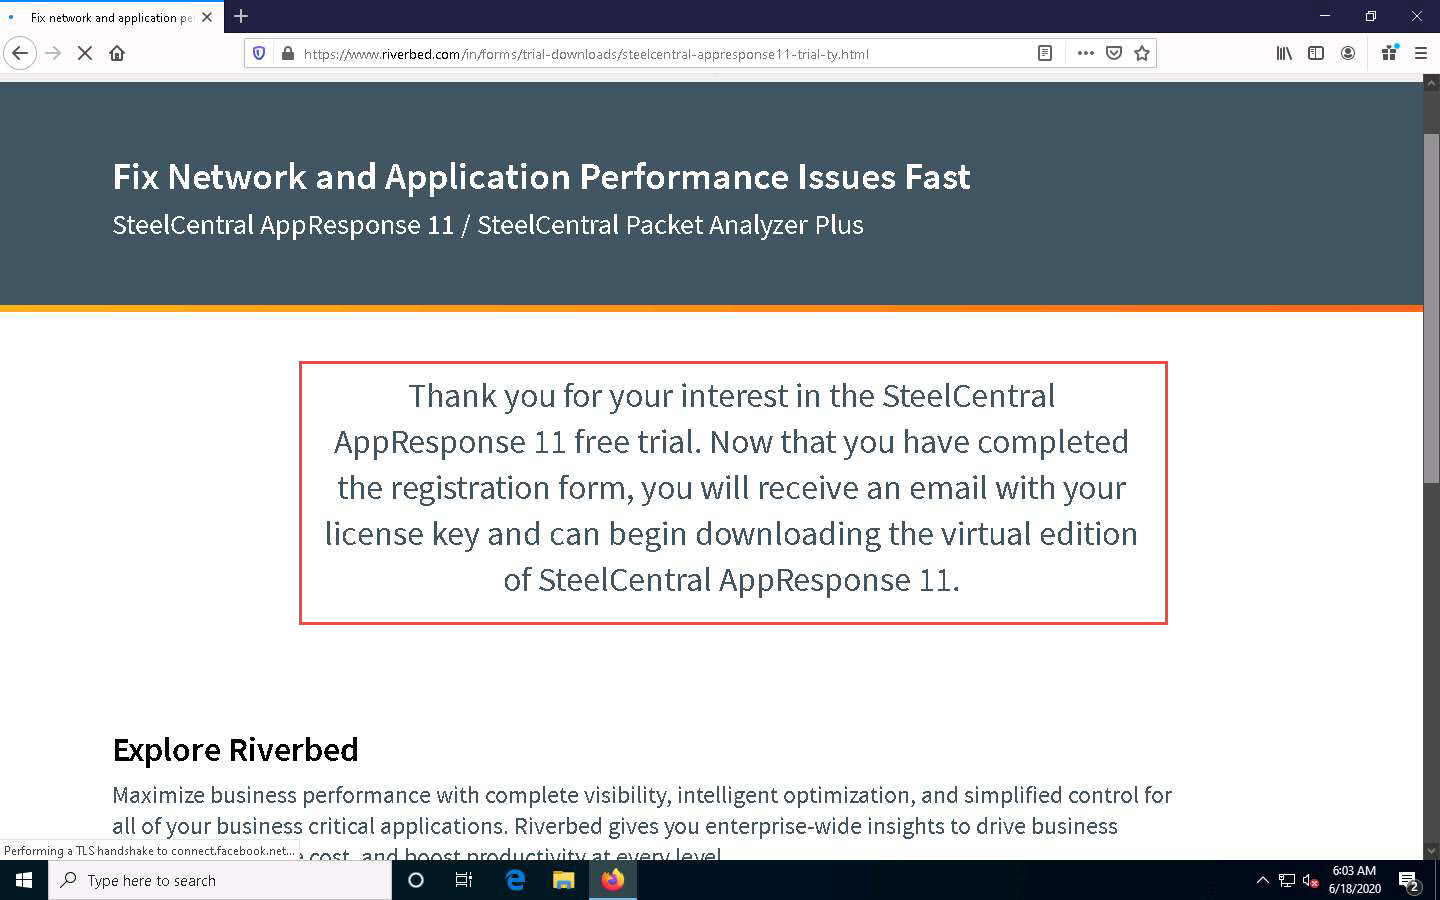
The Please verify your email address pop-up appears; click CONFIRM to submit the entered email address.
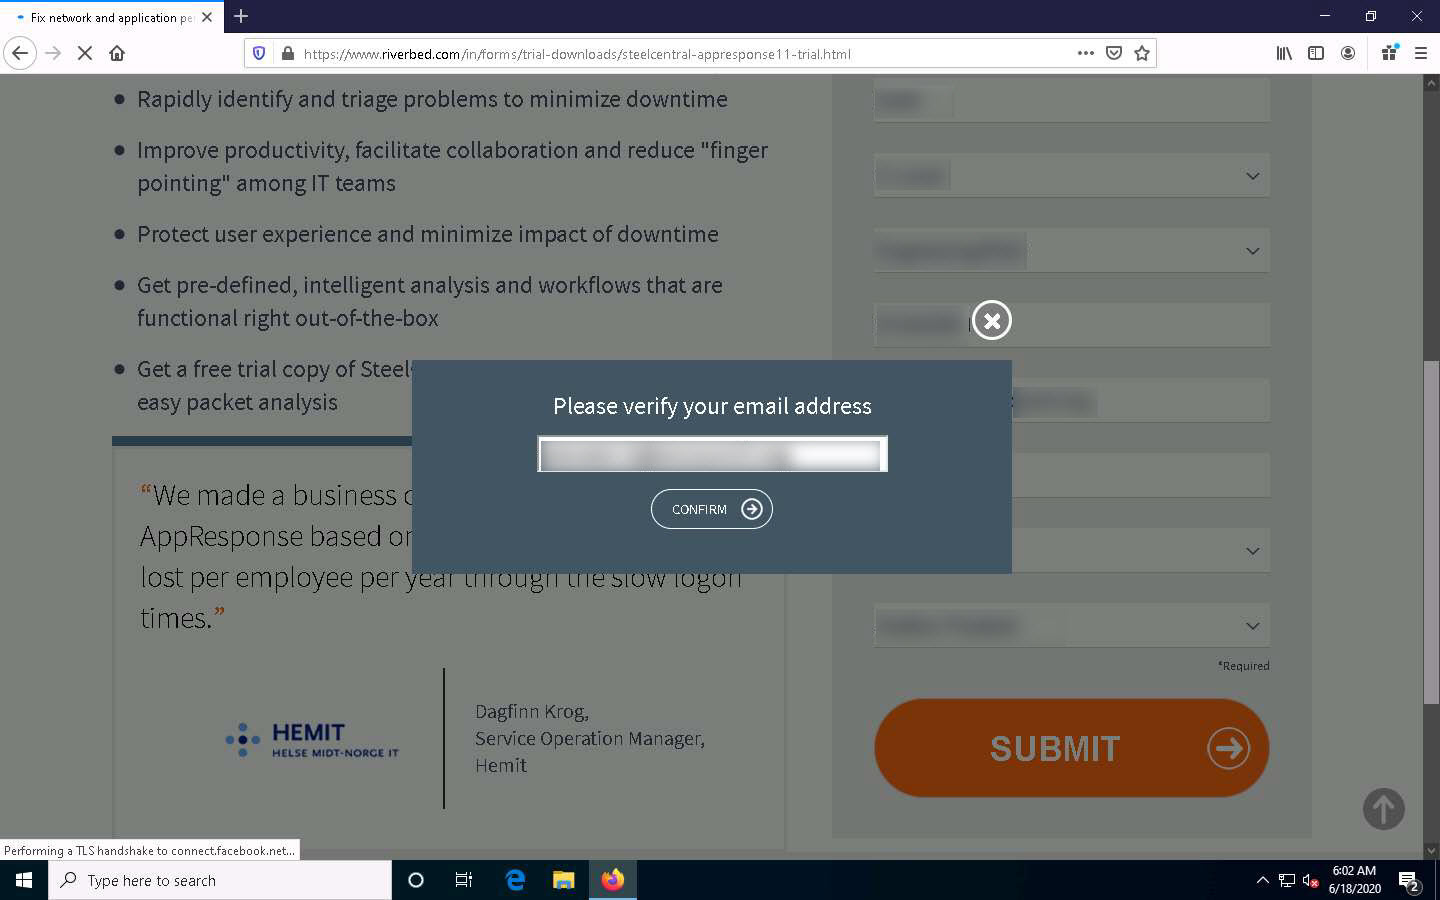
A Thank You webpage appears with information regarding the trial version.
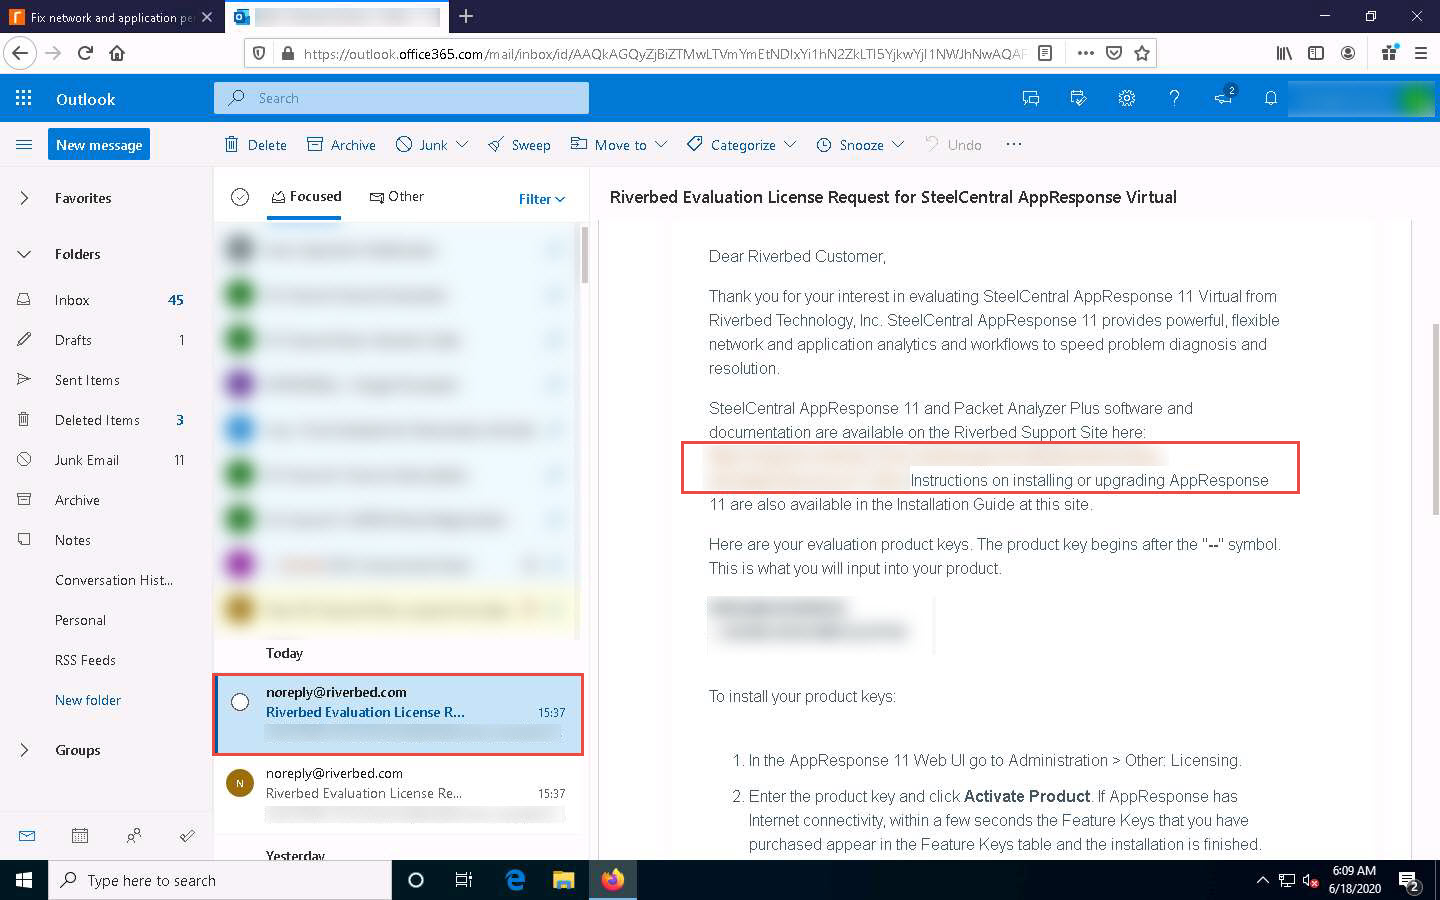
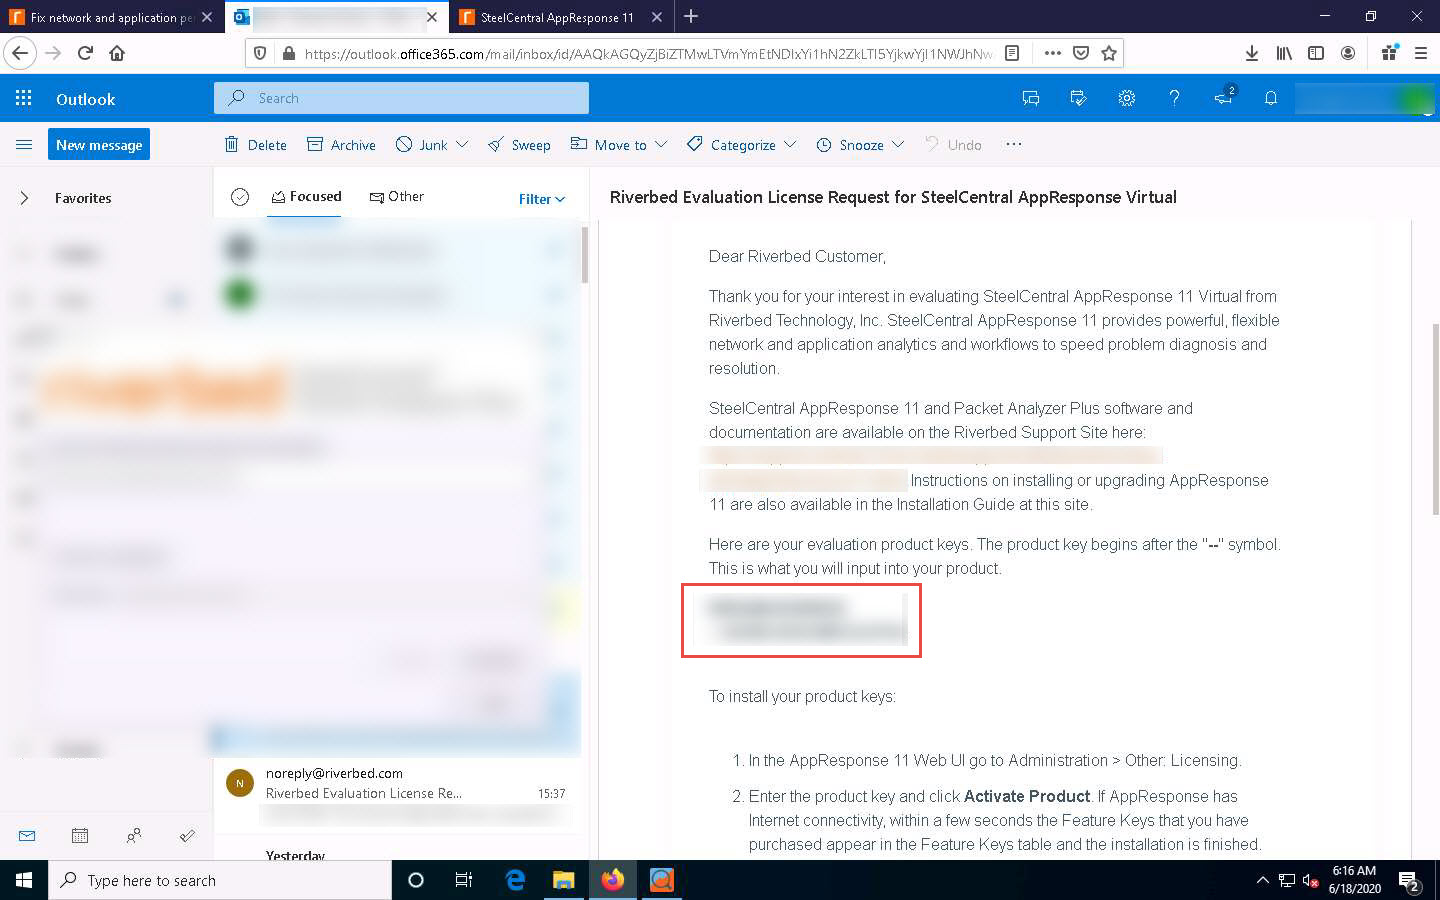
Open a new tab and log in to the email account you provided during registration. Open the email from Riverbed Evaluation License Request for SteelCentral AppResponse Virtual, and click the Software link to download SteelCentral Packet Analyzer.
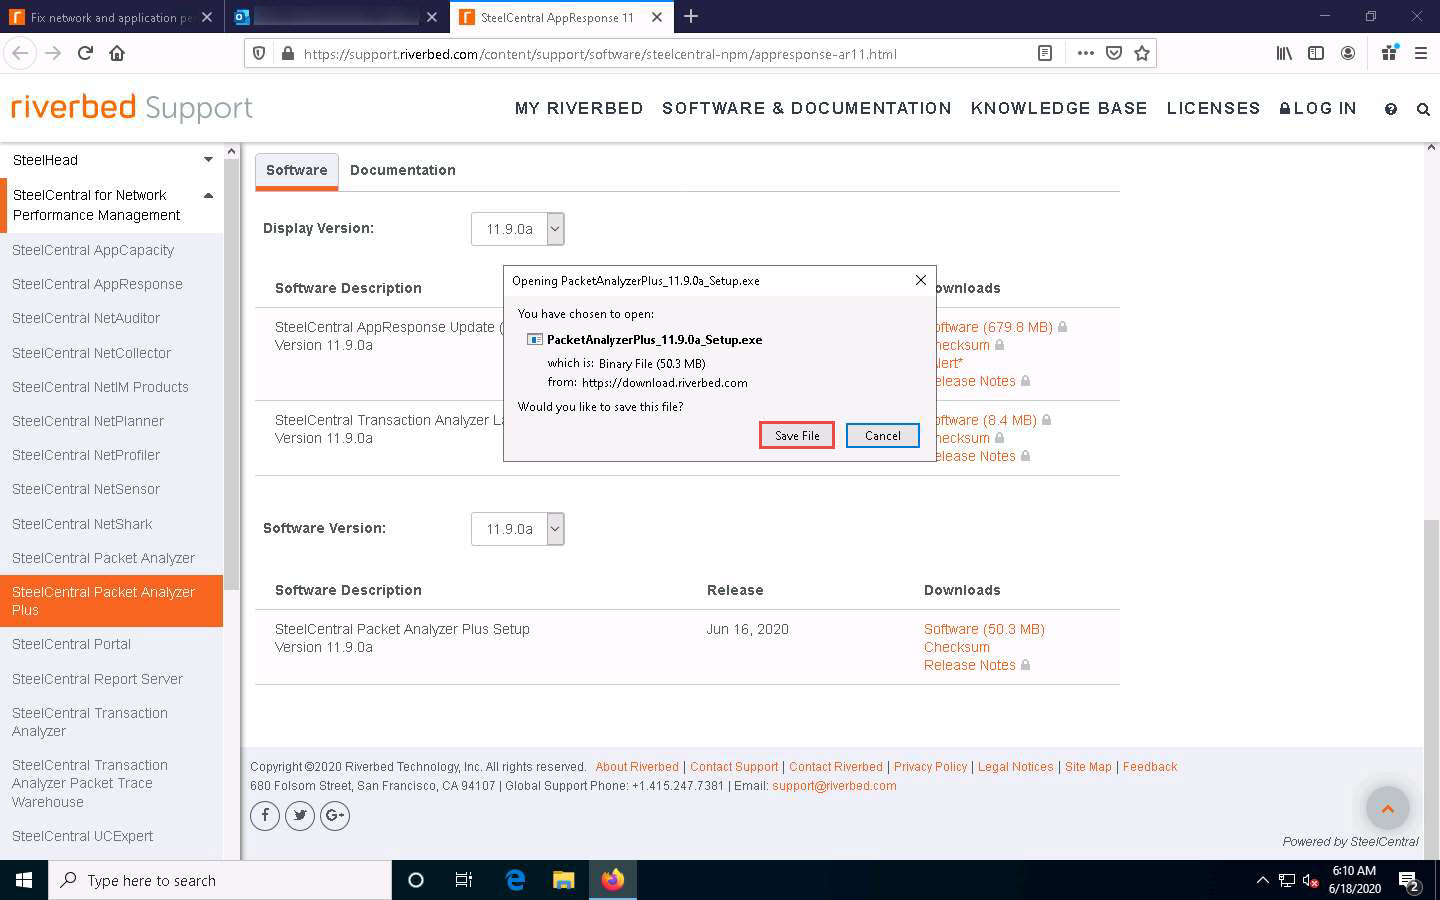
The Opening PacketAnalyzer_11.9.0a_Setup.exe pop-up appears; click Save File to download the SteelCentral Packet Analyzer setup file.
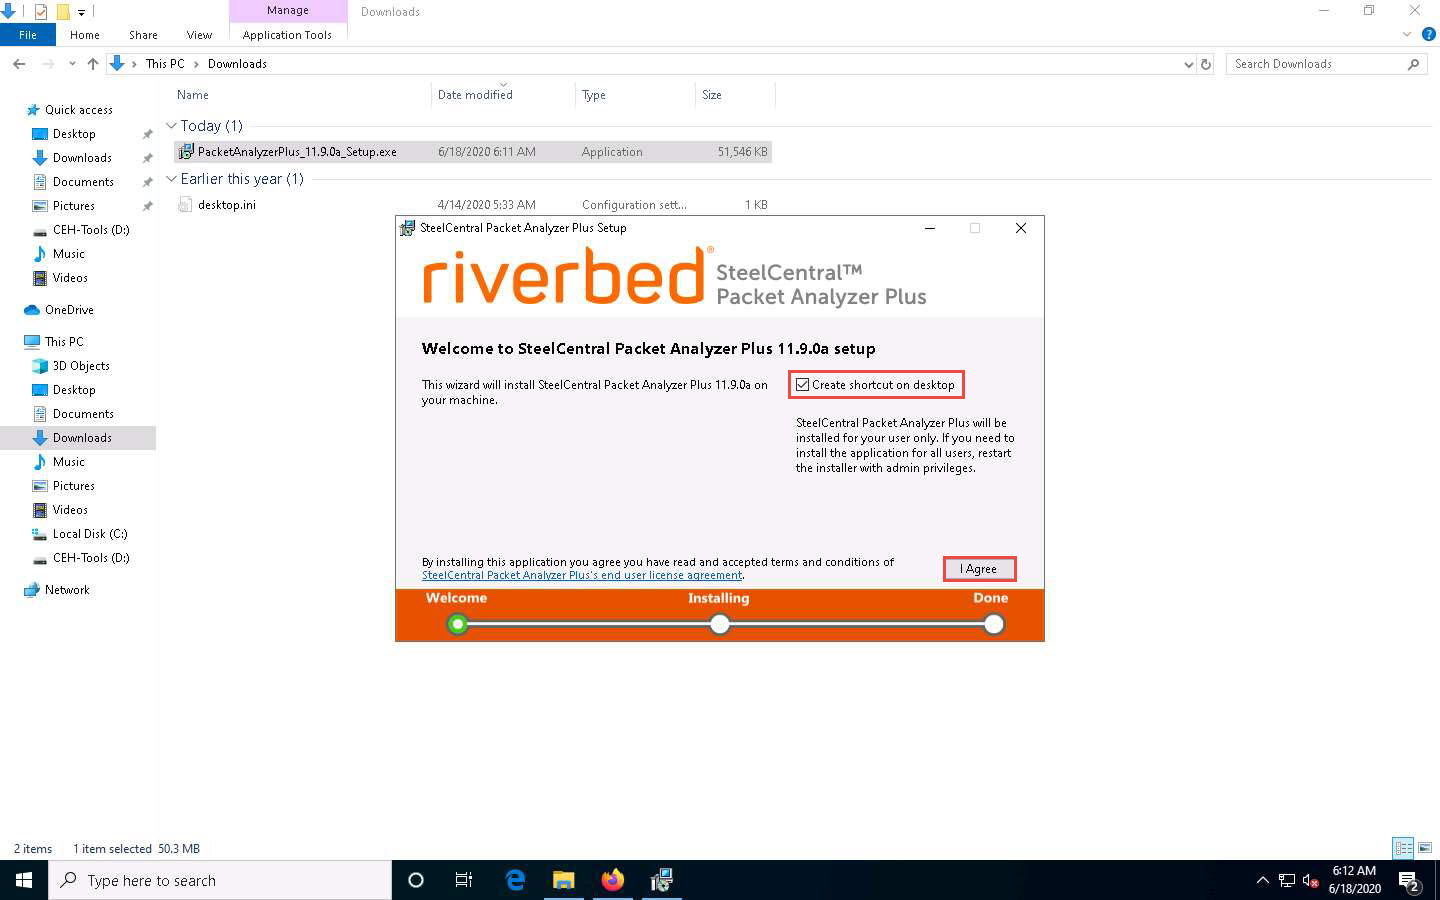
On completion of the download, minimize the browser. Navigate to the download location (here, Downloads) and double-click PacketAnalyzer_11.9.0a_Setup.exe.
The Open File - Security Warning window appears; click Run.
The SteelCentral Packet Analyzer Plus Setup window appears; click Create shortcut on desktop checkbox and click I Agree to proceed.
SteelCentral Packet Analyzer starts installing, and after the completion of the installation, the Completed the SteelCentral Packet Analyzer Plus Setup wizard appears. Ensure that the Start the application checkbox is selected and click Close.
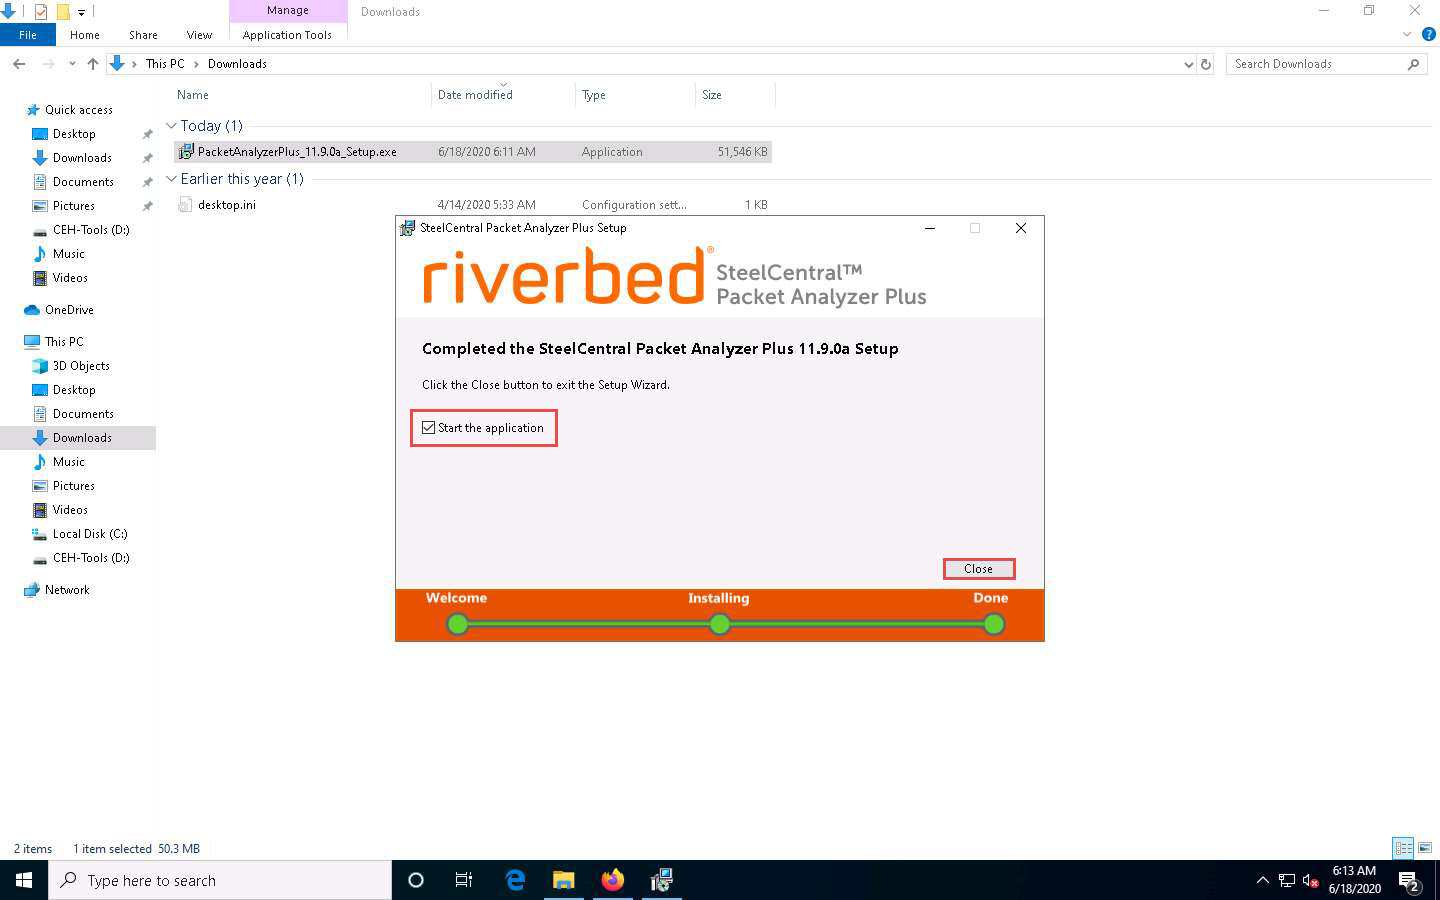
The License window appears. Leave this window running.
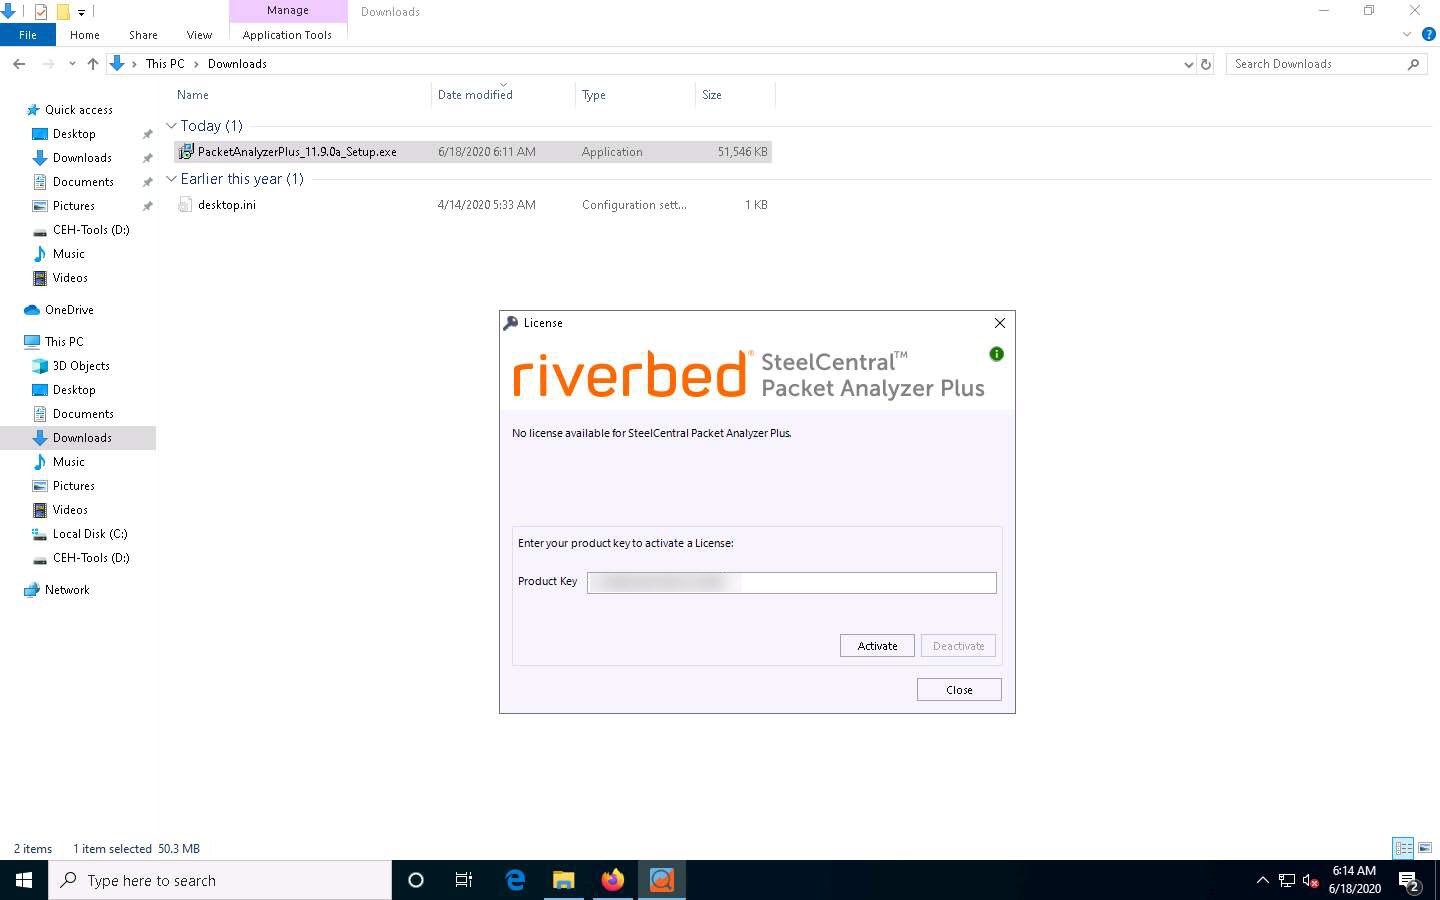
Switch to your browser (here, Mozilla Firefox). Navigate to the tab where the Riverbed Evaluation License Request for SteelCentral AppResponse Virtual email is open and copy the License Key provided in the email.
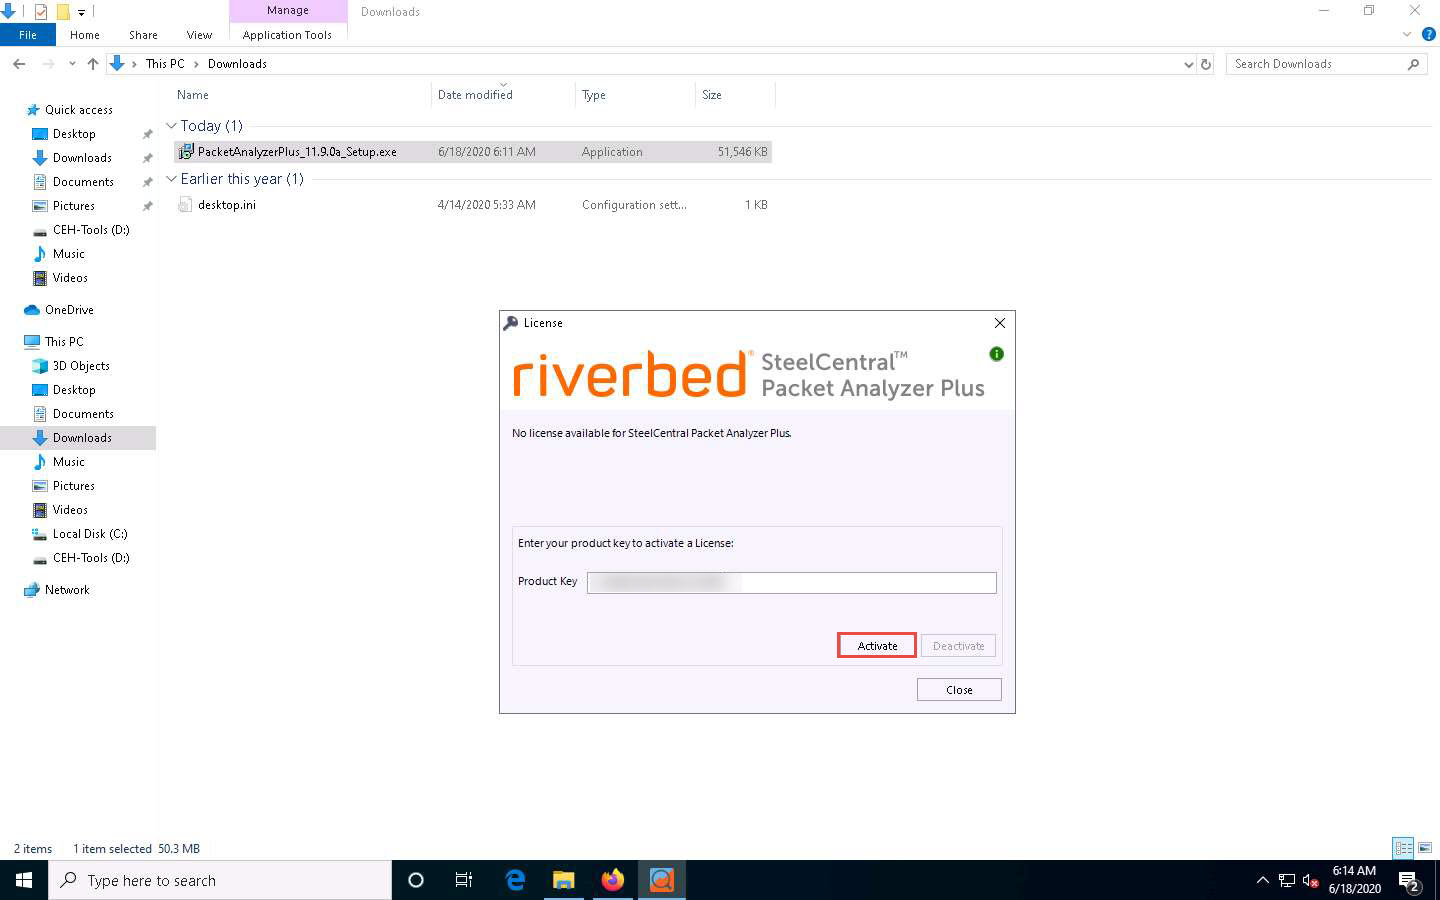
Switch back to License window and paste the License Key in the Product Key field. Click the Activate button.
If a User Account Control pop-up appears, click Yes.
The SteelCentral Packet Analyzer Plus license activated notification appears; click the Start button to start the application.

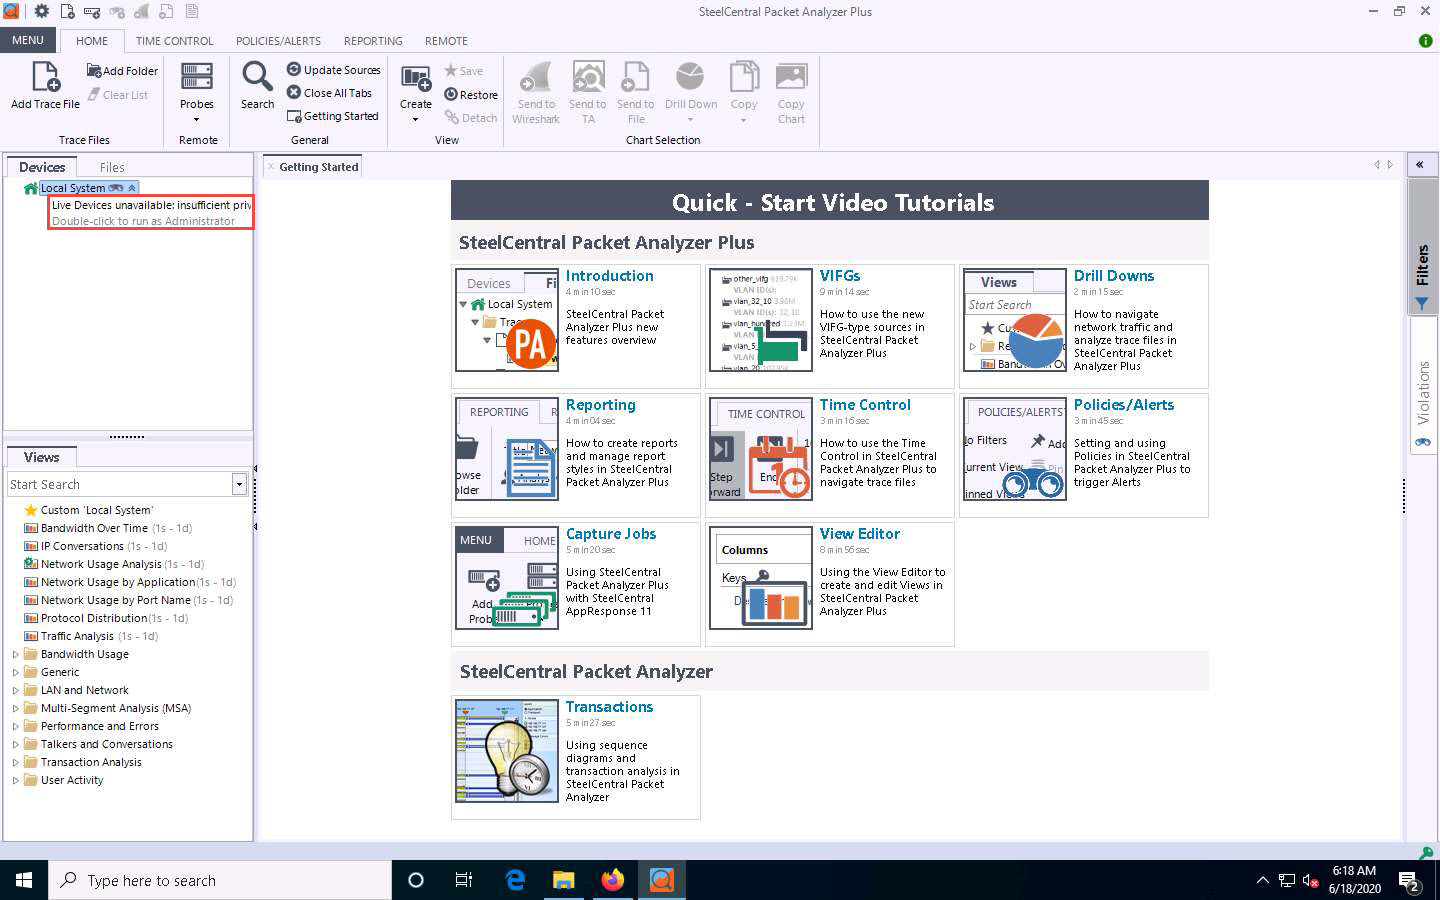
The SteelCentral Packet Analyzer Plus main window appears, displaying the Getting Started tab options, as shown in the screenshot.

Observe that under the Devices tab in the left-hand pane, the application is unable to detect any Local System as it requires admin privileges. Therefore, double-click Live Devices unavailable: Insufficient privileges to run the application as an Administrator.
A User Account Control pop-up appears; click Yes.
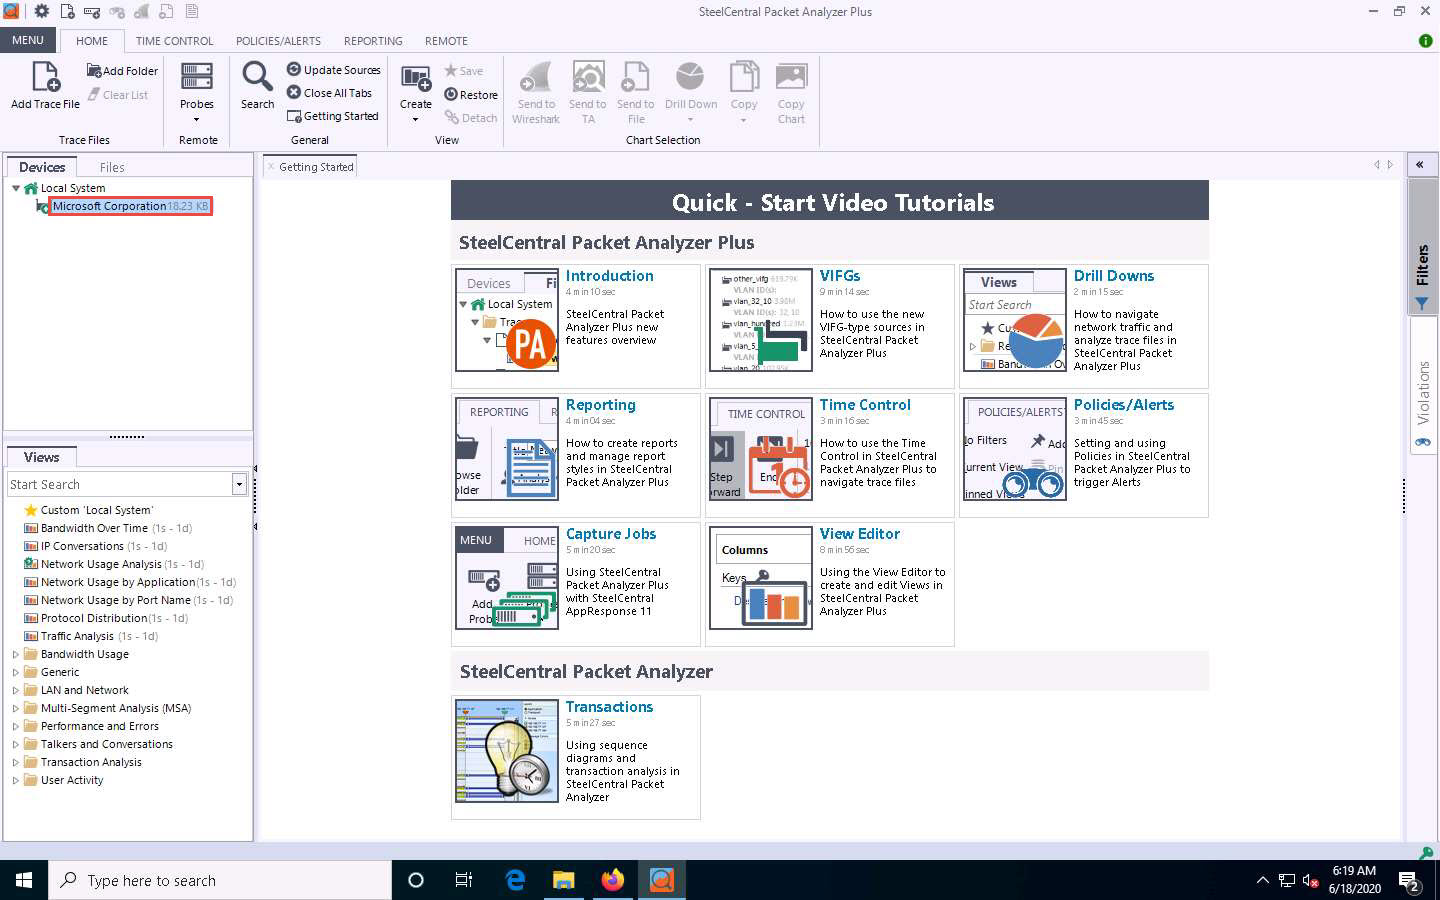
Ethernet adapter appear under Local System in the left-hand pane. Click the Microsoft Corporation adapter.
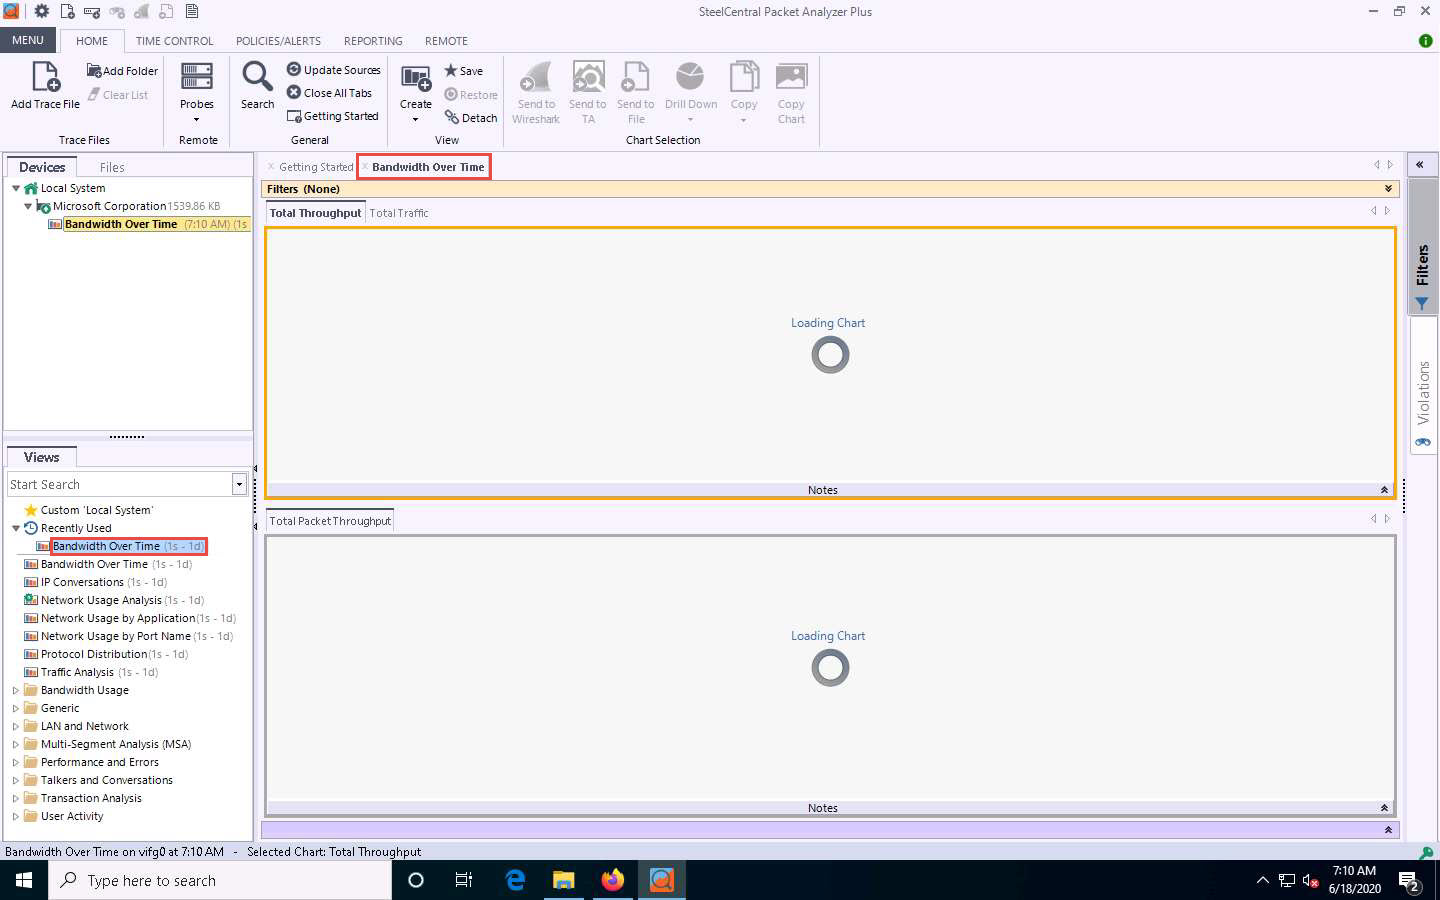
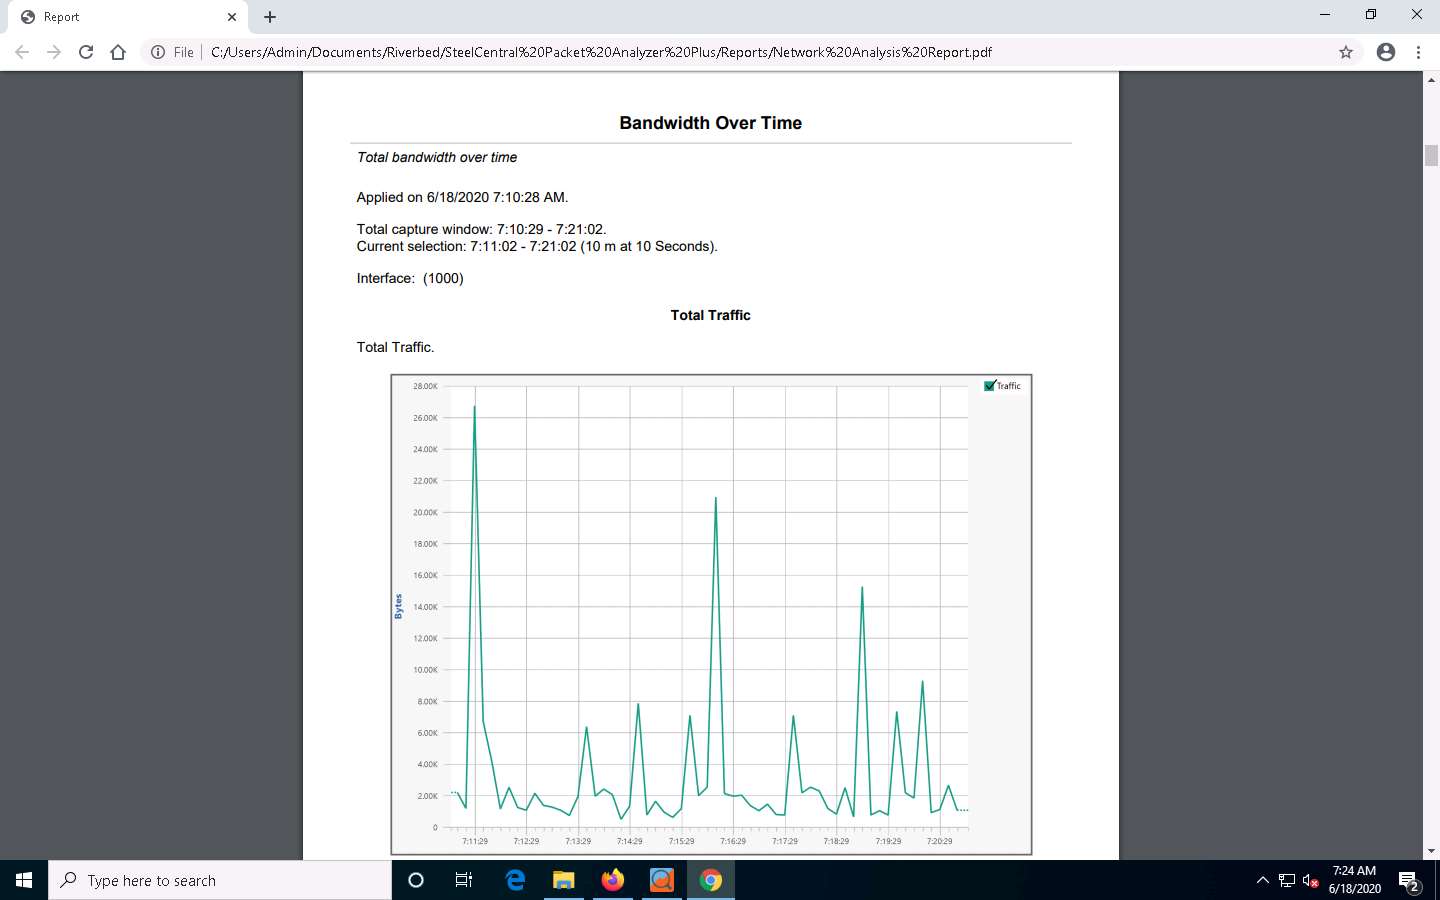
Double-click the Bandwidth Over Time option under the Recently Used node in the left-hand pane under the Views section.
A new Bandwidth Over Time tab appears, and SteelCentral Packet Analyzer Plus starts capturing the network traffic, as shown in the screenshot.
Now, click Windows Server 2019 to switch to the Windows Server 2019 machine.
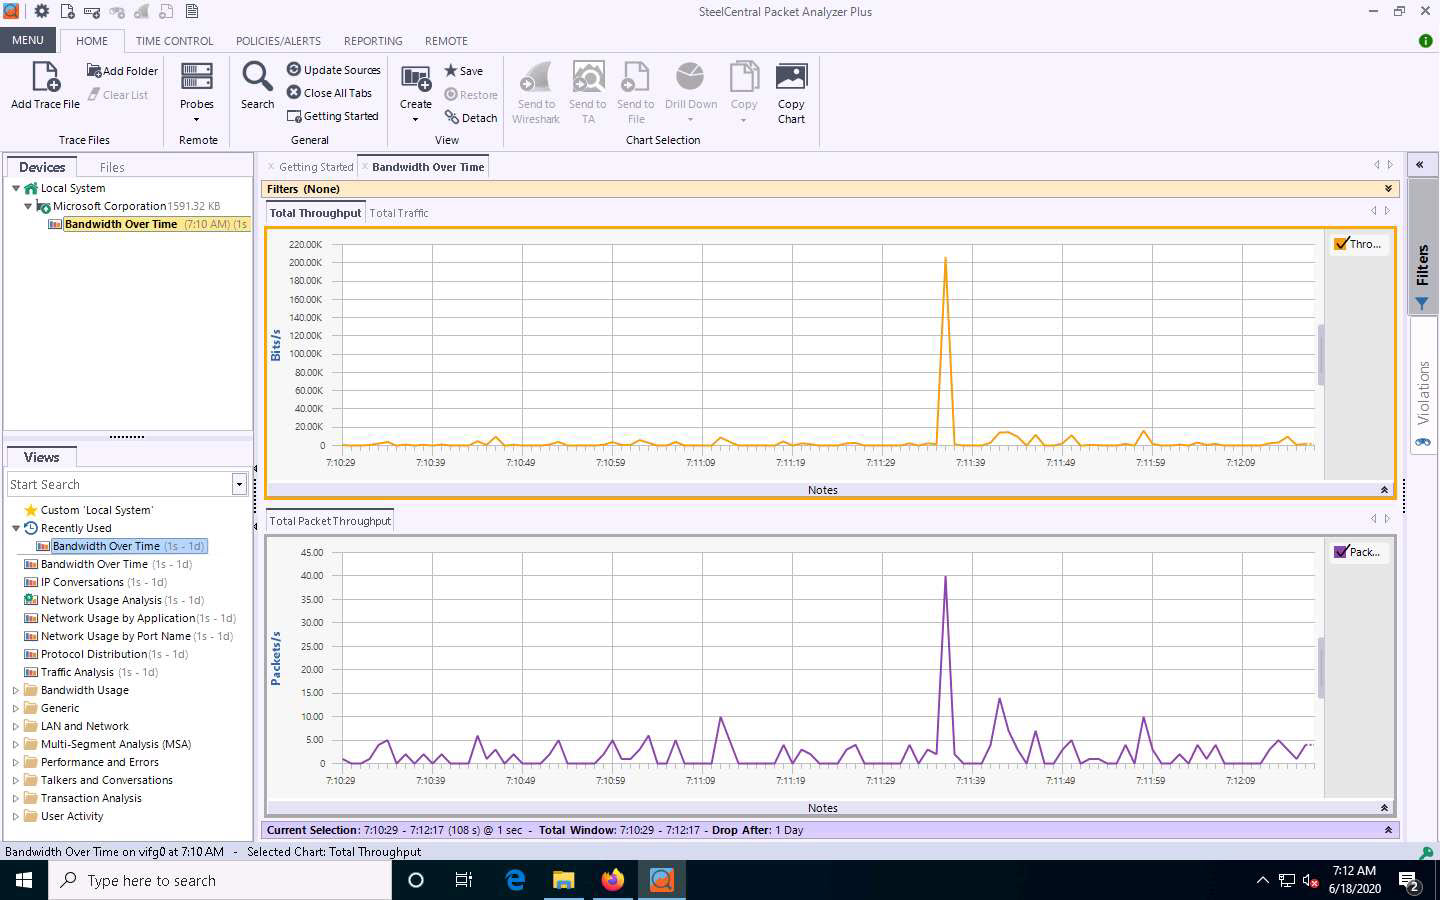
Acting as the target, open any web browser (here, Mozilla Firefox) and browse the website of your choice (here, www.twitter.com).

Click Windows 10 to switch back to the Windows 10 machine and observe the network traffic captured by SteelCentral Packet Analyzer, as shown in the screenshot.
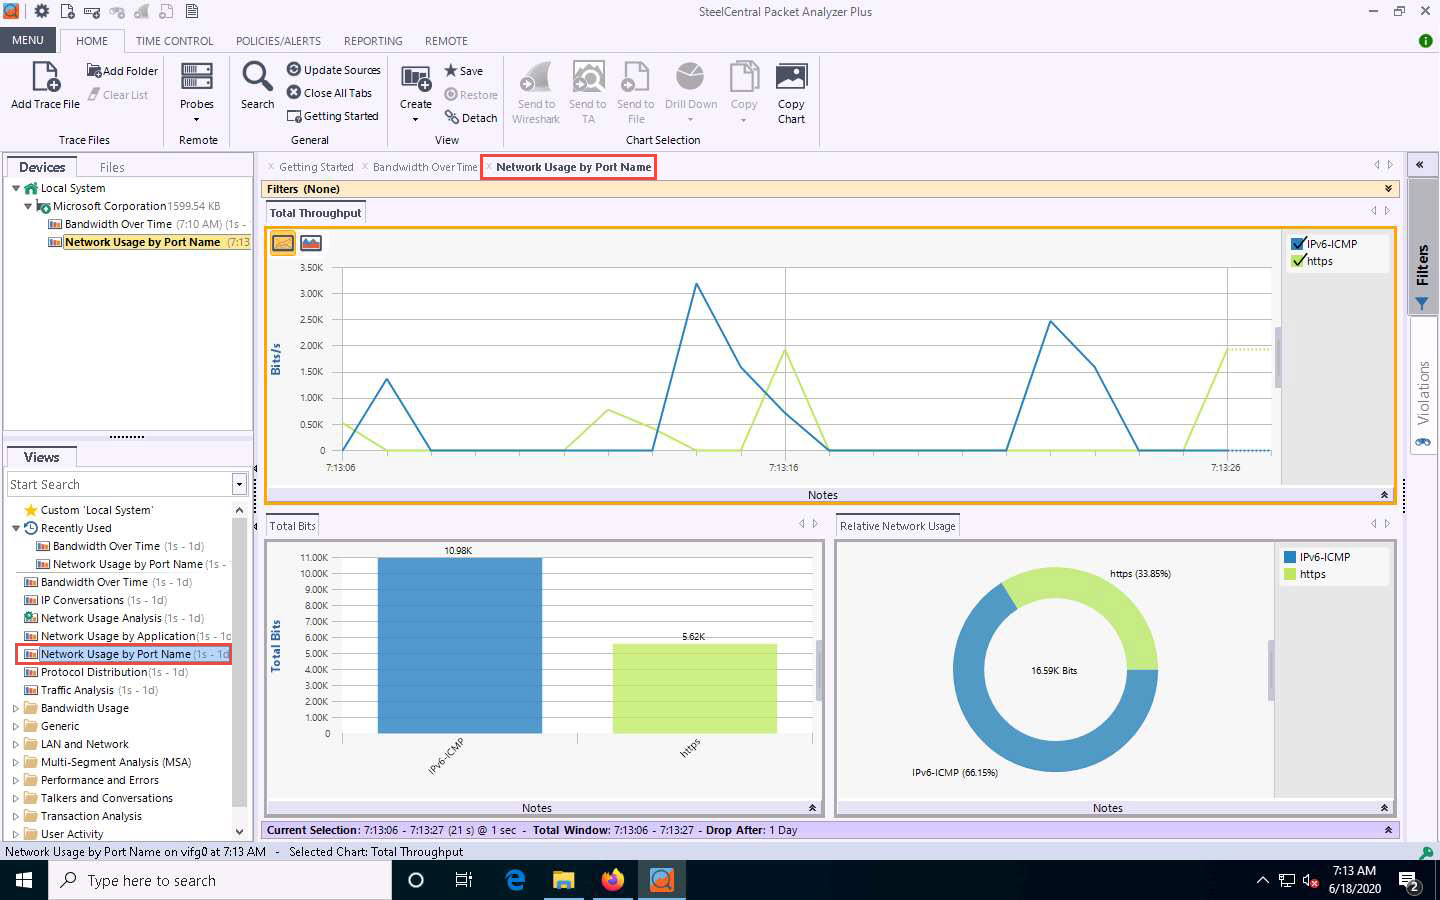
Double-click the Network Usage by Port Name option under the Recently Used node in the left-hand pane under the Views section.
A new Network Usage by Port Name tab appears, and SteelCentral Packet Analyzer Plus displays the captured network traffic.
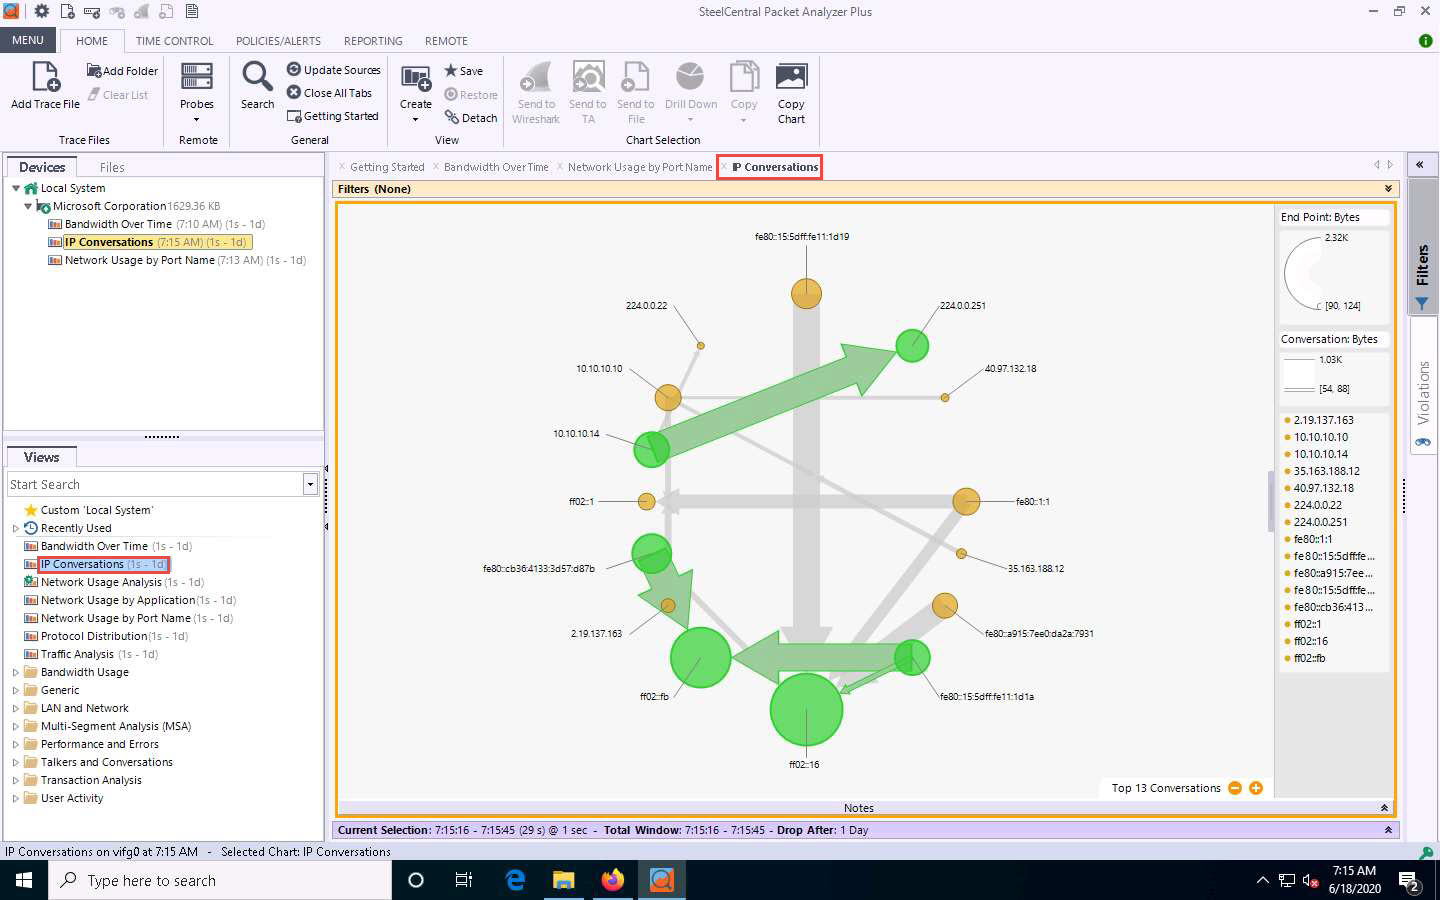
Double-click the IP Conversations option under the Recently Used node in the left-hand pane under the Views section.
A new IP Conversations tab appears, displaying conversations between different IP addresses in a map view.
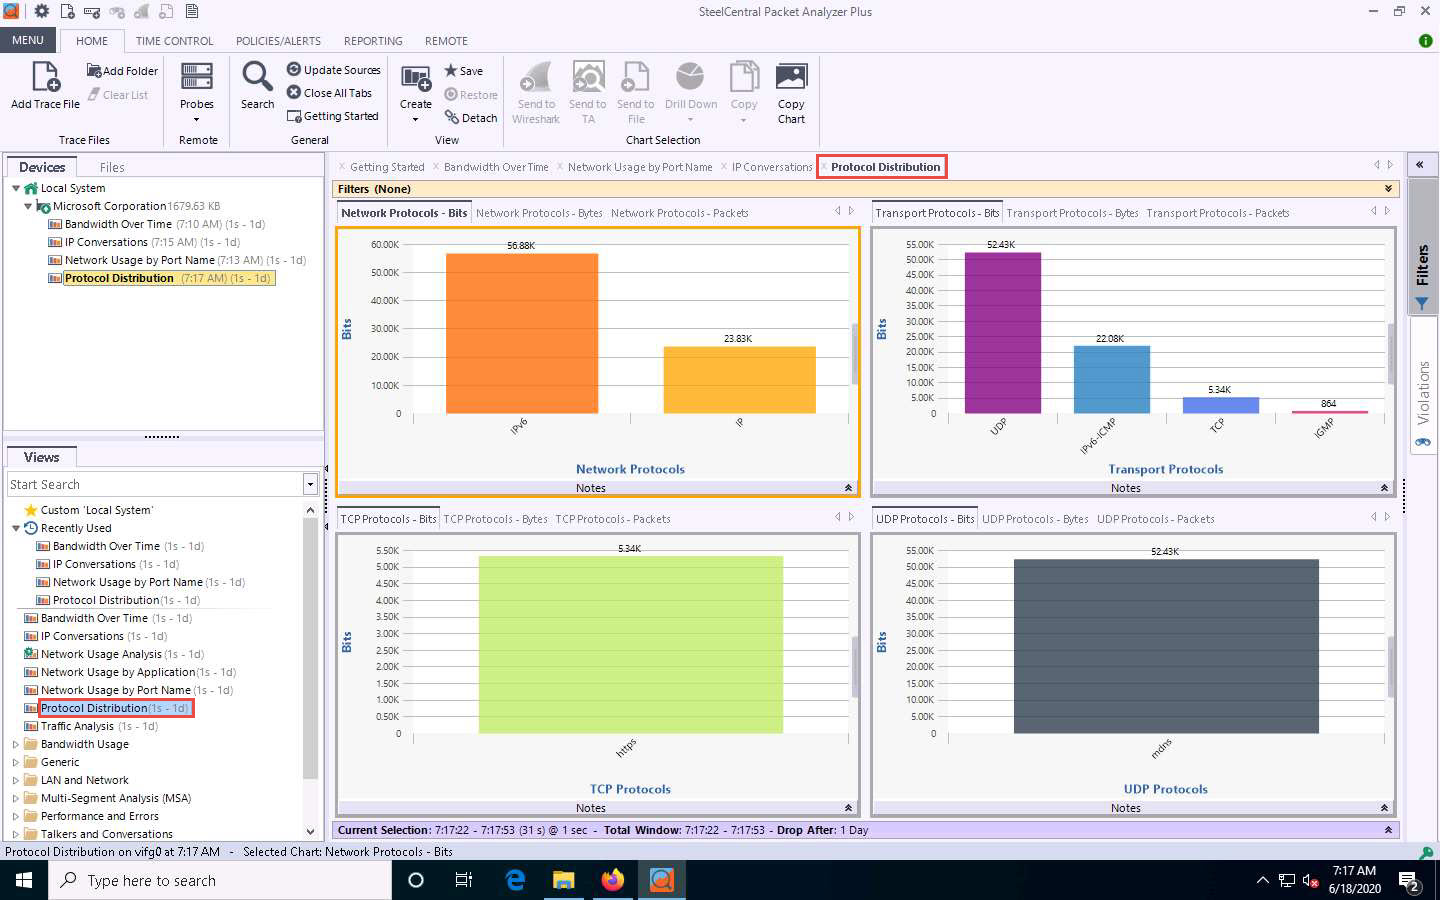
Double-click the Protocol Distribution option under the Recently Used node in the left-hand pane under the Views section.
A new Protocol Distribution tab appears, displaying Network Protocols, Transport Protocols, TCP Protocols, UDP Protocols, and other information, as shown in the screenshot.
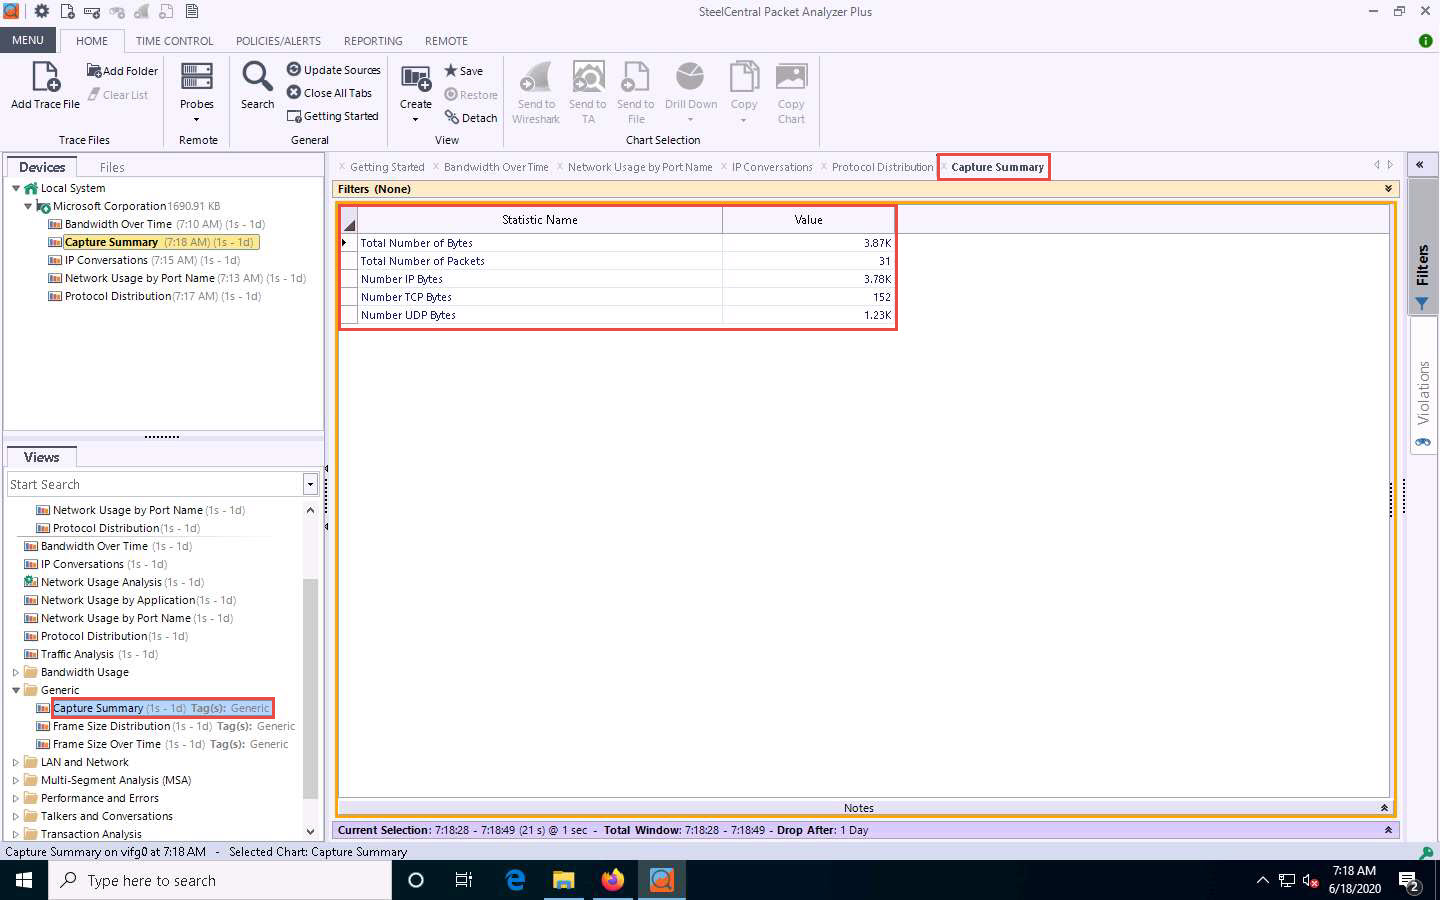
Now, expand the Generic node and double-click the Capture Summary option in the left-hand pane.
A new Capture Summary tab appears, displaying information about the captured network traffic packets.
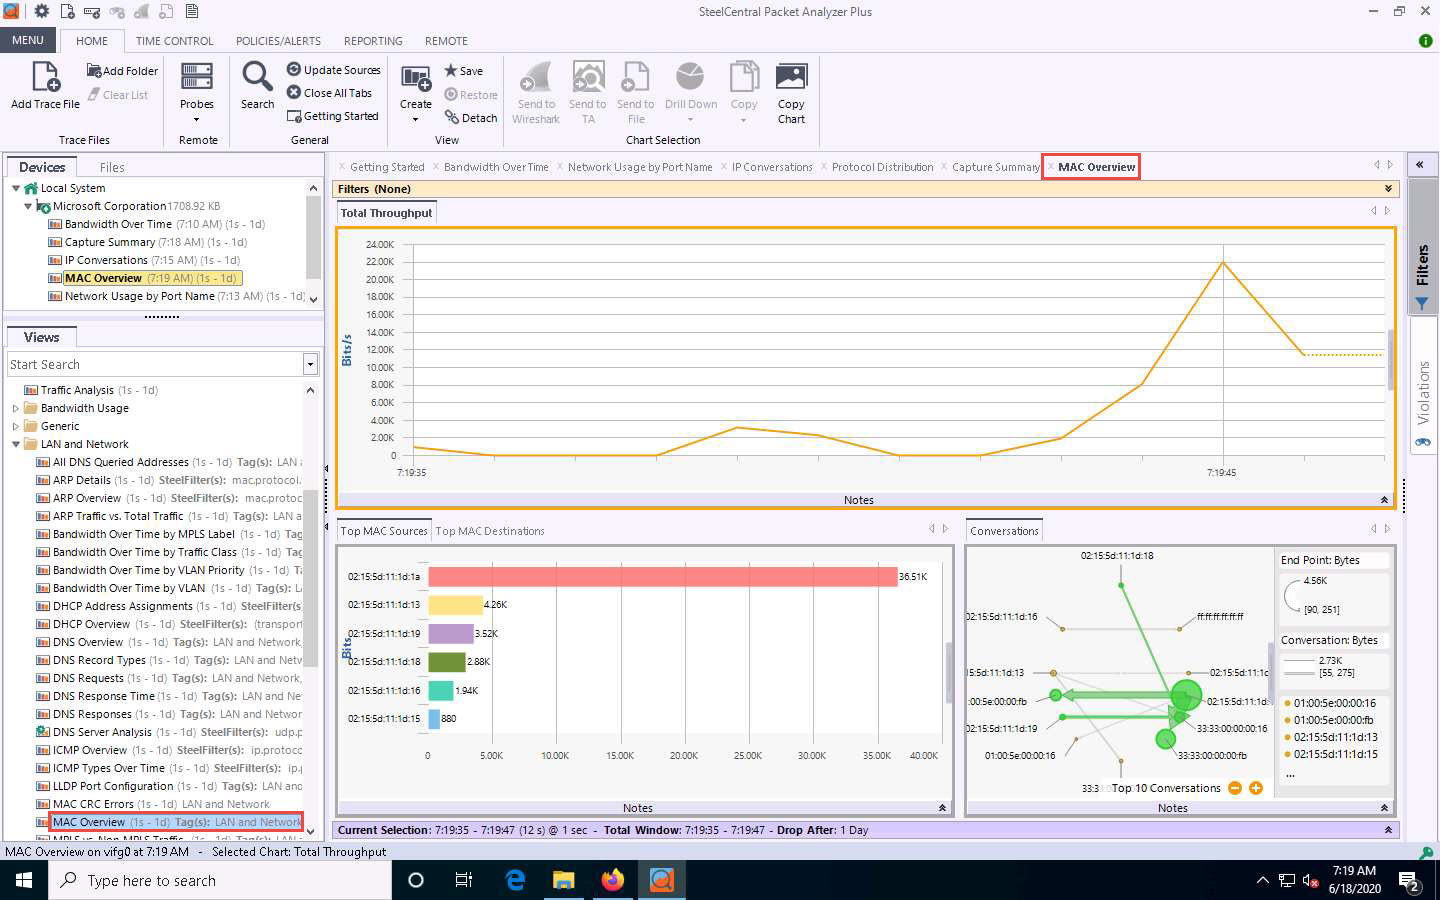
Expand the LAN and Network node and double-click the MAC Overview option in the left-hand pane.
A new MAC Overview tab appears, displaying information about MAC sources and destinations and MAC conversations.
Similarly, you can explore various options in other nodes such as VLAN, MPLS, ARP, ICMP, and DHCP.
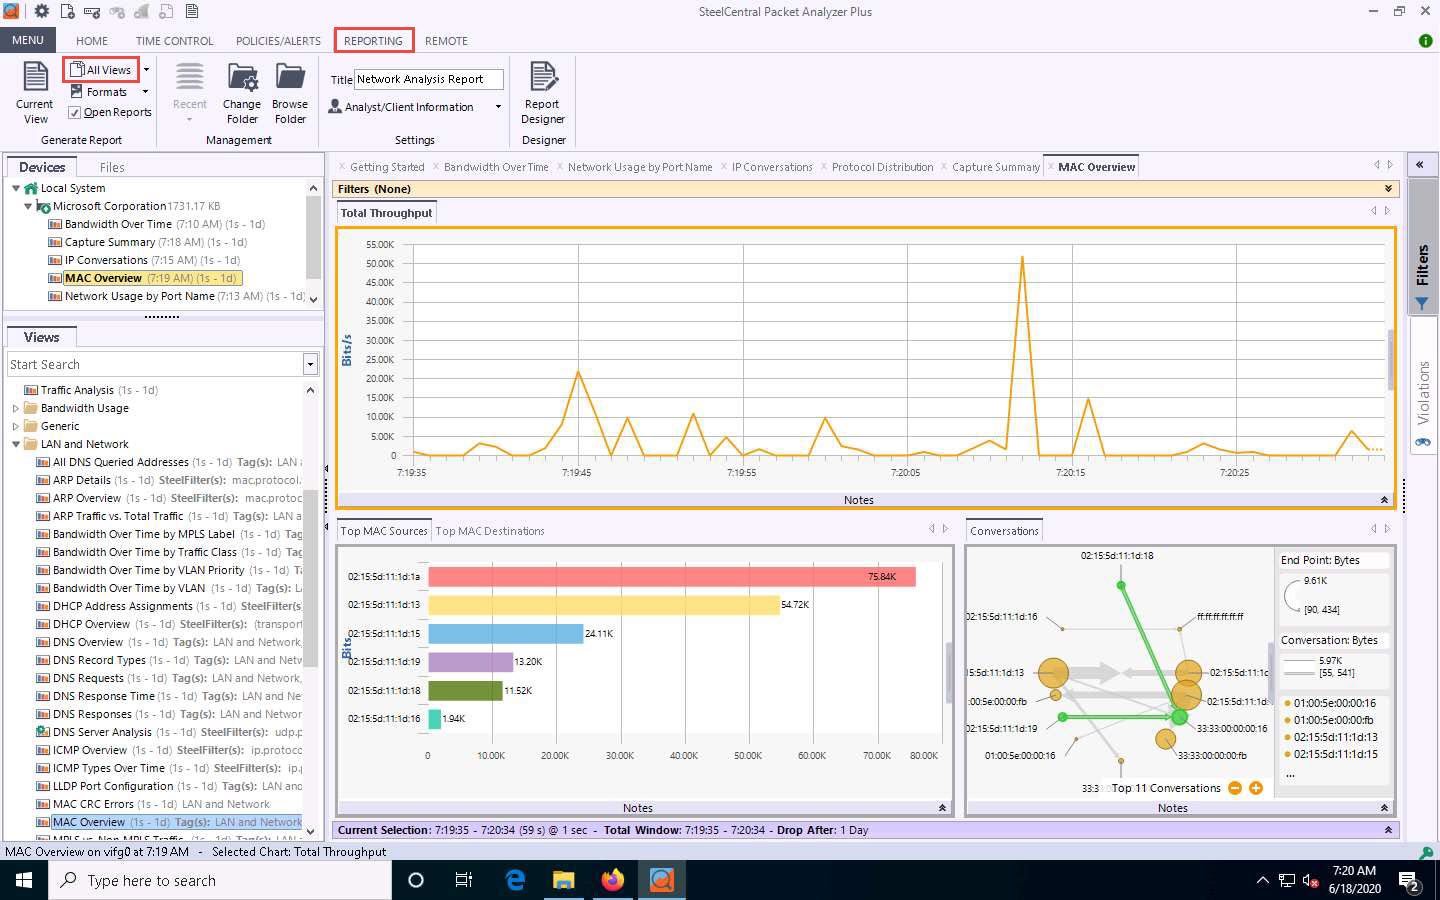
Click Reporting from the menu bar. Click on the All Views option to generate a report that includes all views.
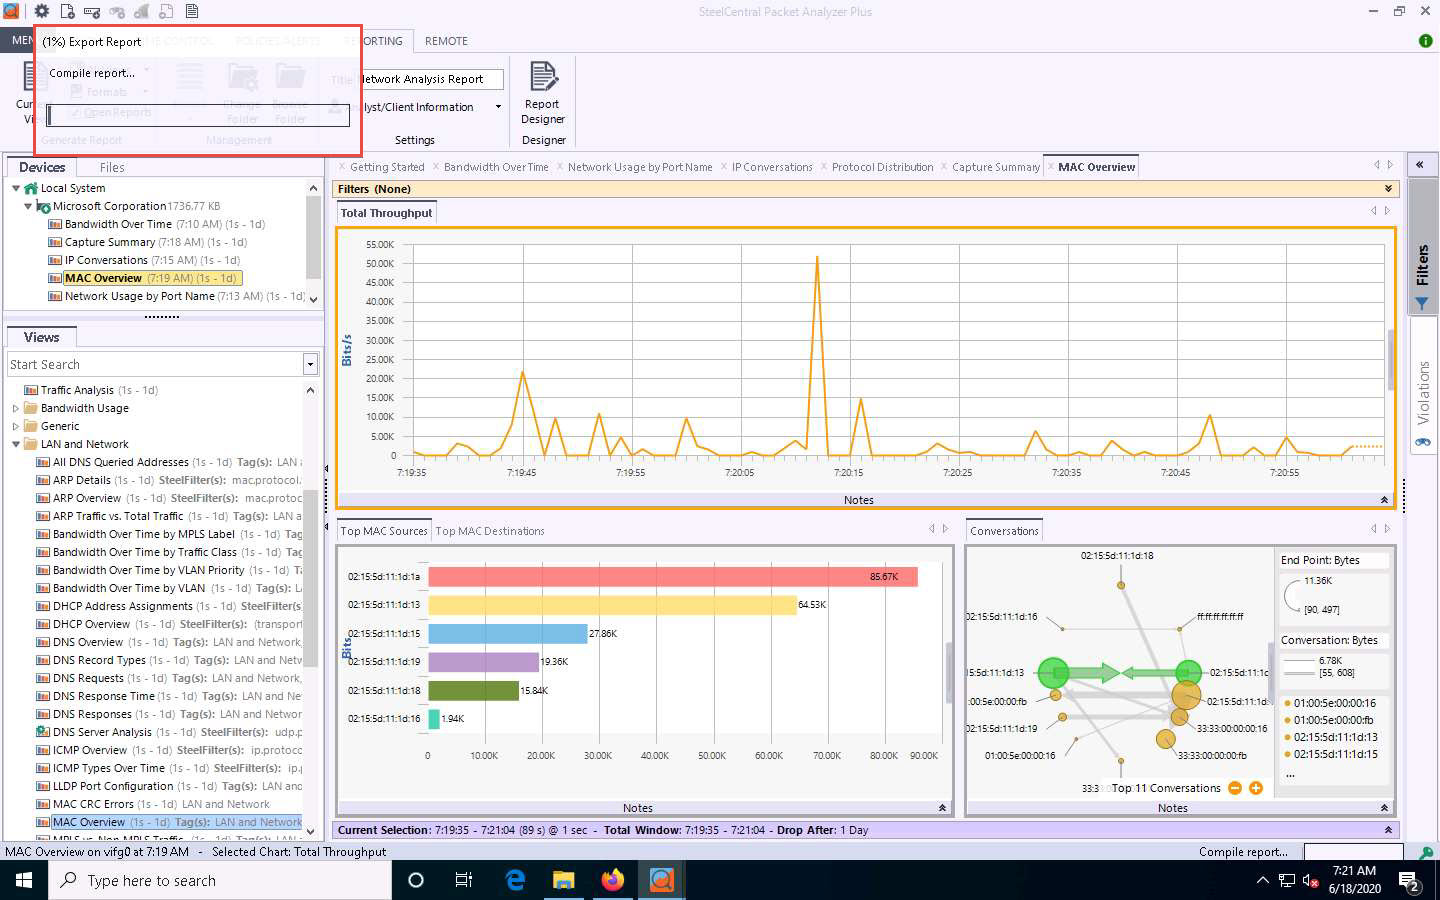
An Export Report pop-up appears, and the report starts exporting.
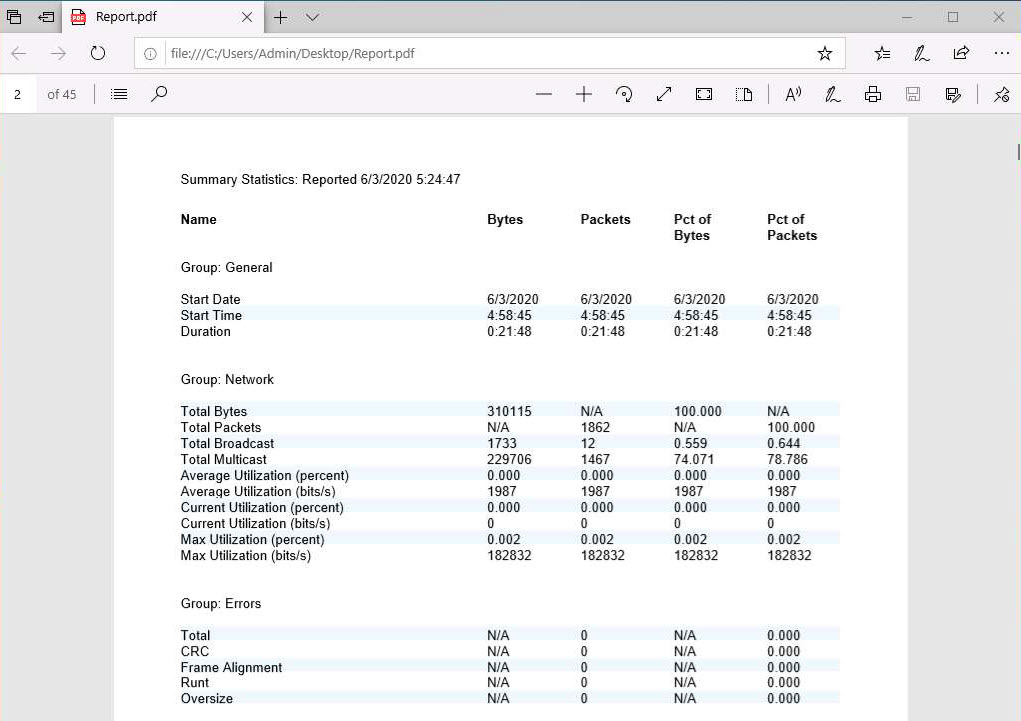
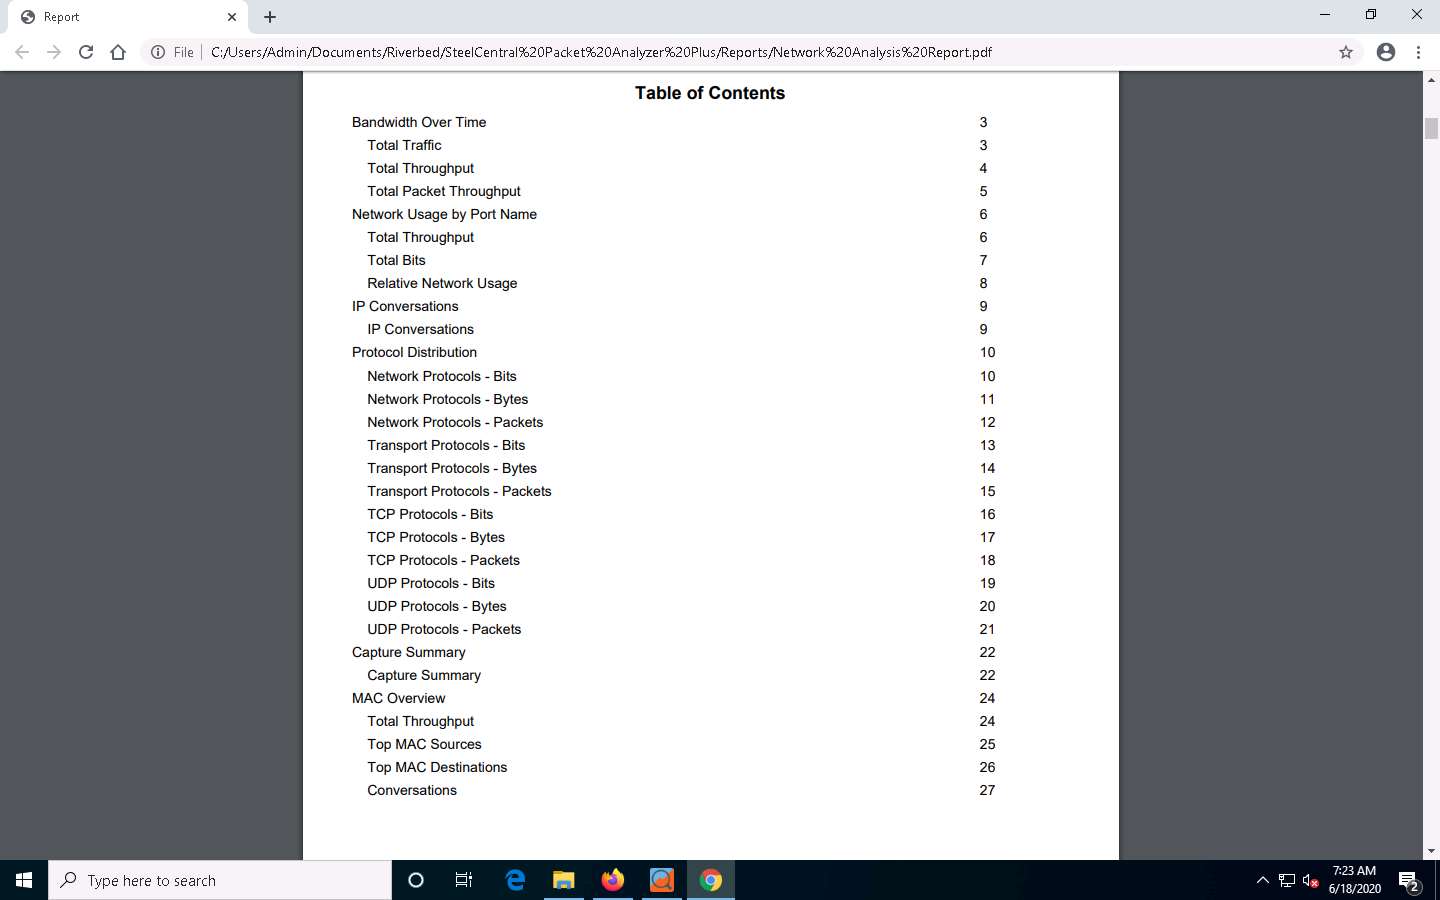
After completing the extraction, the generated report appears, as shown in the screenshot.
If a How do you want to open this file pop up appears, click on Google Chrome and press OK
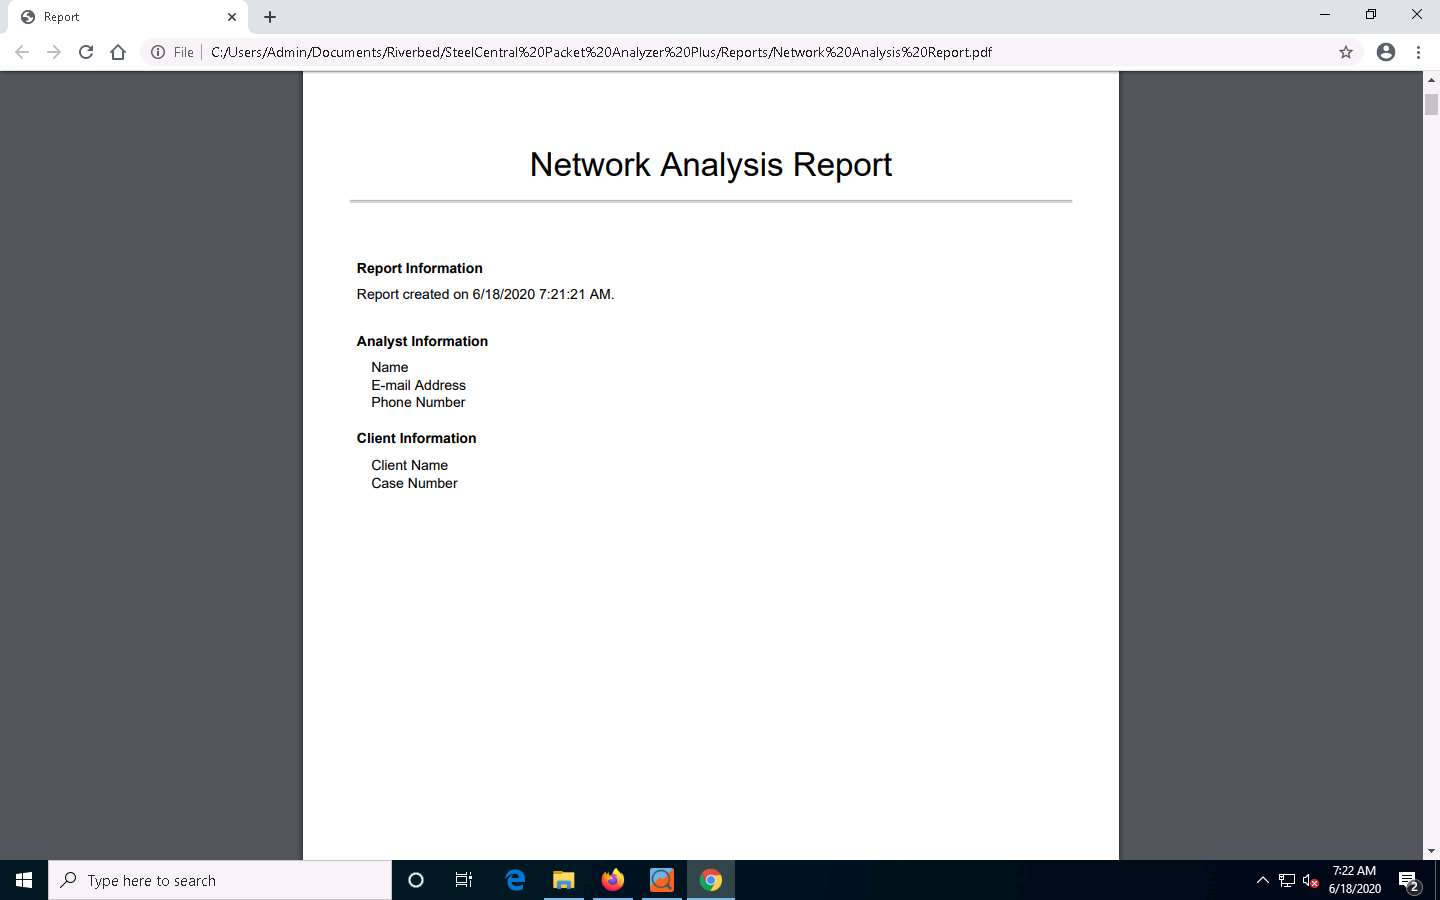
Scroll down to view detailed information on each option shown in Table of Contents.
This concludes the demonstration of analyzing a network using SteelCentral Packet Analyzer.
Close all open windows and document all the acquired information.


Comments
Post a Comment